. 2024 Sep 11;15(1):7939.
doi: 10.1038/s41467-024-52118-7.

The aryl hydrocarbon receptor and FOS mediate cytotoxicity induced by Acinetobacter baumannii

Affiliations

The aryl hydrocarbon receptor and FOS mediate cytotoxicity induced by Acinetobacter baumannii

Chun Kew et al. Nat Commun. .

Abstract

Acinetobacter baumannii is a pathogenic and multidrug-resistant Gram-negative bacterium that causes severe nosocomial infections. To better understand the mechanism of pathogenesis, we compare the proteomes of uninfected and infected human cells, revealing that transcription factor FOS is the host protein most strongly induced by A. baumannii infection. Pharmacological inhibition of FOS reduces the cytotoxicity of A. baumannii in cell-based models, and similar results are also observed in a mouse infection model. A. baumannii outer membrane vesicles (OMVs) are shown to activate the aryl hydrocarbon receptor (AHR) of host cells by inducing the host enzyme tryptophan-2,3-dioxygenase (TDO), producing the ligand kynurenine, which binds AHR. Following ligand binding, AHR is a direct transcriptional activator of the FOS gene. We propose that A. baumannii infection impacts the host tryptophan metabolism and promotes AHR- and FOS-mediated cytotoxicity of infected cells.


Conflict of interest statement

The authors declare no competing interests.

Figures

Fig. 1
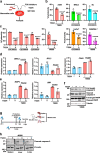
Fig. 1. A. baumannii infection strongly induces the expression of FOS.
a Schematic representation of the proteomics experiment. Created with BioRender.com released under a Creative Commons Attribution-NonCommercial-NoDerivs 4.0 International license (https://creativecommons.org/licenses/by-nc-nd/4.0/deed.en). b Volcano plot of the proteomics data from A549 cells infected with A. baumannii ATCC 19606. Cells were harvested at 6 h post-infection (hpi). c Western blot analysis of A549 cells infected with A. baumannii showing the abundance of FOS, with actin or GAPDH for normalization (3 hpi). d Western blot analysis of MDM cells infected with A. baumannii (MOI 50 or 200) showing the abundance of FOS, with GAPDH for normalization (3 hpi). e Western blot analysis of A549 cells exposed to different bacteria: A. baumannii, enteropathogenic E. coli O127:H6 and P. aeruginosa ATCC 27853 (3 hpi). f Quantification of FOS mRNA levels by qRT-PCR in A549 cells infected with A. baumannii (3 hpi). n = 3 independent experiments. Data are presented as mean values ±SD, P-values by unpaired two-tailed t-test. g The mouse infection challenge model. Wild-type BALB/c mice were injected intraperitoneally (i.p.) with 3 × 103 colony forming units (CFU) of A. baumannii clinical isolate FDA-CDC AR-BANK#0280 (#0280). The animals were euthanized 8 hpi and organs were harvested for western blot analysis. Three pairs of mock and infected animals were analyzed, and similar results were obtained. The experimental design illustration was created with BioRender.com released under a Creative Commons Attribution-NonCommercial-NoDerivs 4.0 International license (https://creativecommons.org/licenses/by-nc-nd/4.0/deed.en). ce The experiments were repeated three times with similar results obtained. See also Supplementary Fig. 1. Source data are provided in the Source Data file.
Fig. 2
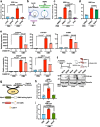
Fig. 2. Inhibition of FOS alleviates the cytotoxicity of A. baumannii infection.
a Schematic representation of the FOS inhibition experiments. Created with BioRender.com released under a Creative Commons Attribution-NonCommercial-NoDerivs 4.0 International license (https://creativecommons.org/licenses/by-nc-nd/4.0/deed.en). b, c Lactate dehydrogenase (LDH) release assay in A549 (24 hpi), MRC-5, BJ, HaCaT (12 hpi), and RAW264.7 (24 hpi) cells infected with A. baumannii and treated with the FOS inhibitors T5224 (100 μM). d, e Quantification of BIRC3, BCL3, CDK5, BNIP3, and BIM mRNA levels by qRT-PCR in A549 cells infected with A. baumannii (3 hpi) with or without T5224 treatment (100 μM). n = 3 independent experiments. f Western blot analysis of A549 cells infected with A. baumannii (6 hpi) with or without T5224 treatment (100 μM); * indicates nonspecific bands. The experiment was repeated three times with similar results obtained. g The mouse infection challenge model with T5224 treatment. Wild-type BALB/c mice were administrated orally with T5224 (250 mg/kg) or vehicle before and after injection i.p. with 3 × 103 CFU of A. baumannii clinical isolate FDA-CDC AR-BANK#0280 (#0280). The animals were euthanized 8 hpi. Created with BioRender.com released under a Creative Commons Attribution-NonCommercial-NoDerivs 4.0 International license (https://creativecommons.org/licenses/by-nc-nd/4.0/deed.en). h Western blot analysis of tissues harvested from the mouse infection model described in (h). Three pairs of infected animals were analyzed, and similar results were obtained. b, c n = 4. Cells were seeded in four different wells per group, Treatment and measurement were performed independently for each well. Experiments were repeated independently three times and similar results were obtained. be Data are presented as mean values ±SD, P-values by unpaired two-tailed t-test. See also Supplementary Fig. 2. Source data are provided in the Source Data file.
Fig. 3
Fig. 3. Bacterial OMVs trigger the induction of FOS.
a Western blot analysis of A549 cells exposed to live or heat-inactivated A. baumannii for 3 h. b Western blot analysis of A549 cells infected with A. baumannii in a transwell setting (3 hpi). The illustration of the transwell was created with BioRender.com released under a Creative Commons Attribution-NonCommercial-NoDerivs 4.0 International license (https://creativecommons.org/licenses/by-nc-nd/4.0/deed.en). c Western blot analysis of A549 cells treated with purified A. baumannii OMVs (100 μg/mL for 3 h) or PBS. d, e Western blot analysis of A549 cells infected with A. baumannii (3 hpi for the colistin treatment group and 6 hpi for the BB-Cl-Amidine treatment group). Colistin (0.2 μg/mL) and BB-Cl-Amidine (5 μM) modulate the production of OMVs. f Schematic representation of the proteomics experiment. Created with BioRender.com released under a Creative Commons Attribution-NonCommercial-NoDerivs 4.0 International license (https://creativecommons.org/licenses/by-nc-nd/4.0/deed.en). g Volcano plot of the proteomics data from A549 cells exposed to A. baumannii OMVs (100 μg/mL for 3 h). ae The experiments were repeated three times with similar results obtained. See also Supplementary Fig. 3. Source data are provided in the Source Data file.
Fig. 4
Fig. 4. FOS induction requires AHR.
a Schematic representation of the regulation of AHR in human cells. Created with BioRender.com released under a Creative Commons Attribution-NonCommercial-NoDerivs 4.0 International license (https://creativecommons.org/licenses/by-nc-nd/4.0/deed.en). b, c Western blot analysis of A549 (B) and MDM cells (C) infected with A. baumannii (3 hpi). d Western blot analysis of A549 cells treated with purified A. baumannii OMVs (100 μg/mL for 3 h) or PBS. CH223191 (10 μM) was added to the designated groups to inhibit AHR. e Western blot analysis of A549 cells treated with purified A. baumannii OMVs (100 μg/mL for 3 h) or PBS. The cells were transfected with the indicated siRNA 48 h before OMV treatment. f Western blot analysis of A549 cells treated with purified A. baumannii OMVs (100 μg/mL for 3 h) or PBS. MG132 (20 μM) was added to the designated groups to inhibit the proteasome. g Western blot analysis of A549 cells treated with FICZ (1 μM for 3 h). h Quantification of FOS mRNA levels by qRT-PCR in A549 cells exposed to A. baumannii OMVs (100 µg/mL for 3 h) and treated with CH223191 (10 μM). i ChIP-qPCR analysis of AHR. DNA associated with AHR in A549 cells was immunoprecipitated using an anti-AHR antibody. Enrichment of the FOS promoter region was confirmed by qPCR. The schematic on the left shows the position of the primers relative to the transcriptional start site (TSS) of FOS. (b-g) The experiments were repeated three times with similar results obtained. h, i n  =  3 independent experiments. Data are presented as mean values +/- SD, P-values by unpaired two-tailed t-test. See also Supplementary Fig. 4. Source data are provided in the Source Data file.
Fig. 5
Fig. 5. OMVs from A. baumannii activate AHR.
a AHR activity reporter (XRE-Luc) assay in A549 cells exposed to OMVs (100 μg/mL for 3 h). Cells were transfected with the indicated siRNA 48 h before OMV treatment. b Schematic showing the key steps of OMV endocytosis and the corresponding inhibitors. Created with BioRender.com released under a Creative Commons Attribution-NonCommercial-NoDerivs 4.0 International license (https://creativecommons.org/licenses/by-nc-nd/4.0/deed.en). c, d AHR activity reporter (XRE-Luc) assay in A549 cells exposed to OMVs (20 μg/mL for 3 h) in the presence of the following chemicals: DMSO (solvent control), CytB (cytochalasin B, inhibitor of actin polymerization), DYN (dynasore, inhibitor of dynamin) and BafA1 (bafilomycin A1, inhibitor of endolysosomal acidification). e Quantification of AHR target gene expression (CYP1A1, CYP1B1, AHRR, TIPARP and STC2) by qRT-PCR in A549 cells exposed to OMVs (100 μg/mL for 3 h). CH223191 (10 μM) was added to inhibit AHR. n  =  3 independent experiments. f The mouse infection challenge model. Wild-type BALB/c mice were injected i.p. with 3 ×10³ CFUs of A. baumannii clinical isolate #0280 followed by western blot analysis of organs for the detection of CYP1A1, with vinculin for normalization. 3 pairs of mock and infected animals were analyzed, and similar results were obtained. The illustration was created with BioRender.com released under a Creative Commons Attribution-NonCommercial-NoDerivs 4.0 International license (https://creativecommons.org/licenses/by-nc-nd/4.0/deed.en). g Schematic showing the function of LpxA in lipid A synthesis. OMVs produced by the ΔlpxA mutant strain of A. baumannii lack lipid A. Created with BioRender.com released under a Creative Commons Attribution-NonCommercial-NoDerivs 4.0 International license (https://creativecommons.org/licenses/by-nc-nd/4.0/deed.en). h, i AHR activity reporter (XRE-Luc) assay in A549 (H) and HEK 293 T (I) cells exposed to OMVs (100 μg/mL for 3 h) isolated from ATCC 19606 or the A. baumannii ΔlpxA mutant (lipid A synthesis mutant). a, c, h, i n = 3. d n = 4. Cells were seeded in 3 or 4 different wells per group, Treatment and measurement were performed independently for each well. Experiments were repeated independently three times and similar results were obtained. a, c, d, e, h, i Data are presented as mean values +/- SD, P-values by unpaired two-tailed t-test. See also Supplementary Fig. 5. Source data are provided in the Source Data file.
Fig. 6
Fig. 6. OMVs activate AHR by modulating host tryptophan metabolism.
a Schematic showing the simplified tryptophan catabolic pathway in human cells. b Western blot analysis of A549 cells exposed to A. baumannii or its OMVs (100 μg/mL for 3 h). The experiment was repeated three times with similar results obtained. c, d AHR activity reporter (XRE-Luc) assay in A549 cells exposed to OMVs (100 μg/mL for 3 h) in the presence of the TDO inhibitor 680C91 (1 μM) or the IDO inhibitor 1-M-D-T (100 μM). e Ratio of kynurenine to tryptophan in A549 cells exposed to OMV (100 μg/mL) and 680C91 (1 μM) for 1 h. Metabolite levels were measured by LC-MS. n = 5 independent experiments. c, d n = 3. Cells were seeded in three different wells per group, treatment and measurement were performed independently for each well. Experiments were repeated independently three times and similar results were obtained. ce Data are presented as mean values ±SD, P-values by unpaired two-tailed t-test. See also Supplementary Fig. 6. Source data are provided in the Source Data file.

References

    1. Tiku, V. Acinetobacter baumannii: virulence strategies and host defense mechanisms. DNA Cell Biol.41, 43–48 (2022). 10.1089/dna.2021.0588 - DOI - PMC - PubMed
    1. Wong, D. et al. Clinical and pathophysiological overview of acinetobacter infections: a century of challenges. Clin. Microbiol Rev.30, 409–447 (2017). 10.1128/CMR.00058-16 - DOI - PMC - PubMed
    1. Harding, C. M., Hennon, S. W. & Feldman, M. F. Uncovering the mechanisms of Acinetobacter baumannii virulence. Nat. Rev. Microbiol.16, 91–102 (2018). 10.1038/nrmicro.2017.148 - DOI - PMC - PubMed
    1. Göttig, S. et al. Detection of pan drug-resistant Acinetobacter baumannii in Germany. J. Antimicrob. Chemother.69, 2578–2579 (2014). 10.1093/jac/dku170 - DOI - PubMed
    1. Tillotson, G. A crucial list of pathogens. Lancet Infect. Dis.18, 234–236 (2018). 10.1016/S1473-3099(17)30754-5 - DOI - PubMed

Publication types

MeSH terms

LinkOut - more resources