. 2024 Sep 11;15(1):7957.
doi: 10.1038/s41467-024-51938-x.

IL-1β promotes adipogenesis by directly targeting adipocyte precursors

Affiliations

IL-1β promotes adipogenesis by directly targeting adipocyte precursors

Kaisa Hofwimmer et al. Nat Commun. .

Abstract

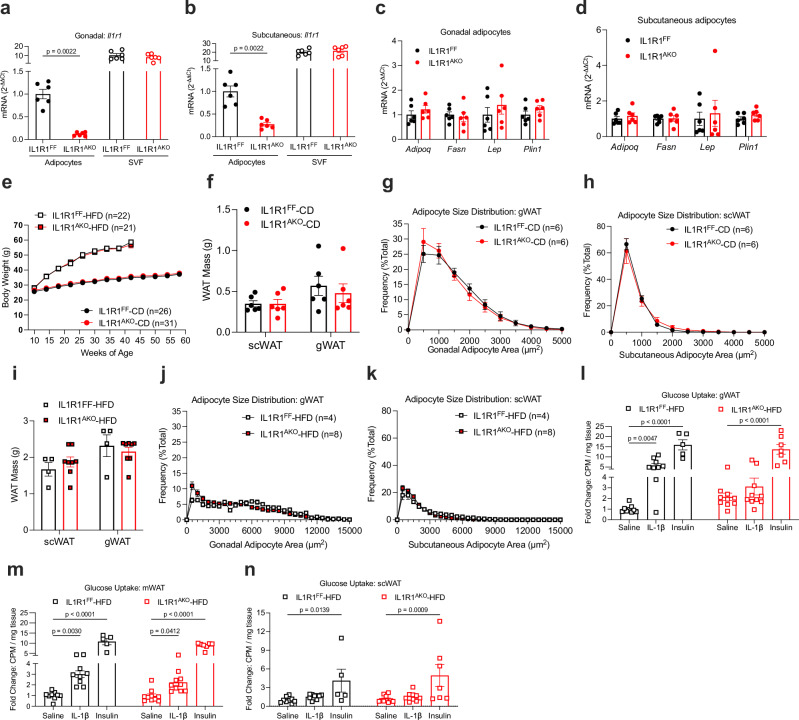
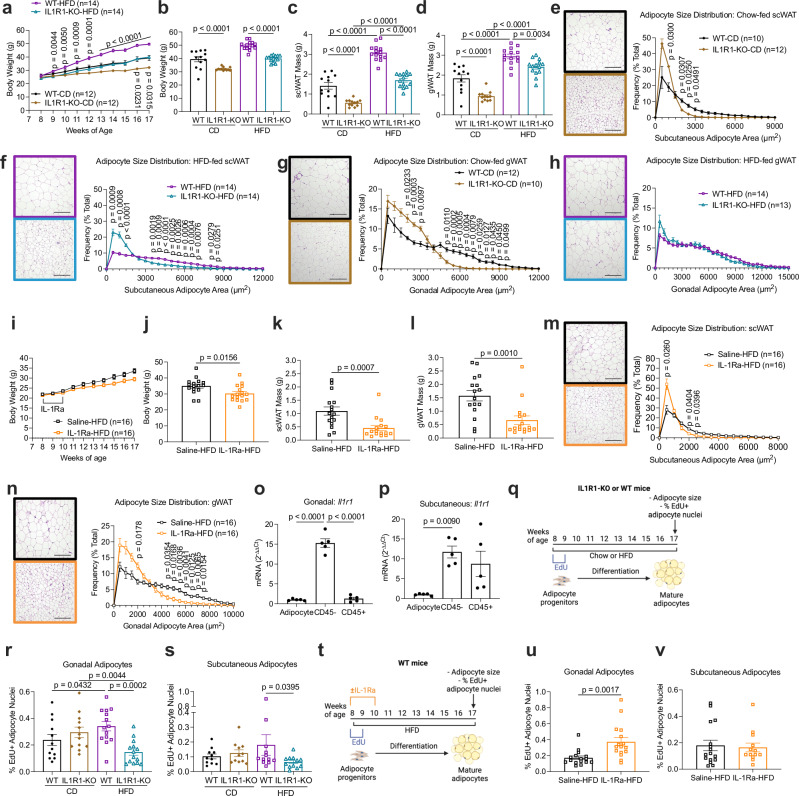
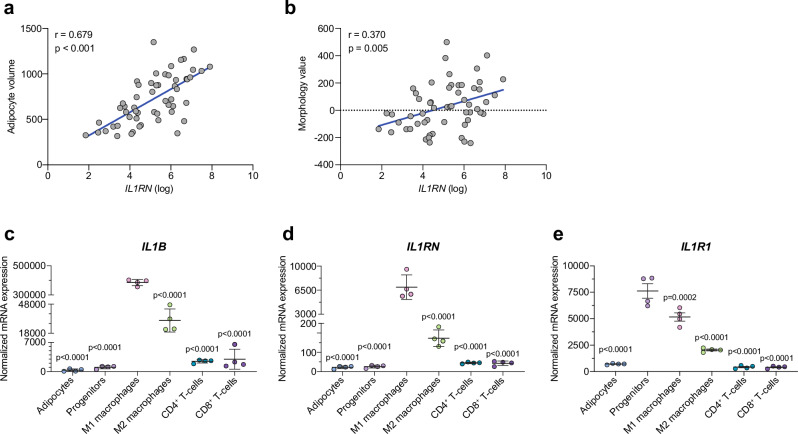
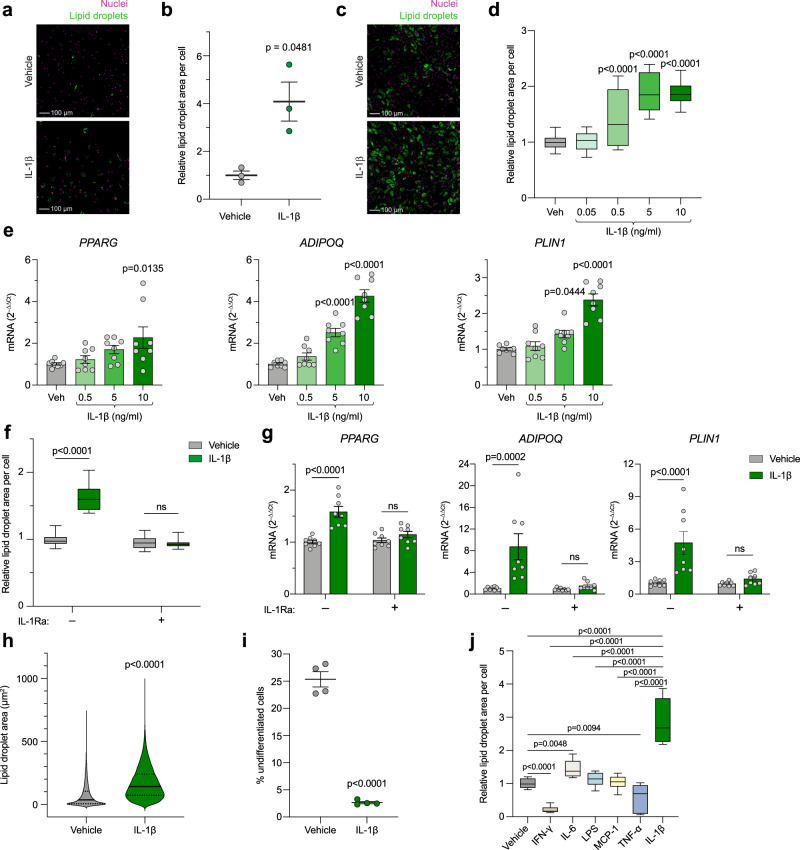
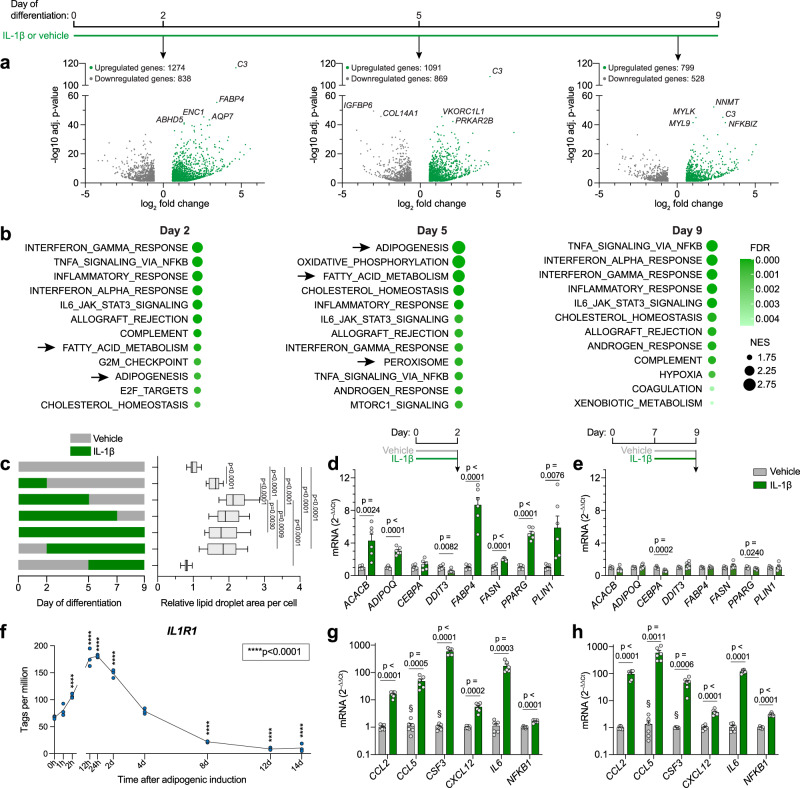
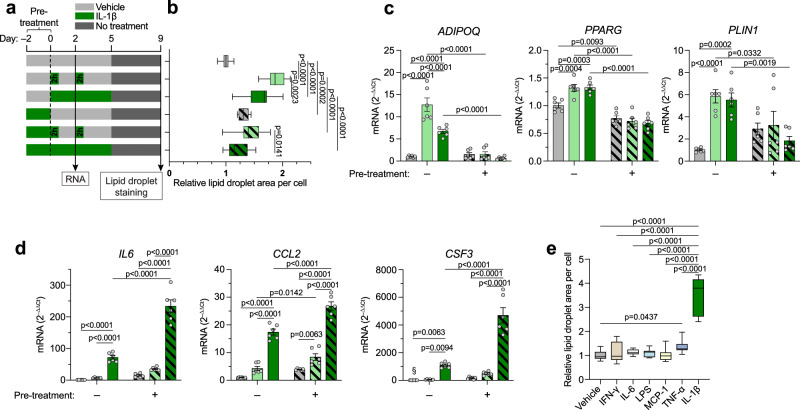
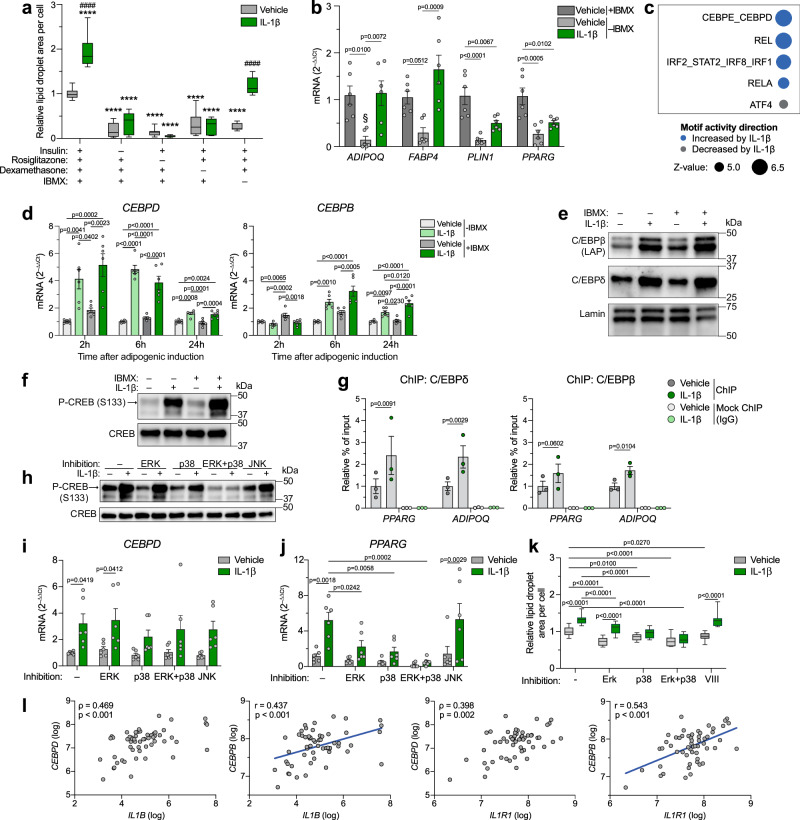
Postprandial IL-1β surges are predominant in the white adipose tissue (WAT), but its consequences are unknown. Here, we investigate the role of IL-1β in WAT energy storage and show that adipocyte-specific deletion of IL-1 receptor 1 (IL1R1) has no metabolic consequences, whereas ubiquitous lack of IL1R1 reduces body weight, WAT mass, and adipocyte formation in mice. Among all major WAT-resident cell types, progenitors express the highest IL1R1 levels. In vitro, IL-1β potently promotes adipogenesis in murine and human adipose-derived stem cells. This effect is exclusive to early-differentiation-stage cells, in which the adipogenic transcription factors C/EBPδ and C/EBPβ are rapidly upregulated by IL-1β and enriched near important adipogenic genes. The pro-adipogenic, but not pro-inflammatory effect of IL-1β is potentiated by acute treatment and blocked by chronic exposure. Thus, we propose that transient postprandial IL-1β surges regulate WAT remodeling by promoting adipogenesis, whereas chronically elevated IL-1β levels in obesity blunts this physiological function.


Conflict of interest statement

The authors declare no competing interests.

Figures

Fig. 1
Fig. 1. IL1R1AKO mice have no metabolic phenotype.
a, b Relative mRNA expression in adipocytes and stromal vascular fraction (SVF) isolated from gWAT (a) and scWAT (b) of 12-week-old chow-diet-fed male mice (n = 6). c, d Relative mRNA expression in adipocytes isolated from gWAT (c) and scWAT (d) of 12-week-old chow-fed male mice (n = 6). e Body weight development of chow-fed (IL1R1FF n = 26; IL1R1AKO n = 31) and HFD-fed (IL1R1FF n = 22; IL1R1AKO n = 21) male mice. fh Fat pad mass (f) and adipocyte size distribution in gWAT (g) and scWAT (h) of chow-fed 17-week-old male mice (n = 6). ik Fat pad mass (i) and adipocyte size distribution in gWAT (j) and scWAT (k) of 17-week-old male mice HFD- fed for 9 weeks (IL1R1FF n = 4; IL1R1AKO n = 8). ln In vivo glucose uptake in gWAT (l), mWAT (m), and scWAT (n) of 12-week-old male mice, HFD-fed for 4 days, treated with saline, IL-1β (1 μg/kg bw), or insulin (1U/kg bw). IL1R1FF: saline (n = 9), IL-1β (n = 9), insulin (n = 5); IL1R1AKO: saline (n = 9), IL-1β (n = 10), insulin (n = 7). Data are shown as fold change of counts per minute (CPM). n=biological replicates. Data are shown as individual measurements and mean ± SEM. Statistical analyses were performed by unpaired nonparametric two-tailed Mann-Whitney U test (ad, f, i) or two-way ANOVA and Šidák’s (e, g, h, j, k) or Fisher’s LSD (ln) multiple comparison test. Source data are provided as a Source Data File.
Fig. 2
Fig. 2. IL-1R1 signaling modulates body weight, WAT mass, adipocyte size, and new fat cell formation.
ad Body weight development (a), body weight (b), fat pad mass (c, d) of 17-week-old chow and HFD-fed male mice. n = 12 WT-CD, n = 12 IL1R1-KO-CD, n = 14 WT-HFD, n = 14 IL1R1-KO-HFD. eh Adipocyte size distribution (eh) of 17-week-old chow and HFD-fed male mice. n = 10 IL1R1-WT-CD, n = 12 IL1R1-KO-CD (e). n = 14 per genotype (f). n = 12 IL1R1-WT-CD, n = 10 IL1R1-KO-CD (g). n = 14 IL1R1-WT-HFD, n = 13 IL1R1-KO-HFD (h). in Body weight development (i), body weight (j), fat pad mass (k, l) and adipocyte size distribution (m, n) of 17-week-old HFD-fed male mice treated with IL-1Ra (10 mg/kg bw daily for 14 days, n = 16 for both conditions). o, p Relative Il1r1 mRNA expression in adipocytes, CD45, and CD45+ stromal vascular cells isolated from gWAT (o) and scWAT (p) of 12-week-old chow-fed male WT mice (n = 5). qs Experimental scheme of EdU tracing experiments (100 μg EdU/day, every 2 days, total of 4 injections) (q) and percentage of EdU+ adipocyte nuclei isolated from gWAT (r) and scWAT (s) of IL1R1-KO mice and WT controls. gWAT IL1R1-KO and gWAT WT: chow diet (n = 12 per genotype); HFD (n = 14 per genotype). scWAT IL1R1-KO and scWAT WT: chow diet (n = 11 per genotype); HFD (n = 12 per genotype). tv Experimental scheme of EdU tracing experiments (100 μg EdU/day, every 2 days, total 4 injections) and IL-1Ra therapy (10 mg/kg bw daily for 14 days) (t) and percentage of EdU+ adipocyte nuclei isolated from gWAT (u) and scWAT (v) of HFD-fed WT mice. gWAT: saline and IL-1Ra (n = 16). scWAT: saline (n = 16); IL-1Ra (n = 13). Scale bar = 200 µm. Experimental schemes created with biorender.com. n = biological replicates. Data are shown as individual measurements and mean ± SEM. Statistical analyses were performed by: unpaired nonparametric two-tailed Mann-Whitney U test (jl, u, v); one-way ANOVA and Šidák’s multiple comparison test (o, p); or two-way ANOVA and Šidák’s (a, ei, m, n) or Fisher’s LSD (bd, r, s) multiple comparison test. Source data are provided as a Source Data File.
Fig. 3
Fig. 3. Reduced IL-1 signaling correlates to hypertrophic adipocytes, and progenitors express the highest levels of IL1R1 in human scWAT.
a, b Pearson correlation of human scWAT IL1RN expression and adipocyte volume (a) or morphology value (b) where positive and negative values indicate WAT hypertrophy and hyperplasia, respectively (n = 56). Two-tailed p-values. c-e Expression of IL1B (c), IL1RN (d) and IL1R1 (e) in adipocytes and FACs-sorted stromal vascular cell populations from human scWAT (n = 6 donors, pooled 3 and 3 and processed in duplicates). Statistical analyses by one-way ANOVA and Dunnett’s multiple comparisons test compared to M1 macrophages (c, d) or progenitors (e). Line and error bars represent mean ± SEM. Source data are provided as a Source Data File.
Fig. 4
Fig. 4. IL-1β, but not other inflammatory factors, potently promotes adipogenesis in human adipocyte progenitors in vitro.
a, b Representative images (a) and quantification (b) of lipid droplet accumulation in freshly FACS-sorted scWAT-derived human primary adipocyte progenitors differentiated for 13 days with IL-1β (5 ng/ml) (n = 3 donors). Scale bar = 100 μm. c, d Representative images (c) and quantification (d) of lipid droplet accumulation in hASCs differentiated for 9 days with indicated concentrations of IL-1β (10 ng/ml in c) (n = 3 independent experiments with ≥ 4 replicates (34 datapoints for vehicle and 12 for the rest)). Scale bar = 100 μm. e Adipogenic gene expression on day 2 (PPARG) or 5 (ADIPOQ and PLIN1) of differentiation in hASCs treated with IL-1β from start of differentiation (n = 4 independent experiments with 2 replicates). f Lipid droplet accumulation in hASCs differentiated for 9 days with IL-1β (10 ng/ml) and IL-1Ra (500 ng/ml) (n = 4 independent experiments with ≥ 4 replicates (33 datapoints for –IL-1Ra +vehicle and 16 for the rest)). g Adipogenic gene expression in hASCs 2 days after adipogenic induction +/– IL-1β (10 ng/ml) and IL-1Ra (500 ng/ml) (n = 4 independent experiments with 2 replicates). h, i Single-cell resolution image analysis of lipid droplet area in individual cells (hASCs differentiated for 9 days with 10 ng/ml IL-1β). Distribution of total area covered by lipid droplets within individual cells (h) and % of undifferentiated cells (i) (n = 4 analyzed wells per condition, each well containing around 104 cells). j Lipid droplet accumulation in hASCs differentiated for 9 days with IFN-γ (10 ng/ml), IL-6 (10 ng/ml), LPS (100 ng/ml), MCP-1 (20 ng/ml), TNF-α (10 ng/ml), IL-1β (10 ng/ml), or vehicle (n = 3 independent experiments with ≥ 4 replicates (14 datapoints for vehicle and 12 for the rest)). Statistical analyses by paired (b) or unpaired (i) two-sided t test, one-way ANOVA and Dunnett’s multiple comparisons test compared to vehicle (d, e, j) or IL-1β (j), two-way ANOVA and Šidák’s multiple comparisons test (f, g), or Mann-Whitney test (h). Data are represented as individual measurements and mean ± SEM, box-and-whisker plots (line inside box = median; box limits = first and third quartiles; whisker ends = minima and maxima), or violin plots. Source data are provided as a Source Data File.
Fig. 5
Fig. 5. The adipogenic stimulation by IL-1β is limited to the early differentiation stage.
a RNA-seq of differentiating hASCs treated with IL-1β from start of adipogenic induction and collected on day 2, 5, and 9 of differentiation. Volcano plots show genes significantly regulated by IL-1β (adjusted p-value < 0.05, fold change > 1.5 and < –1.5) compared to vehicle, as analyzed by Wald test corrected for multiple testing using the Benjamini-Hochberg method. The five most significantly regulated genes on each day are labelled (n = 4 independent experiments). b Gene Set Enrichment Analysis of RNA-seq data described in (a). The 12 most highly enriched Hallmark gene sets (by normalized enrichment score, NES) in IL-1β-treated cells on each day are shown. Arrows indicate pathways directly related to adipogenesis or lipid handling. c Lipid droplet accumulation on day 9 of differentiation in hASCs treated with IL-1β at indicated differentiation stages (n = 4 independent experiments with ≥ 4 replicates (52 datapoints for vehicle and 16 for the rest)). d, e Adipogenesis- and adipocyte phenotype-related gene expression in hASCs treated with IL-1β on day 0 (d) or 7 (e) of differentiation and collected 48 h later (n = 3 independent experiments with 2 replicates). f IL1R1 expression, measured by Cap Analysis of Gene Expression (CAGE), of hASCs at indicated time points after adipogenic induction (n = 3 replicates). g, h Expression of pro-inflammatory genes in hASCs treated with IL-1β on day 0 (g) or 7 (h) of differentiation and collected 48 h later (n = 3 independent experiments with 2 replicates). Statistical analyses by one-way ANOVA and Dunnett’s multiple comparisons tests compared to vehicle (c), to IL-1β treatment days 0–5 (c), or to 0 h (f), or two-sided unpaired t-test (d, e, g, h). IL-1β: 10 ng/ml in all panels. Data are represented as box-and-whisker plots (line inside box = median; box limits = first and third quartiles; whisker ends = minima and maxima) or individual measurements and mean ± SEM. § denotes conditions with undetectable mRNA levels in all or some samples. Source data are provided as a Source Data File.
Fig. 6
Fig. 6. Distinct effects of acute and chronic IL-1β exposure on adipogenic and inflammatory response.
a Schematic of treatments in experiments shown in (bd). b Lipid droplet accumulation in hASCs treated as shown in (a) (n = 3 independent experiments with 4 replicates (12 datapoints per condition)). c, d Expression of adipogenic (c) and pro-inflammatory (d) genes in hASCs treated as shown in (a). Conditions are color/pattern coded as in (b) (n = 3 independent experiments with 2 replicates). e Lipid droplet accumulation on day 9 of differentiation in hASCs exposed to IFN-γ (10 ng/ml), IL-6 (10 ng/ml), LPS (100 ng/ml), MCP-1 (20 ng/ml), TNF-α (10 ng/ml), IL-1β, or vehicle for 2 h on day 0 and day 2 (n = 3 independent experiments with ≥ 4 replicates (14 datapoints for vehicle and 12 for the rest)). Statistical analyses by two-way ANOVA and Tukey’s and Šidák’s multiple comparisons tests (bd) or one-way ANOVA and Dunnett’s multiple comparisons tests compared to vehicle or to IL-1β (e). IL-1β: 10 ng/ml in all panels. Data are represented as box-and-whisker plots (line inside box = median; box limits = first and third quartiles; whisker ends = minima and maxima) or individual measurements and mean ± SEM. Source data are provided as a Source Data File.
Fig. 7
Fig. 7. IL-1β increases expression of C/EBPδ and C/EBPβ and their subsequent binding near adipogenic genes.
a Lipid droplet accumulation in hASCs differentiated for 9 days in complete (n = 18 datapoints) or suboptimal (n = 12 datapoints) adipogenic cocktail and +/– IL-1β for the first five days (n = 3 independent experiments with ≥ 4 replicates). b Adipogenic gene expression in hASCs 2 days after adipogenic induction +/– IBMX and IL-1β (n = 3 independent experiments with 2 replicates). § denotes conditions with undetectable mRNA levels in all/some samples. c Top 5 predicted IL-1β-regulated motifs in hASCs 2 days after adipogenic induction +/– IL-1β, analyzed by ISMARA (n = 4 independent experiments). d Gene expression at indicated time points after adipogenic induction +/– IBMX and IL-1β (n = 3 independent experiments with 2 replicates). e, f Western blot on protein collected 24 h (e) or 30 min (f) after adipogenic induction +/– IBMX and IL-1β (one representative blot from 3 independent experiments). g ChIP-qPCR of hASCs 20 h after adipogenic induction +/– IL-1β (n = 3 independent experiments). Data shown as % of input normalized to vehicle in the C/EBPδ- or C/EBPβ-pulldown. h Western blot on protein collected 30 min after adipogenic induction with IL-1β and indicated inhibitor(s) (one representative blot from 3 independent experiments). ik Gene expression (i, j) and lipid droplet accumulation (k) in hASCs after 2 h (i), 24 h (j) and 9 days (k) of differentiation +/– IL-1β for the first 2 h and indicated inhibitor(s) for the first 2 (i) or 24 (j, k) h (n = 3 independent experiments with 2 (i, j) or ≥ 4 (k) replicates (k: 18 datapoints for inhibitor-free conditions and 12 for the rest)). l Pearson (r coefficient) or Spearman (ρ coefficient) correlations between scWAT mRNA levels of IL1B/IL1R1 and CEBPD/CEBPB in a clinical cohort (n = 56). Two-tailed p-values. IL-1β: 10 ng/ml in all panels. Statistical analyses by two-way ANOVA and Dunnett’s (****p < 0.0001 in a) or Šidák’s (####p < 0.0001 in a) multiple comparisons test against vehicle of complete adipogenic cocktail or within each adipogenic cocktail condition, respectively (a), and against matched treatment (vehicle or IL-1β) without inhibitor or within each inhibitor condition, respectively (i-k), one-way ANOVA and Tukey’s multiple comparisons test (b, d), or two-sided ratio paired t test (g). Data are represented as box-and-whisker plots (line inside box = median; box limits = first and third quartiles; whisker ends = minima and maxima) or individual measurements and mean ± SEM. Source data are provided as a Source Data File.

References

    1. Lonn, M., Mehlig, K., Bengtsson, C. & Lissner, L. Adipocyte size predicts incidence of type 2 diabetes in women. FASEB J.24, 326–331 (2010). 10.1096/fj.09-133058 - DOI - PubMed
    1. Lundgren, M. et al. Fat cell enlargement is an independent marker of insulin resistance and ‘hyperleptinaemia. Diabetologia50, 625–633 (2007). 10.1007/s00125-006-0572-1 - DOI - PubMed
    1. Cotillard, A. et al. Adipocyte size threshold matters: link with risk of type 2 diabetes and improved insulin resistance after gastric bypass. J. Clin. Endocrinol. Metab.99, E1466–E1470 (2014). 10.1210/jc.2014-1074 - DOI - PubMed
    1. Weyer, C., Foley, J. E., Bogardus, C., Tataranni, P. A. & Pratley, R. E. Enlarged subcutaneous abdominal adipocyte size, but not obesity itself, predicts type II diabetes independent of insulin resistance. Diabetologia43, 1498–1506 (2000). 10.1007/s001250051560 - DOI - PubMed
    1. Acosta, J. R. et al. Increased fat cell size: a major phenotype of subcutaneous white adipose tissue in non-obese individuals with type 2 diabetes. Diabetologia59, 560–570 (2016). 10.1007/s00125-015-3810-6 - DOI - PubMed

Publication types

MeSH terms

Associated data