. 2024 Sep 11;14(1):156.
doi: 10.1038/s41408-024-01133-4.

Association of ADAM family members with proliferation signaling and disease progression in multiple myeloma

Affiliations

Association of ADAM family members with proliferation signaling and disease progression in multiple myeloma

Marietheres Evers et al. Blood Cancer J. .

Abstract

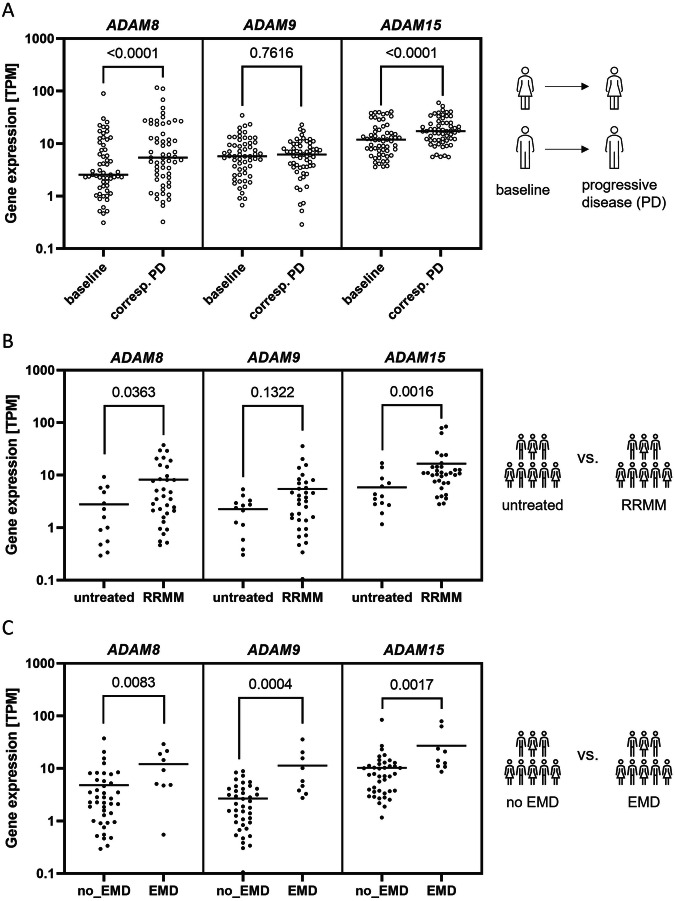
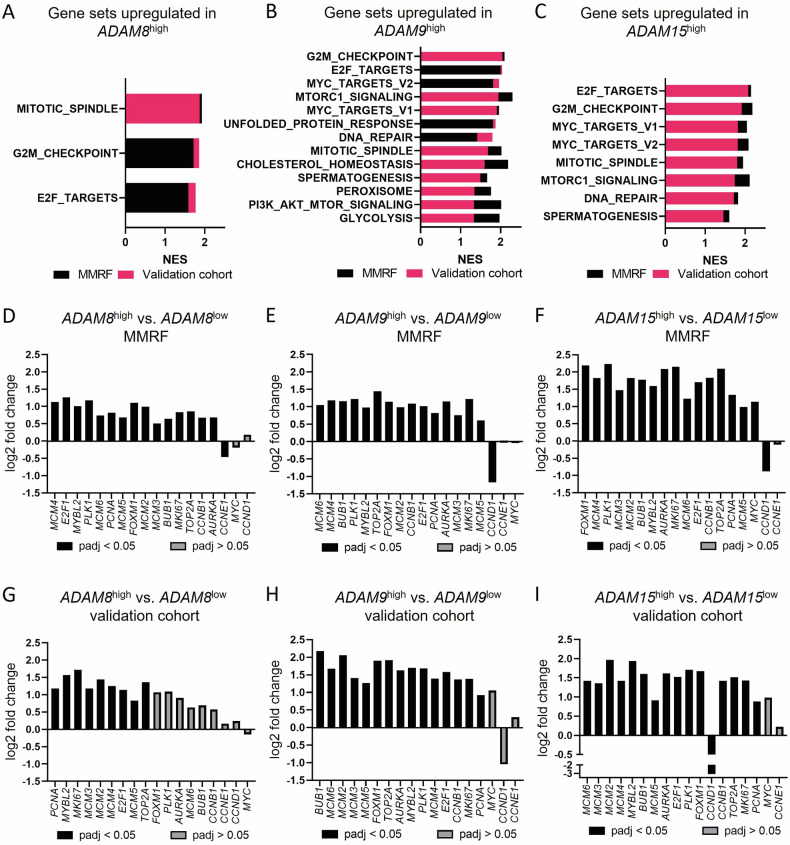
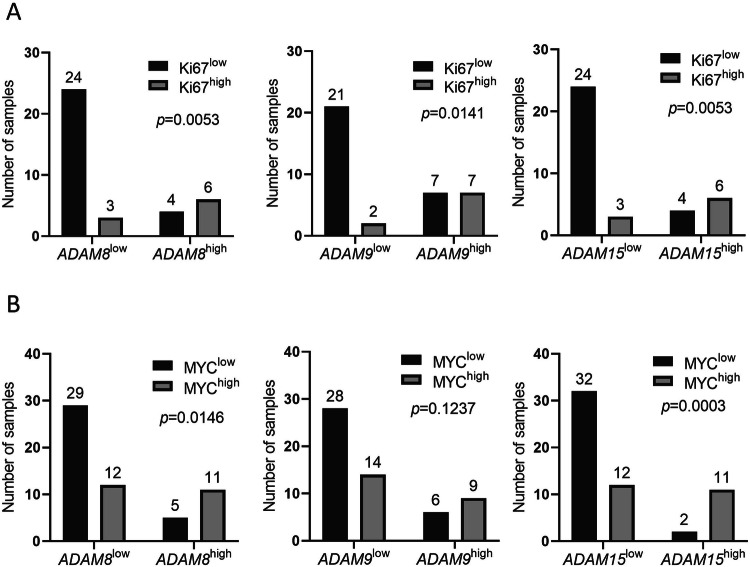
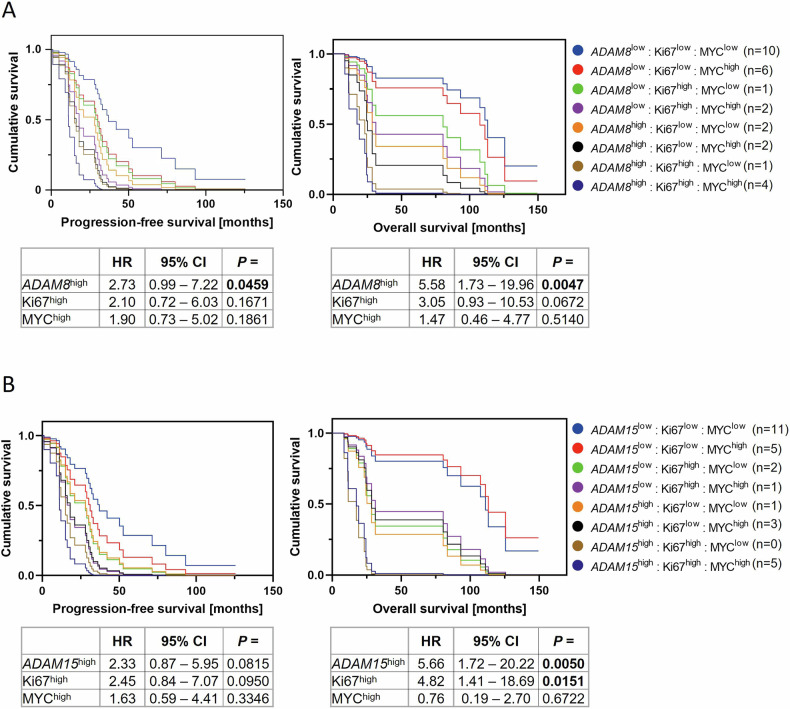
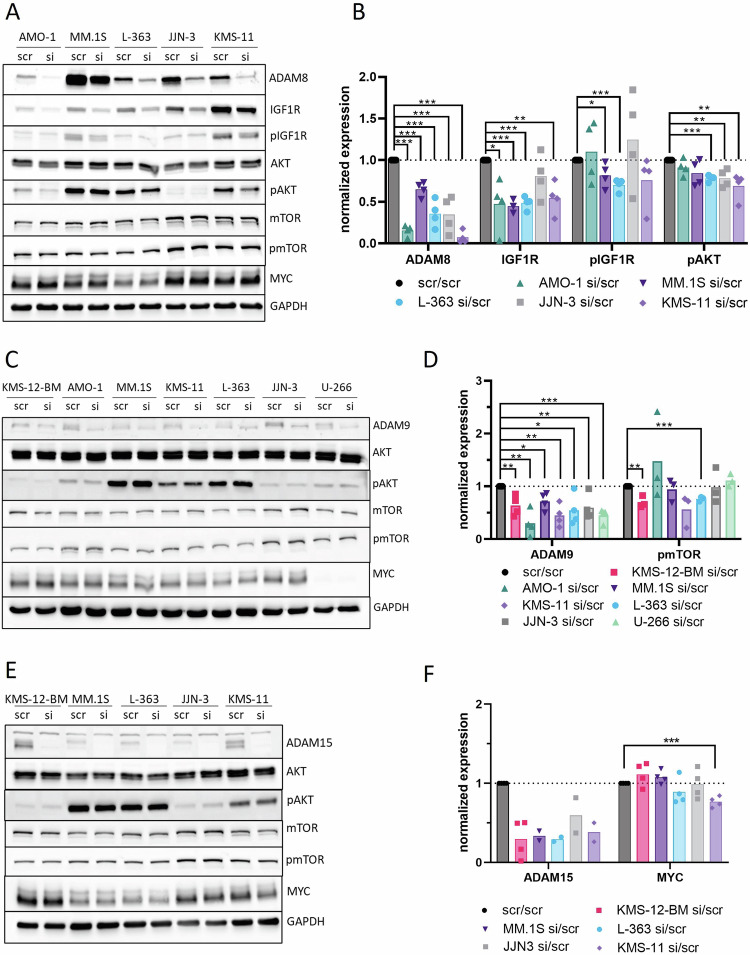
Multiple myeloma (MM) is a hematological malignancy whose curability is greatly challenged by recurrent patient relapses and therapy resistance. We have previously proposed the high expression of ADAM8, ADAM9 and ADAM15 (A Disintegrin And Metalloproteinase 8/9/15) as adverse prognostic markers in MM. This study focused on the so far scarcely researched role of ADAM8/9/15 in MM using two patient cohorts and seven human MM cell lines (HMCL). High ADAM8/9/15 expression was associated with high-risk cytogenetic abnormalities and extramedullary disease. Furthermore, ADAM8/15 expression increased with MM progression and in relapsed/refractory MM compared to untreated patient samples. RNA sequencing and gene set enrichment analysis comparing ADAM8/9/15high/low patient samples revealed an upregulation of proliferation markers and proliferation-associated gene sets in ADAM8/9/15high patient samples. High ADAM8/9/15 expression correlated with high Ki67 and high ADAM8/15 expression with high MYC protein expression in immunohistochemical stainings of patient tissue. Conversely, siRNA-mediated knockdown of ADAM8/9/15 in HMCL downregulated proliferation-related gene sets. Western blotting revealed that ADAM8 knockdown regulated IGF1R/AKT signaling and ADAM9 knockdown decreased mTOR activation. Lastly, high ADAM8/9/15 expression levels were verified as prognostic markers independent of Ki67/MYC expression and/or high-risk abnormalities. Overall, these findings suggest that ADAM8/9/15 play a role in MM progression and proliferation signaling.


Conflict of interest statement

The authors declare no competing interests.

Figures

Fig. 1
Fig. 1. High expression of ADAM8, ADAM9 and ADAM15 is associated with progressive disease.
A Comparison of ADAM8, ADAM9 and ADAM15 GE between the baseline sample (first sample acquired when patient entered the study) and corresponding samples taken from the same patient at a stage of progressive disease (corresp. PD) in the MMRF cohort (n = 59 patients in analysis). Samples were treated as replicates if more than one PD sample was available for a patient. Statistical test was Wilcoxon-test. Lines show the mean GE. B Comparison of ADAM8, ADAM9 and ADAM15 GE between unpaired samples (except for 2) obtained from untreated patients (n = 13) and RRMM (n = 34) from the validation cohort. When more than one sample taken at the same stage was available for a patient, the mean was used. Statistical test was Mann–Whitney-U. Lines show the mean GE. C Comparison of ADAM8, ADAM9 and ADAM15 GE between unpaired samples from patients with or without extramedullary disease (EMD: n = 9 or no_EMD: n = 41) at biopsy in the validation cohort. Where more than one sample with the same EMD status was available from one patient, the mean GE of these samples was used. One patient acquired EMD within the course of the study, the remaining patients did not change groups. Statistical test was Mann–Whitney-U. Lines show the mean GE. Patient information and treatment for the validation cohort is summarized in Supplementary Table S3.
Fig. 2
Fig. 2. ADAM8/9/15 expression levels influence proliferation signaling in MM.
Summary of gene sets where a significant enrichment (FDR q value < 0.25) was found in A ADAM8high, B ADAM9high or C ADAM15high patient samples from both the MMRF (black) and validation cohort (red). NES Normalized enrichment score. A summary of all enriched gene sets is shown in Supplementary Table S8. DI Log2 fold change of expression of commonly used proliferation markers between ADAM8/9/15high vs. ADAM8/9/15low primary MM samples. Top 10% (MMRF (DF)) or 25% (validation cohort (GI)) of samples with the highest/lowest ADAM8/9/15 GE were included. padj values (p value adjusted for multiple hypothesis testing) increase from left to right. Significantly differentially expressed genes (padj < 0.05) have black bars, genes with padj > 0.05 are depicted in gray. A summary of all differentially expressed genes is shown in Supplementary Table S7.
Fig. 3
Fig. 3. Ki67 and MYC protein expression in samples from the validation cohort.
A Samples with high Ki67 protein expression determined by IHC are significantly enriched in ADAM8/9/15high patient samples from the validation cohort. B Samples with high MYC protein expression determined by IHC are significantly enriched in ADAM8/15high but not in ADAM9high patient samples from the validation cohort. ADAM8/9/15high/low: ADAM8/9/15 GE>/≤ mean of all samples. Ki67high/low: ≥30%/<30% Ki+ CD138+ cells. MYChigh/low: ≥40%/<40% MYC+ CD138+ cells. Statistical test was Fisher’s exact test. For exemplary Ki67 stainings see Supplementary Fig. S7. For MYC stainings see ref. [33].
Fig. 4
Fig. 4. High ADAM8 and ADAM15 expression levels are independent prognostic markers in MM.
Cox proportional hazards model assessing the effect of high Ki67, MYC and (A) ADAM8 or (B) ADAM15 expression on progression-free survival (left) and overall survival (right) in the validation cohort. ADAM8/15high patients have an ADAM8/15 GE >mean of all samples. Ki67high patients had at least one sample with ≥30% Ki67-expressing CD138+ cells. MYChigh was assigned to a patient if at least one sample contained ≥40% MYC-expressing MM cells. n = 28 patients. HR hazard ratio, CI confidence interval.
Fig. 5
Fig. 5. ADAM8/9/15 siRNA knockdowns in HMCL.
AF Evaluation of expression and activation of members of the PI3K/AKT/mTOR signaling pathway and MYC expression using Western blotting after ADAM8/9/15 siRNA knockdown. Cells were transfected with either scr-siRNA control (scr) or ADAM8/9/15-specific siRNA (si) in four independent rounds of experiments, respectively. A, C, E Representative Western blots. Pan and phospho-markers were detected on separate blots and only the relevant area of the blots is shown. Housekeeper (GAPDH) was detected on each blot, representative GAPDH staining is shown. B, D, F Summary of normalized expression for all evaluable rounds of experiments for markers where an effect was observed. The expression of each marker was first normalized to the expression of the housekeeper and subsequently the siRNA samples were normalized to the scr-siRNA controls. Each data point represents one independent round of experiments. Bars show the mean. Statistical test was two-tailed t-test. * for p < 0.05, ** for p < 0.01, *** for p < 0.001. B n = 4 for all markers statistically evaluated except for IGF1R in MM.1S (n = 3). D n = 4 for ADAM9, n = 3 for pmTOR. F n = 4 for MYC. ADAM15 was only evaluable for all cell lines in two rounds of experiments because of a complete lack of bands for the siRNA transfected HMCLs in the other rounds due to a complete knockdown (see blot in E). The difference in ADAM15 expression levels between scr and si was therefore not statistically evaluated.

References

    1. Rajkumar SV. Multiple myeloma: 2022 update on diagnosis, risk stratification, and management. Am J Hematol. 2022;97:1086–107. 10.1002/ajh.26590 - DOI - PMC - PubMed
    1. Kumar SK, Dispenzieri A, Lacy MQ, Gertz MA, Buadi FK, Pandey S, et al. Continued improvement in survival in multiple myeloma: changes in early mortality and outcomes in older patients. Leukemia. 2014;28:1122–8. 10.1038/leu.2013.313 - DOI - PMC - PubMed
    1. Durie BGM, Hoering A, Abidi MH, Rajkumar SV, Epstein J, Kahanic SP, et al. Bortezomib with lenalidomide and dexamethasone versus lenalidomide and dexamethasone alone in patients with newly diagnosed myeloma without intent for immediate autologous stem-cell transplant (SWOG S0777): a randomised, open-label, phase 3 trial. Lancet. 2017;389:519–27. 10.1016/S0140-6736(16)31594-X - DOI - PMC - PubMed
    1. Kawano Y, Moschetta M, Manier S, Glavey S, Görgün GT, Roccaro AM, et al. Targeting the bone marrow microenvironment in multiple myeloma. Immunol Rev. 2015;263:160–72. 10.1111/imr.12233 - DOI - PubMed
    1. Karamanos NK, Theocharis AD, Piperigkou Z, Manou D, Passi A, Skandalis SS, et al. A guide to the composition and functions of the extracellular matrix. FEBS J. 2021;288:6850–912. 10.1111/febs.15776 - DOI - PubMed

Publication types