. 2024 Sep 11;15(1):7968.
doi: 10.1038/s41467-024-52145-4.

Multiscale mapping of transcriptomic signatures for cardiotoxic drugs

Affiliations

Multiscale mapping of transcriptomic signatures for cardiotoxic drugs

Jens Hansen et al. Nat Commun. .

Abstract

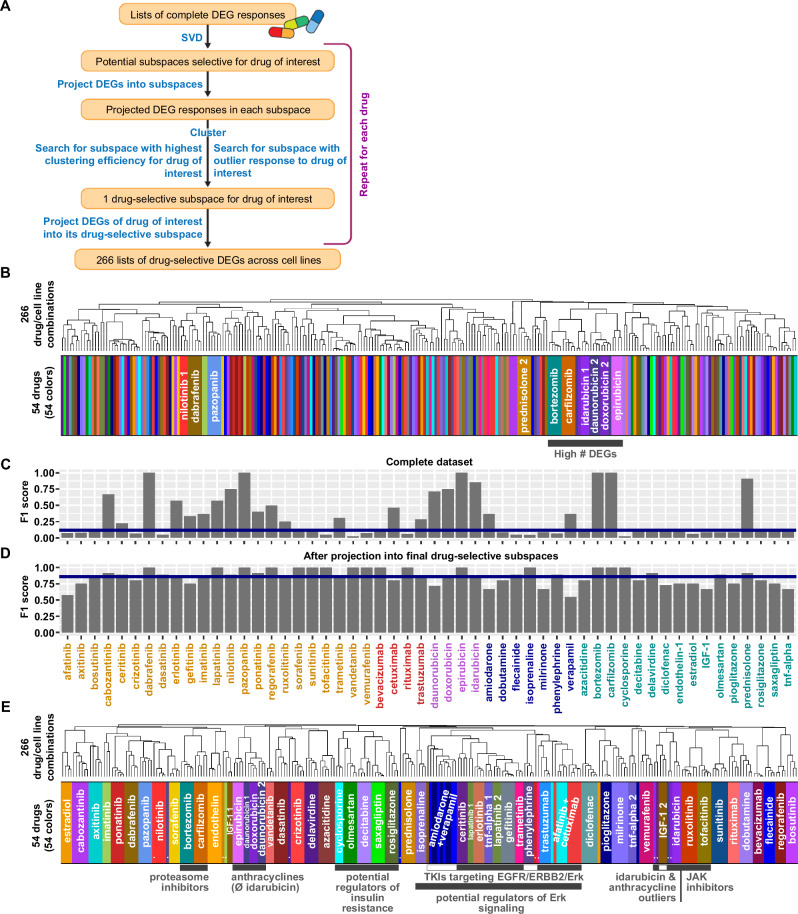
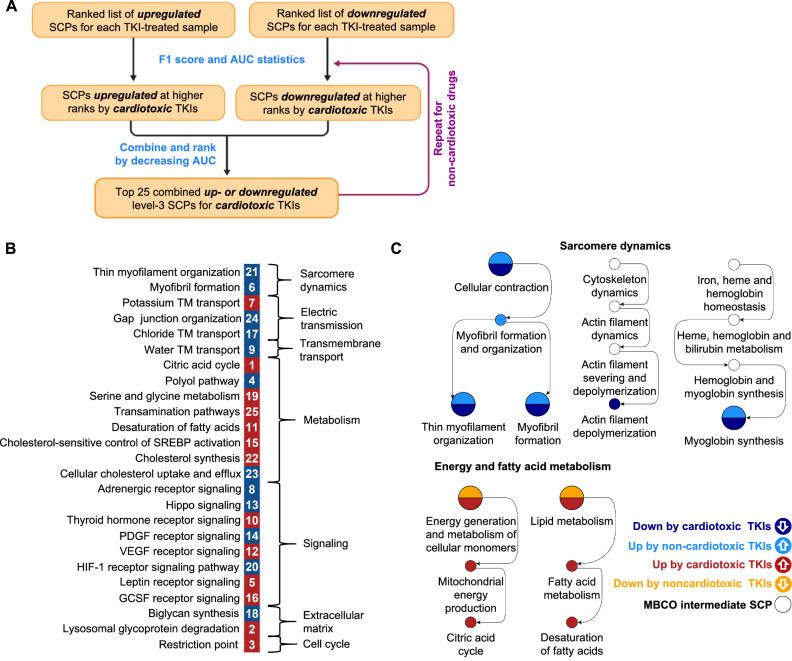
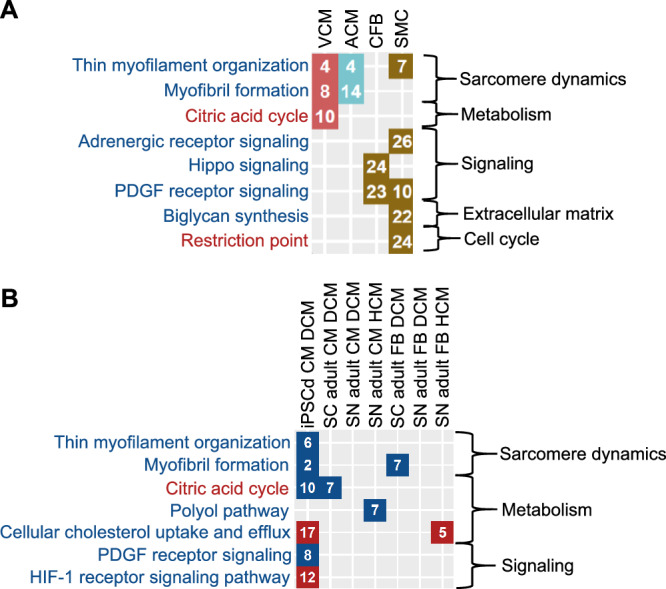
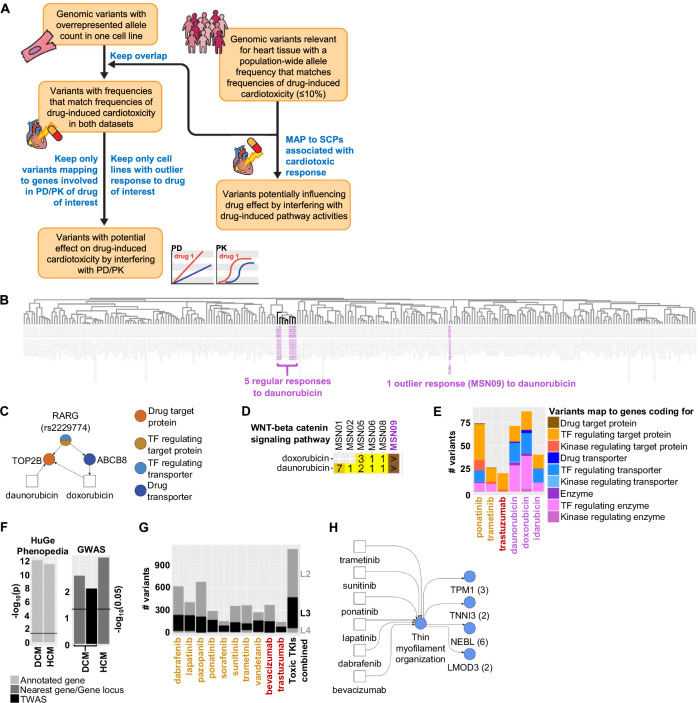
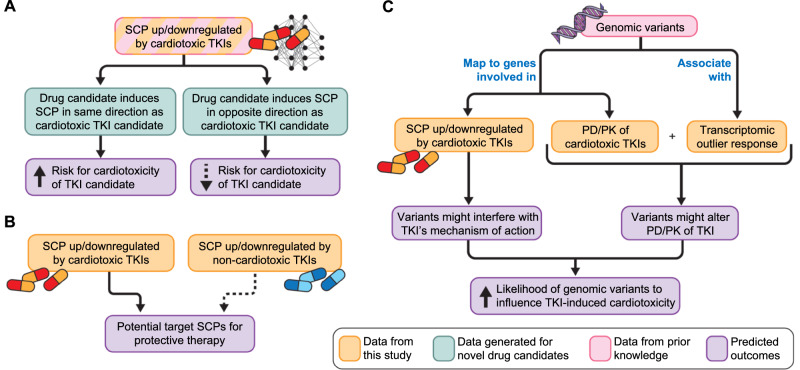
Drug-induced gene expression profiles can identify potential mechanisms of toxicity. We focus on obtaining signatures for cardiotoxicity of FDA-approved tyrosine kinase inhibitors (TKIs) in human induced-pluripotent-stem-cell-derived cardiomyocytes, using bulk transcriptomic profiles. We use singular value decomposition to identify drug-selective patterns across cell lines obtained from multiple healthy human subjects. Cellular pathways affected by cardiotoxic TKIs include energy metabolism, contractile, and extracellular matrix dynamics. Projecting these pathways to published single cell expression profiles indicates that TKI responses can be evoked in both cardiomyocytes and fibroblasts. Integration of transcriptomic outlier analysis with whole genomic sequencing of our six cell lines enables us to correctly reidentify a genomic variant causally linked to anthracycline-induced cardiotoxicity and predict genomic variants potentially associated with TKI-induced cardiotoxicity. We conclude that mRNA expression profiles when integrated with publicly available genomic, pathway, and single cell transcriptomic datasets, provide multiscale signatures for cardiotoxicity that could be used for drug development and patient stratification.


Conflict of interest statement

The authors declare no competing interests.

Figures

Fig. 1
Fig. 1. Singular value decomposition identifies drug-selective gene expression responses.
266 samples, each representing a unique combination of one out of three to six hiPSC-derived cardiomyocyte cell lines treated with one out of 54 drugs, were subjected to bulk RNAseq analysis. 266 lists of differentially expressed genes (DEGs) were calculated using the negative-binomial test implemented in the ‘exactTest’ functionality of the edgeR package. A Our computational pipeline uses singular value decomposition (SVD) to identify drug-selective gene expression responses that are components of the complete responses. Flow chart is used with permission from Mount Sinai Health System, licensed under CC BY. See methods section and Supplementary Fig. 4 for details. B Pairwise correlation analysis followed by hierarchical clustering reveals that most drug responses are dominated by cell-line-selective effects hiding drug-selective effects. Heatmap colors describe drugs used for treatment, as documented in E. See Supplementary Fig. 5A for larger dendrogram. C We used F1 score statistics to document the clustering efficiency, i.e., how close samples treated with the same drug cluster together. Low clustering efficiencies quantitatively describe the finding that only a few complete DEG responses are dominated by drug-selective effects. D Projection of the complete DEG responses into each of the identified 54 drug-selective subspaces greatly increases the clustering efficiencies for all 54 drugs. Numbers of treated cell lines are shown below the bars. Orange: Small molecule kinase inhibitors (KI), red: monoclonal antibodies against KIs, purple: anthracyclines, blue: cardiac-acting drugs, turquoise: non-cardiac-acting drugs. E Pairwise correlation of 266 merged drug-selective responses, followed by hierarchical clustering, documents that SVD allows identification of components induced in all cell lines treated with the same drug. Clusters that contain drugs with similar mechanisms are labeled with gray bars. White insets indicate drugs in those clusters that are not part of the outlined mechanisms. White circles indicate outlier samples that were identified by our pipeline and cluster as outliers in the merged dataset as well. See Supplementary Fig. 13 for a larger dendrogram. #: count of, Ø: without, &: and.
Fig. 2
Fig. 2. Potential subcellular processes indicative of TKI-induced cardiotoxicity.
Up- and downregulated genes among the top 600 drug-selective gene expression profiles were subjected to pathway enrichment analysis using MBCO and Fisher’s Exact test. Significantly up- or downregulated SCPs (nominal p-value ≤ 0.05) were ranked separately by significance for each sample and SCP level. A To screen for SCPs that are selectively induced or repressed by cardiotoxic TKIs, we calculated how many cardiotoxic and non-cardiotoxic TKIs upregulate an SCP of interest in any cell line at any rank cutoff from 1 to 30. Definition of cardiotoxic TKIs as true positives allowed calculation of an F1 score (beta = 0.25) at each analyzed enrichment rank and quantification of the Area under the Curve (AUC). Similarly, we calculated F1 scores and an AUC by analyzing TKIs that downregulate the same SCP. To filter for mixed effects, we subtracted half of the other AUC from each AUC. SCPs were ranked by decreasing AUCs. Flow chart is used with permission from Mount Sinai Health System, licensed under CC BY. B Top up- (red) or downregulated (dark blue) 25 level-3 SCPs predicted for the cardiotoxic TKIs were grouped based on the higher-level functions. White numbers indicate AUC ranks. C The same analysis was applied to level-1, -2 and -3 SCPs, except that we only focused on the AUC obtained for enrichment ranks 1 to 20, due to a smaller number of SCPs within these levels. We also repeated the whole analysis, screening for SCPs selectively induced or repressed by non-cardiotoxic TKIs. Identified SCPs up- and downregulated for cardiotoxic (red and dark blue, respectively) and non-cardiotoxic TKIs (light blue and orange, respectively) for all levels were integrated into the MBCO hierarchy. Selected branches are shown. See Supplementary Fig. 19 for all predictions.
Fig. 3
Fig. 3. SCPs can be mapped to cellular subtypes and known cardiomyopathy disease mechanisms.
A We subjected marker genes for ventricular and atrial cardiomyocytes (VCM, red fields, and ACM, turquoise fields, respectively), cardiac fibroblasts (CFB, brown fields) and smooth muscle cells (SMC, brown fields) obtained from single nucleus RNAseq of the adult human heart to pathway enrichment analysis using MBCO and Fisher’s exact test. Significant SCPs of each cell type (nominal p-value ≤ 0.05) were ranked by significance (numbers in the diagram). Names of SCPs whose higher and lower activities favor a cardiotoxic response are colored red and blue, respectively. B DEGs in heart cells obtained by single cell (SC) or nucleus (SN) RNAseq from patients with DCM or HCM as well as in hiPSC-derived cardiomyocytes obtained from an infant patient with DCM were subjected to pathway enrichment analysis using MBCO and Fisher’s exact test. Significantly up- (red fields) or downregulated (blue fields) SCPs of each cell type (nominal p-value ≤ 0.05) were ranked by significance (numbers in the diagram). Names of SCPs are colored as described in (A).
Fig. 4
Fig. 4. Identification of genomic variants that are potentially associated with a cardiotoxic response.
Whole genome sequencing of our six cell lines was used to identify alleles in our cell lines at known variant positions. A See text and methods for details of our pipeline for identification of potential genomic variants involved in PK/PD or induced SCP activities for a drug of interest. Flow chart is used with permission from Mount Sinai Health System, licensed under CC BY. B Clustering of DEGs within the daunorubicin-selective subspace reveals an outlier response in cell line MSN09 after daunorubicin treatment. C The identified variant rs2229774 in cell line MSN09 maps to the coding region of the transcription factor RARG regulating the expression of TOP2B and ABCB8, both involved in PK/PD of daunorubicin and doxorubicin that induce an outlier response in this cell line. D Enrichment significance ranks for “WNT-Beta-catenin signaling pathway” obtained by analysis of upregulated genes after daunorubicin or doxorubicin treatment of indicated cell lines. The cell line MSN09 (purple) contains the rs2229774 mutation in the RARG gene. Field colors change from bright to dark yellow with increasing ranks. ‘>’ indicates that the SCP was not predicted or predicted with a rank > 99. E In total, we identified 213 and 201 potential variants associated with TIC or AIC by interference with PK/PD mechanisms, respectively. Variants mapping to multiple gene classes are split equally among them to prevent double counting. Drug names are colored according to their class (orange: Small molecule kinase inhibitors (KI), red: monoclonal antibodies against KIs, purple: anthracyclines). F We compared the overlap of identified SCP genes associated with a cardiotoxic or non-cardiotoxic response to genes associated with inherited DCM or HCM, either within the HuGE Phenopedia database or identified in GWAS. TWAS: transcription-wide-association studies. G Variants that meet our population-wide criteria were mapped to up- and downregulated level -2, -3 and -4 SCPs that we predicted as indicative for TIC. Variants that map to identified SCPs of multiple levels are only counted for the lowest level SCPs (higher level numbers) to prevent double counting. Drug names are colored as described in (E). H Up- and downregulated SCPs associated with a cardiotoxic response were mapped back to the cardiotoxic TKIs that induce them. Numbers in brackets show identified variants for each SCP gene. Blue indicates that the SCP is a level-3 SCP.
Fig. 5
Fig. 5. Potential use of cell-based transcriptomic data for drug therapy induced adverse events.
The flowcharts summarize how integration of experimentally gathered transcriptomic data with publicly available pathway and genomic data bases can (A) help predict toxicity of drug candidates, (B) identify potential new drug targets to mitigate cardiotoxicity and (C) enable design of clinical studies to associate genomic variants with cardiotoxicity propensity. All three flow charts are used with permission from Mount Sinai Health System, licensed under CC BY.

References

    1. de Vries, E. N., Ramrattan, M. A., Smorenburg, S. M., Gouma, D. J. & Boermeester, M. A. The incidence and nature of in-hospital adverse events: a systematic review. Qual. Saf. Health Care17, 216–223 (2008). 10.1136/qshc.2007.023622 - DOI - PMC - PubMed
    1. Drozda, K., Pacanowski, M. A., Grimstein, C. & Zineh, I. Pharmacogenetic Labeling of FDA-Approved Drugs: A Regulatory Retrospective. JACC Basic Transl. Sci.3, 545–549 (2018). 10.1016/j.jacbts.2018.06.001 - DOI - PMC - PubMed
    1. Smith, A. F., Klotz, A. & Wormstone, I. M. Improving the drug development process by reducing the impact of adverse events: the case of cataracts considered. Drug Discov. Today21, 510–516 (2016). 10.1016/j.drudis.2016.01.001 - DOI - PubMed
    1. Dorato, M. A. & Buckley, L. A. Toxicology in the drug discovery and development process. Curr. Protoc. Pharmacol.Chapter 10, Unit10 13 10.1002/0471141755.ph1003s32 (2006). - PubMed
    1. Ma’ayan, A., Jenkins, S. L., Goldfarb, J. & Iyengar, R. Network analysis of FDA approved drugs and their targets. Mt Sinai J. Med. 74, 27–32 (2007). 10.1002/msj.20002 - DOI - PMC - PubMed

Publication types

MeSH terms

Substances

Associated data