. 2024 Sep 11;15(1):7966.
doi: 10.1038/s41467-024-52318-1.

Aging is associated with functional and molecular changes in distinct hematopoietic stem cell subsets

Affiliations

Aging is associated with functional and molecular changes in distinct hematopoietic stem cell subsets

Tsu-Yi Su et al. Nat Commun. .

Abstract

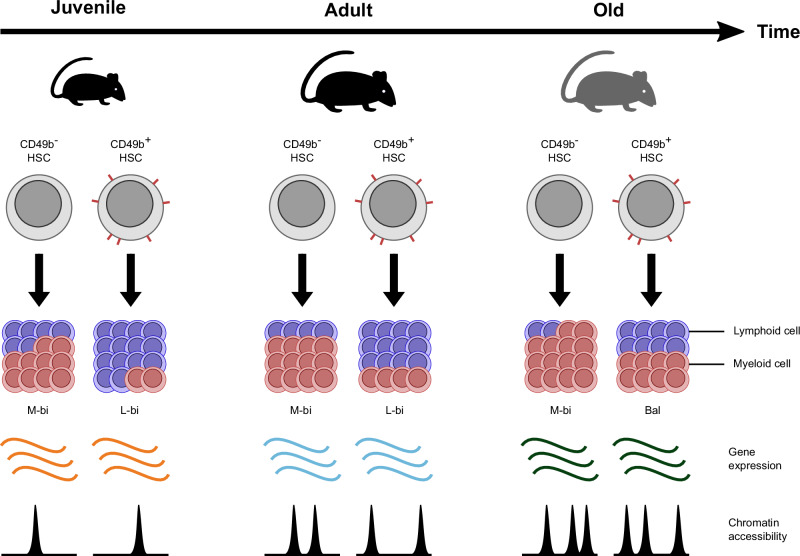
Age is a risk factor for hematologic malignancies. Attributes of the aging hematopoietic system include increased myelopoiesis, impaired adaptive immunity, and a functional decline of the hematopoietic stem cells (HSCs) that maintain hematopoiesis. Changes in the composition of diverse HSC subsets have been suggested to be responsible for age-related alterations, however, the underlying regulatory mechanisms are incompletely understood in the context of HSC heterogeneity. In this study, we investigated how distinct HSC subsets, separated by CD49b, functionally and molecularly change their behavior with age. We demonstrate that the lineage differentiation of both lymphoid-biased and myeloid-biased HSC subsets progressively shifts to a higher myeloid cellular output during aging. In parallel, we show that HSCs selectively undergo age-dependent gene expression and gene regulatory changes in a progressive manner, which is initiated already in the juvenile stage. Overall, our studies suggest that aging intrinsically alters both cellular and molecular properties of HSCs.


Conflict of interest statement

The authors declare no competing interests.

Figures

Fig. 1
Fig. 1. CD49b expression in the HSC compartment is conserved in aging.
a FACS profiles and gating strategy of the phenotypic HSC compartment (LineageSca-1+c-Kit+ (LSK) CD48CD34CD150hi), with further separation using CD49b, in juvenile, adult, and old mice. Frequency of parent gates are shown. See Supplementary Fig. 1a for the full gating strategy. b Total frequency of CD49b and CD49b+ HSC subsets in juvenile (n = 13 mice, 3 experiments), adult (n = 12 mice, 6 experiments), and old (n = 6 mice, 6 experiments) mice. c Total numbers of CD49b and CD49b+ HSC subsets in juvenile (n = 13 mice, 3 experiments), adult (n = 12 mice, 6 experiments), and old (n = 6 mice, 6 experiments) mice. d Frequency of CD49b and CD49b+ HSCs in G0 (left) and G1 (right) of juvenile (n = 9 mice, 3 experiments), adult (n = 15 mice, 6 experiments), and old (n = 8 mice, 5 experiments) mice. e Frequency of cell divisions from cultured single cells of CD49b (left) and CD49b+ (right) HSCs at days 1–3 from juvenile (n = 7 mice, 3 experiments, nCD49b = 351 cells, nCD49b+ = 258 cells), adult (n = 4 mice, 3 experiments, nCD49b = 149 cells, nCD49b+ = 146 cells), and old (n = 6 mice, 4 experiments, nCD49b = 599 cells, nCD49b+ = 539 cells) mice. f Frequency of BrdU+ CD49b and CD49b+ HSCs from juvenile (n = 11 mice, 3 experiments), adult (n = 10 mice, 3 experiments), and old (n = 8 mice, 3 experiments) mice. Mean ± s.d. is shown. The statistical analyses were performed two-sided with one-way ANOVA with Tukey’s multiple comparison test in the CD49b subset in bd and CD49b+ G0 in d, two-way repeated measures ANOVA with Tukey’s multiple comparison test in e, Kruskal–Wallis with Dunn’s multiple comparison test in the CD49b+ subset in b and c, CD49b+ G1 in d, and in f. J juvenile, A adult, O old. See also Supplementary Fig. 1. Source data are provided as a Source Data file.
Fig. 2
Fig. 2. The lineage repopulation patterns of multipotent CD49b subsets change with age.
a Total frequency of clones containing B cells (left), or only myeloid cells (right) from CD49b subsets in juvenile (nCD49b = 6 mice, nCD49b+ = 7 mice, 3 experiments), adult (nCD49b = 5 mice, nCD49b+ = 6 mice, 3 experiments), and old (nCD49b = 7 mice, nCD49b+ = 7 mice, 4 experiments) mice. b Megakaryocyte potential of CD49b subsets from juvenile (nCD49b = 5 mice, nCD49b+ = 5 mice, 3 experiments), adult (nCD49b = 7 mice, nCD49b+ = 7 mice, 6 experiments), and old (nCD49b = 4 mice, nCD49b+ = 4 mice, 4 experiments) mice. c Donor leukocyte contribution in the PB of transplanted mice (nJCD49b = 14 mice, nJCD49b+ = 24 mice, nACD49b = 5 mice, nACD49b+ = 10 mice, nOCD49b = 20 mice, nOCD49b+ = 18 mice). d Donor-derived lineage contribution in the PB of transplanted mice (nJCD49b = 14 mice, nJCD49b+ = 24 mice, nACD49b = 5 mice, nACD49b+ = 10 mice, nOCD49b = 20 mice (11 for P-E), and nOCD49b+ = 18 mice (15 for P-E)). e Relative lineage contribution within donor leukocytes and donor chimerism (CD45.2) in the PB 5–6 months post-transplantation from d. f Proportion of lineage distribution patterns from e, using adult L/M ratio (nJCD49b = 12 mice, nJCD49b+ = 20 mice, nACD49b = 5 mice, nACD49b+ = 10 mice, nOCD49b = 20 mice, nOCD49b+ = 18 mice). g L/M ratio in PB of mice transplanted with old CD49b subsets (nCD49b = 20 mice, nCD49b+ = 18 mice) 5–6 months post-transplantation. The ranges for L-bi, Bal, and M-bi based on old L/M ratio are indicated. h Relative lineage contribution to myeloid (M) and lymphoid cells (L: B, T, and NK cells) in the BM of transplanted mice (nJCD49b = 13 mice, nJCD49b+ = 19 mice, nOCD49b = 20 mice, nOCD49b+ = 18 mice). Mean ± s.d. is shown. Statistical analyses were performed two-sided, with Kruskal–Wallis with Dunn’s multiple comparison test in a and CD49b in b, one-way ANOVA with Tukey’s multiple comparison test in CD49b+ in b, Mann–Whitney test in c, and Wilcoxon signed-rank test in h, except in JCD49b, where paired t-test was done. J juvenile, A adult, O old, PB peripheral blood, BM bone marrow, L-bi lymphoid-biased, Bal balanced, M-bi myeloid-biased, L/M lymphoid to myeloid. See also Supplementary Figs. 2–4. Source data are provided as a Source Data file.
Fig. 3
Fig. 3. The CD49b HSC subset is the most durable subset regardless of age.
a Proportion of mice exhibiting myeloid repopulation in the peripheral blood and HSC (LSK CD48Flt-3CD150+) repopulation in the bone marrow (BM), 5–6 months after primary or secondary transplantation of juvenile CD49b and CD49b+ HSCs (nCD49b–Primary = 15 mice, nCD49b+Primary = 23 mice, nCD49b–Secondary = 12 mice, nCD49b+Secondary = 8 mice). b Frequency of HSC repopulation in reconstituted mice after primary transplantation (nJCD49b = 12 mice, nJCD49b+ = 7 mice, nOCD49b = 20 mice, nOCD49b+ = 17 mice). c Proportion of mice exhibiting myeloid repopulation in the peripheral blood and HSC (LSK CD48Flt-3CD150+) repopulation in the BM, 5–6 months after primary or secondary transplantation of old CD49b and CD49b+ HSCs (nCD49b–Primary = 20 mice, nCD49b+Primary = 18 mice, nCD49b–Secondary = 17 mice, nCD49b+Secondary = 10 mice). d Total donor leukocyte contribution in the PB of mice secondary transplanted with CD49b and CD49b+ HSC subsets from juvenile, adult, and old mice (nJCD49b = 12 mice, nJCD49b+ = 8 mice, nOCD49b = 17 mice, nOCD49b+ = 10 mice). Mean ± s.d. is shown. The statistical analyses were performed two-sided, with Fisher´s exact test in a and c, Mann–Whitney test in b, and Šídák’s multiple comparisons test after adjusting for repeated measures in d. J juvenile, O old, PB peripheral blood. See also Supplementary Fig. 4. Source data are provided as a Source Data file.
Fig. 4
Fig. 4. HSCs undergo considerable gene expression changes during aging.
a UMAP visualization of single-cell RNA-seq data from stem- and progenitor cells, from juvenile, adult, and old mice (nJCD49b = 115 cells, nJCD49b+ = 118 cells, nJLMPP = 34 cells, nJGMP = 11 cells, nACD49b = 133 cells, nACD49b+ = 144 cells, nALMPP = 55 cells, nAGMP = 73 cells, nOCD49b = 145 cells, nOCD49b+ = 135 cells, nOLMPP = 32 cells, nOGMP = 26 cells). Cells are colored by population (top) or age (bottom). b Heatmap of normalized expression for differentially expressed genes between juvenile and old HSCs. The top 50 differentially expressed genes up in juvenile and old, with padj < 0.01 and log2FC > 1 (LR test), are shown. c Gene set enrichment analysis for old compared to juvenile HSCs and the indicated custom gene sets from Svendsen et al. and Mann et al.. d Proliferation and quiescence scores for all analyzed stem- and progenitor cells, regardless of age. e Proliferation and quiescence scores for juvenile, adult, and old HSC subsets. f Calculated HSC-score for stem- and progenitor cells from juvenile, adult, and old mice. All statistical analyses were performed two-sided, with Kruskal–Wallis with Dunn’s multiple comparison test in d and e and Mann–Whitney test in f. Only the HSC subsets were included in the statistical analysis in f. NES normalized enrichment score, J juvenile, A adult, O old. See also Supplementary Fig. 6. Source data are provided as a Source Data file.
Fig. 5
Fig. 5. Aging is associated with a progressive increase of chromatin accessibility in HSCs.
a Principal component analysis of ATAC-seq data from stem- and progenitor cells, from juvenile, adult, and old mice (nJCD49b = 5 samples, nJCD49b+ = 5 samples, nJLMPP = 6 samples, nJGMP = 4 samples, nACD49b = 5 samples, nACD49b+ = 5 samples, nALMPP = 5 samples, nAGMP = 5 samples, nOCD49b = 5 samples, nOCD49b+ = 5 samples, nOLMPP = 3 samples, nOGMP = 4 samples). b Principal component analysis of ATAC-seq data from CD49b and CD49b+ HSC subsets, from juvenile, adult, and old mice. (nJCD49b = 5 samples, nJCD49b+ = 5 samples, nACD49b = 5 samples, nACD49b+ = 5 samples, nOCD49b = 5 samples, nOCD49b+ = 5 samples). c Heatmap (left) of row normalized chromatin accessibility for regions with differential accessibility (padj <0.0001, Wald test) between juvenile and old CD49b and/or between juvenile and old CD49b+ cells. Regions are divided into three clusters based on hierarchical clustering. Median normalized chromatin accessibility of clusters 1–3 is shown (right). d Percentage of regions constituting open chromatin in clusters 1–3. e Top 5 GO biological processes significantly enriched in clusters 1–3. f Transcription factors with enriched binding motifs (-ln(p-value)>50) in clusters 1–3. g Venn diagram of regions with differential accessibility (padj <0.0001, Wald test) in old compared to juvenile HSCs (Old vs. Juvenile) or in adult compared to juvenile HSCs (Adult vs. Juvenile). h Transcription factors with enriched binding motifs (-ln(p-value)>10) in regions with increased or decreased accessibility in both adult and old compared to juvenile HSCs. A one-sided binomial test was used to determine significance in e, f, and h. p-values in c and e were adjusted using the Benjamini–Hochberg method. Boxplots show the distribution in each population (center line, median; box limits, interquartile range; whiskers, furthest data point within 1.5x of the interquartile range). J juvenile, A adult, O old. See also Supplementary Figs. 7–9. Source data are provided as a Source Data file.
Fig. 6
Fig. 6. Aging and lineage bias are regulated by the same transcription factor families.
a Heatmap of row normalized chromatin accessibility for regions with differential accessibility (padj < 0.05, Wald test) between juvenile CD49b and CD49b+ HSCs (top), or between old CD49b and CD49b+ HSCs (bottom). b Top 10 GO biological processes significantly enriched in regions with differential accessibility between CD49b subpopulations in juvenile or old mice. c Schematic illustration of the analysis strategy to identify chromatin accessibility changes associated with lineage bias differences (Lin DARs). d Heatmap (left) of row normalized chromatin accessibility for Lin DARs. Regions are divided into two clusters based on hierarchical clustering. Boxplots (right) show the median normalized chromatin accessibility in clusters 1 and 2. e Top 5 GO biological processes significantly enriched in clusters 1 and 2. f UCSC browser tracks of median ATAC-seq signal for selected Lin DARs. Gene names above the tracks indicate the closest gene to the displayed region. g Transcription factors with enriched binding motifs (-ln(p-value)>50) in clusters 1 and 2. A one-sided binomial test was used to determine significance in b, e, and g. p-values in a, b, d, and e were adjusted using the Benjamini–Hochberg method. Boxplots show the distribution in each population (center line, median; box limits, interquartile range; whiskers, furthest data point within 1.5× of the interquartile range). Lin DARs, lineage bias associated differentially accessible regions. See also Supplementary Fig. 9. Source data are provided as a Source Data file.
Fig. 7
Fig. 7. Aging is associated with functional and molecular changes in distinct hematopoietic stem cell subsets.
Schematic overview of the age-related functional and molecular changes in CD49b and CD49b+ HSCs in juvenile, adult, and old mice. Aging is associated with gradually increasing myeloid cellular output in both CD49b and CD49b+ HSCs. Gene expression profiling detects age-related molecular changes in total HSCs. Chromatin accessibility analysis reveals age-dependent and CD49b subset-specific differences. M-bi myeloid-biased, L-bi lymphoid-biased, Bal balanced.

References

    1. Geiger, H., de Haan, G. & Florian, M. C. The ageing haematopoietic stem cell compartment. Nat. Rev. Immunol.13, 376–389 (2013). 10.1038/nri3433 - DOI - PubMed
    1. Rossi, D. J., Jamieson, C. H. M. & Weissman, I. L. Stems Cells and the Pathways to Aging and Cancer. Cell132, 681–696 (2008). 10.1016/j.cell.2008.01.036 - DOI - PubMed
    1. de Haan, G. & Lazare, S. S. Aging of hematopoietic stem cells. Blood131, 479–487 (2018). 10.1182/blood-2017-06-746412 - DOI - PubMed
    1. Partridge, L., Deelen, J. & Slagboom, P. E. Facing up to the global challenges of ageing. Nature561, 45–56 (2018). 10.1038/s41586-018-0457-8 - DOI - PubMed
    1. Watt, S. M., Hua, P. & Roberts, I. Increasing Complexity of Molecular Landscapes in Human Hematopoietic Stem and Progenitor Cells during Development and Aging. Int. J. Mol. Sci.23, 3675 (2022). 10.3390/ijms23073675 - DOI - PMC - PubMed

Publication types

LinkOut - more resources