. 2024 Sep;633(8029):389-397.
doi: 10.1038/s41586-024-07881-4. Epub 2024 Sep 11.

Ancient Rapanui genomes reveal resilience and pre-European contact with the Americas

Affiliations

Ancient Rapanui genomes reveal resilience and pre-European contact with the Americas

J Víctor Moreno-Mayar et al. Nature. 2024 Sep.

Abstract

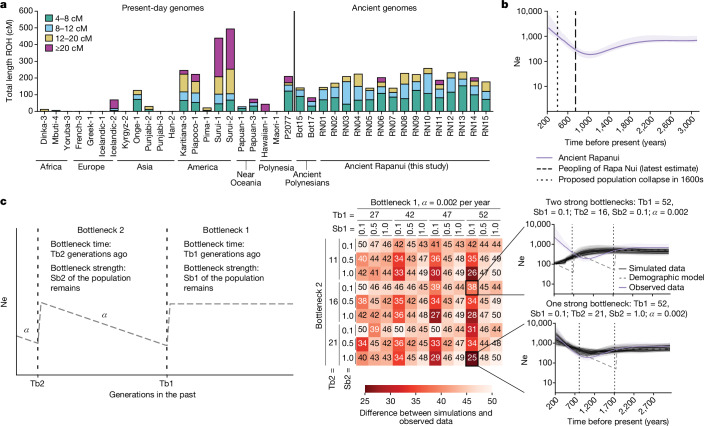
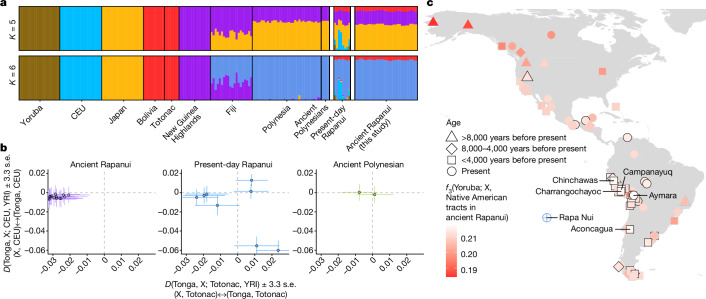
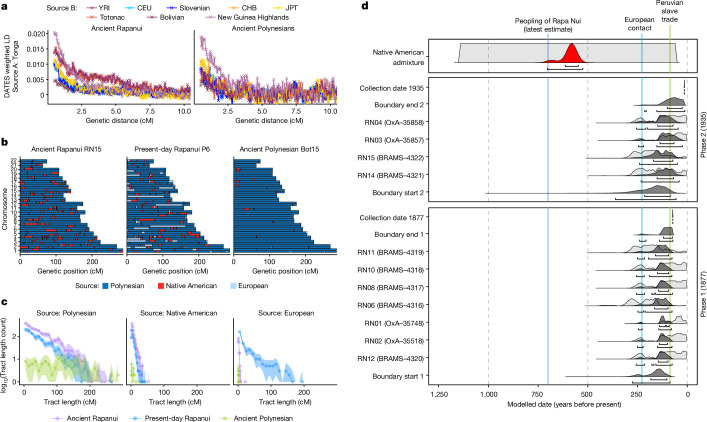
Rapa Nui (also known as Easter Island) is one of the most isolated inhabited places in the world. It has captured the imagination of many owing to its archaeological record, which includes iconic megalithic statues called moai1. Two prominent contentions have arisen from the extensive study of Rapa Nui. First, the history of the Rapanui has been presented as a warning tale of resource overexploitation that would have culminated in a major population collapse-the 'ecocide' theory2-4. Second, the possibility of trans-Pacific voyages to the Americas pre-dating European contact is still debated5-7. Here, to address these questions, we reconstructed the genomic history of the Rapanui on the basis of 15 ancient Rapanui individuals that we radiocarbon dated (1670-1950 CE) and whole-genome sequenced (0.4-25.6×). We find that these individuals are Polynesian in origin and most closely related to present-day Rapanui, a finding that will contribute to repatriation efforts. Through effective population size reconstructions and extensive population genetics simulations, we reject a scenario involving a severe population bottleneck during the 1600s, as proposed by the ecocide theory. Furthermore, the ancient and present-day Rapanui carry similar proportions of Native American admixture (about 10%). Using a Bayesian approach integrating genetic and radiocarbon dates, we estimate that this admixture event occurred about 1250-1430 CE.


Conflict of interest statement

O.D. is a current employee of the Regeneron Genetics Center, which is a subsidiary of Regeneron Pharmaceuticals. The remaining authors declare no competing interests.

Figures

Fig. 1
Fig. 1. Shared drift and identity by descent between Ancient Rapanui and present-day populations.
a, f3-statistics of the form f3(Yoruba; X, Ancient Rapanui), for each population X in a worldwide genotype panel including 755,094 SNP sites. For each ancient individual, we sampled one random allele at each site and pooled these ‘pseudohaploid calls’ to estimate allele frequencies. In addition, we include data from two previously published Polynesian individuals originally from an unknown island. The lighter a point is, the greater shared drift between a population (X) and the ancient individuals sequenced in this study. Raw results are presented in Extended Data Fig. 1 and Supplementary Table 4. Confirmatory f3-statistics for a broader set of Oceanian individuals, are presented in Supplementary Fig. 12 and Supplementary Table 5. b, Average IBD sharing between pairs of individuals from different Polynesian groups as estimated using IBDseq. For all possible pairs of individuals between two groups (for example, the 45 possible pairs between the 15 Ancient Rapanui and the 3 present-day Rapanui) we show the average cumulative length of segments shared IBD, stratified by segment length (colour scheme). We show results for the 15 Ancient Rapanui (left), three representative present-day Rapanui with low European admixture (middle) and two Ancient Polynesians (right) with unknown sampling location. For this analysis, we imputed the ancient individual sequence data to obtain diploid genotypes. Results for each individual (not pooled means) are presented in Supplementary Fig. 20 (including called IBD segments <15 cM). IBDseq estimates stratified by length are presented in Supplementary Table 15.
Fig. 2
Fig. 2. ROH and Rapanui population size estimates through time.
a, Total ROH stratified by length in worldwide present-day and ancient Polynesian genomes as inferred using hapROH (Supplementary Information section 10). b, HapNe-LD effective population size estimates for 15 imputed Ancient Rapanui genomes. Assuming the ancient individuals were born in about 1800 ce (Fig. 4) and 29 years per generation, we indicate the latest estimate for the peopling of Rapa Nui (1250 ce), and the 1600s collapse proposed by the ecocide theory. c, msprime coalescent-based simulations and HapNe-LD effective population size inference for 15 ancient genomes under a model with two bottlenecks followed by growth. The oldest bottleneck (bottleneck 1) represents the peopling of Rapa Nui. The more recent bottleneck (bottleneck 2) represents the ecocide theory collapse. Bottlenecks are defined by a time (Tb1, Tb2) and a strength (Sb1, Sb2) parameter. Strengths indicate the proportion of the population left after each bottleneck (for example, a bottleneck with strength 0.1 is very strong (10% of the population is left)). We assume the population grows exponentially with rate α after each bottleneck. We compared estimates for the observed and simulated data across a grid of bottleneck and growth parameters (Tb1, Sb1, Tb2, Sb2 and α). The heat map (middle) shows a measure of the difference between the effective population size estimates for observed (b) and simulated data for a set of representative simulation parameters, across 10 replicates (full range; Supplementary Information section 11). We consider different times for each bottleneck (Tb1, Tb2) and three strengths: 0.1 (strong), 0.5 (intermediate) and 1.0 (non-existent). α = 0.002 is the growth rate that minimized the difference between the inferences for observed and simulated data. For reference, we plot the estimates for two simulations (one strong bottleneck and two strong bottlenecks) (right). Black lines correspond to ten independent simulation replicates for each parameter set. Shaded areas show 95% bootstrap confidence intervals.
Fig. 3
Fig. 3. aProportion and source of Native American admixture in Rapanui.
a, ADMIXTURE-estimated proportions assuming K = 5 and K = 6 ancestry components. For K = 5, we considered five reference populations (African (Yoruba), European (CEU), Asian (Japan), Native American (Bolivia and Totonac) and Near Oceanian (New Guinea Highlands)). To minimize the effect of strong drift in Remote Oceanians (Fijians and Polynesians), we ran ADMIXTURE separately for each Remote Oceanian (n = 78), including the Ancient Rapanui (n = 15), present-day Rapanui (n = 8) and the Ancient Polynesians from an unknown island (n = 2). For K = 6, we included all Fijians and present-day Polynesians (excluding present-day Rapanui) in all runs. Wider bars represent ancient individuals (pseudohaploid calls). b, D-statistics testing for Native American and European admixture in ancient and present-day Rapanui and the two Ancient Polynesians from an unknown island. Totonac represent Native American ancestry and Utah residents (CEU) represent European ancestry. Points represent D-statistics. Error bars represent about 3.3 standard errors (P ≈ 0.001 in a Z test; 755,094 SNPs in 5-Mb blocks). Under each axis, we indicate the pair of populations with excess allele sharing, depending on the sign of D. To maximize the test sensitivity, we considered imputed diploid genotypes for the ancient individuals (Supplementary Information section 5). c, f3-statistics showing the genetic affinities between the Native American tracts in Ancient Rapanui and ancient and present-day Native American populations. For each Ancient Rapanui, we masked Polynesian ancestry tracts and pooled Native American ancestry tracts to estimate f3-statistics. Lighter colours represent greater shared drift between a Native American population (X) and the Ancient Rapanui. We label the five Native American populations that lead to the largest f3-statistics. Point shapes represent the age of Native American populations in years before present. Points with a darker outline correspond to point estimates overlapping with the 95% confidence interval of the highest f3-statistic (illustrated in Extended Data Fig. 2).
Fig. 4
Fig. 4. Dating the admixture between the Polynesian ancestors of Rapanui and Native Americans using genetic and radiometric data jointly.
a, We used DATES to estimate admixture linkage disequilibrium (LD) curves for Ancient Rapanui and the Ancient Polynesians from an unknown island. We considered pseudohaploid calls for ancient individuals and eight two-source combinations to model their ancestry. All combinations include individuals from Tonga representing Polynesian ancestry and a representative from Africa (Yoruba (YRI)), Europe (Utah residents (CEU) and Slovenians), East Asia (Han Chinese from Beijing (CHB) and Japanese from Tokyo (JPT)), the Americas (Totonac and Bolivians) or Near Oceania (New Guinea Highlanders). Both test populations show similar qualitative patterns across sources, except for Native Americans, which yield increased admixture linkage disequilibrium in Ancient Rapanui. b, Spatial distribution of Polynesian, Native American and European ancestry tracts in representative ancient and present-day individuals. We used RFmix to infer local ancestry tracts in ancient and present-day Rapanui and the Ancient Polynesians from an unknown island. For each representative individual, we show 22 autosome pairs and paint the inferred ancestry tracts depending on the source. c, Ancestry tract length distributions for ancient and present-day Rapanui and the Ancient Polynesians from an unknown island. Colours correspond to the source populations from RFmix (Polynesian, Native American and European). Points and lines correspond to the observed data and the shaded regions correspond to 95% confidence intervals based on 500 non-parametric bootstrap replicates. We use the inferred tract length distributions to estimate the genetic admixture date between Rapanui and Native Americans using tracts. d, We used Bayesian modelling to group two phases of reservoir-corrected radiocarbon-dated human remains of known collection dates and used the number of generations since Native American admixture (tracts estimates for each individual (Supplementary Information section 14)) to calculate an overall Native American admixture date for the Ancient Rapanui (red distribution at the top). BRAMS, Bristol Radiocarbon Accelerator Mass Spectrometer.
Extended Data Fig. 1
Extended Data Fig. 1. f3-statistics measuring shared drift between ‘Ancient Rapanui’ individuals and other present-day and ancient populations.
We estimated the ‘Ancient Rapanui’ allele frequencies for the sites included in the SNP array dataset (Supplementary Information section 4) and computed f3-statistics of the form f3(Yoruba; X, Ancient Rapanui). For each population X, the point represents the point estimate for f3, and error bars correspond to the 95% confidence intervals. Non-Polynesian populations are coloured according to their broad continental ancestry and Polynesian populations are coloured according to their island of origin. a. f3-statistics results for pseudo-haploid calls. b. f3-statistics results for imputed diploid genotypes. Panel a. corresponds to the results shown in Fig. 1a. Raw results for these f3-statistics are presented in Supplementary Table 4.
Extended Data Fig. 2
Extended Data Fig. 2. f3-statistics showing the genetic affinities between the Native American tracts in ‘Ancient Rapanui’ and ancient and present-day Native American populations.
This figure shows 95% confidence intervals (727,455 SNPs in 5 Mb blocks) for the f3-statistics reported in Fig. 3c. The horizontal line indicates point estimates overlapping with the 95% confidence interval of the highest f3-statistic. The top 12 f3 values correspond to ancient and present-day Andean populations (Andes8-4k, Andes<4k, present-day Andean and Aconcagua). For present-day Native American populations (those that do not include an age range) symbols and colours correspond to their language family following, e.g., NaDene, and for ancient Native American populations, they correspond to their sampling location and age. Abbreviations for ancient populations: ‘NAme’: North America, ‘EoAndes’: East of Andes, ‘SCone’: Southern Cone, >8k: ancient data pre-dating 8,000 years ago, 8–4k: ancient data ranging between 8,000 and 4,000 years ago, <4k: ancient data post-dating 4,000 years ago. Raw results are reported in Supplementary Table 10.

References

    1. Hunt, T. L. & Lipo, C. P. The Statues That Walked: Unraveling the Mystery of Easter Island (Free Press, 2011).
    1. Diamond, J. M. Collapse: How Societies Choose to Fail or Succeed (Penguin, 2006).
    1. Bahn, P. G. & Flenley, J. Easter Island, Earth Island (Thames and Hudson, 1992).
    1. DiNapoli, R. J., Lipo, C. P. & Hunt, T. L. Revisiting warfare, monument destruction, and the ‘Huri Moai’ phase in Rapa Nui (Easter Island) culture history. J. Pac. Archaeol.12, 1–24 (2020).
    1. Moreno-Mayar, J. V. et al. Genome-wide ancestry patterns in Rapanui suggest pre-European admixture with native Americans. Curr. Biol.24, 2518–2525 (2014). - PubMed

Publication types

MeSH terms

Supplementary concepts

LinkOut - more resources