. 2024 Sep 11;7(1):1121.
doi: 10.1038/s42003-024-06846-7.

Atoh1 mediated disturbance of neuronal maturation by perinatal hypoxia induces cognitive deficits

Affiliations

Atoh1 mediated disturbance of neuronal maturation by perinatal hypoxia induces cognitive deficits

Xin-Yu Cai et al. Commun Biol. .

Abstract

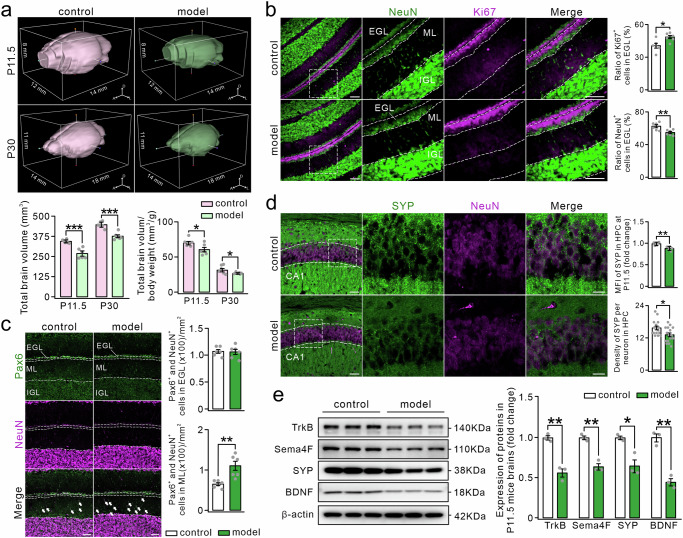
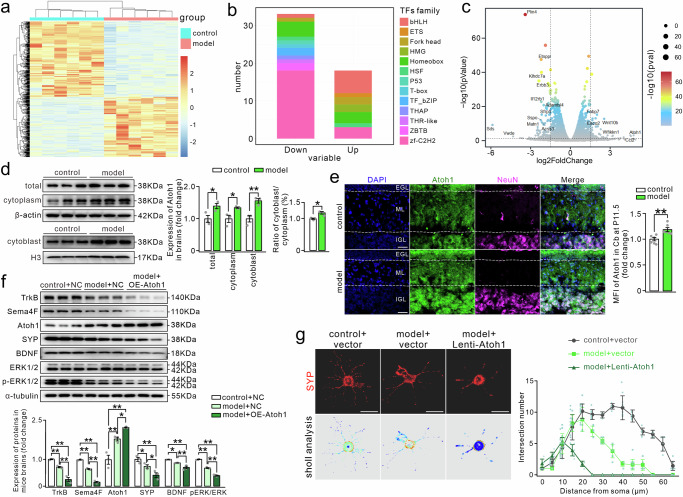
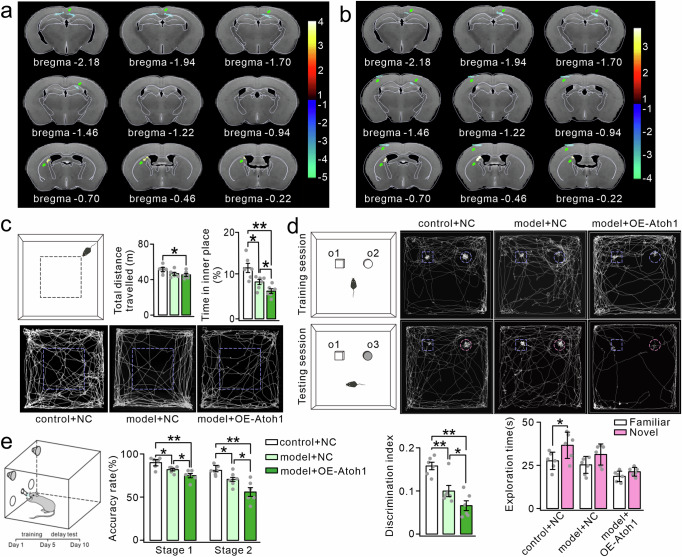
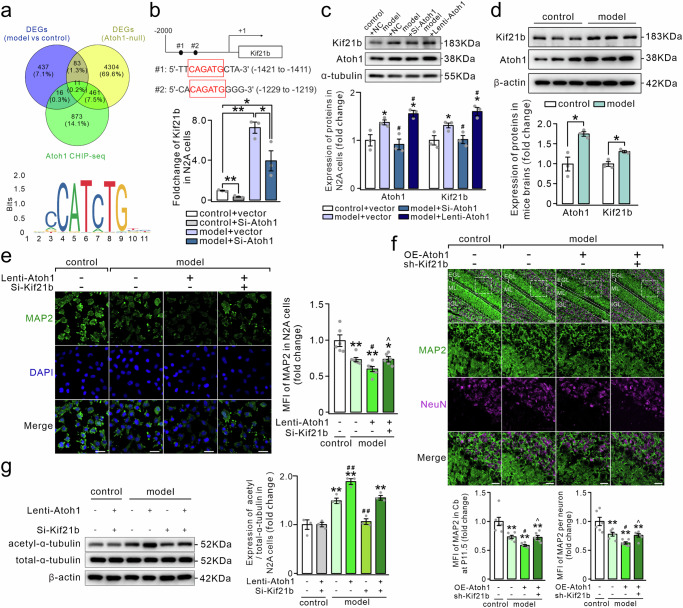
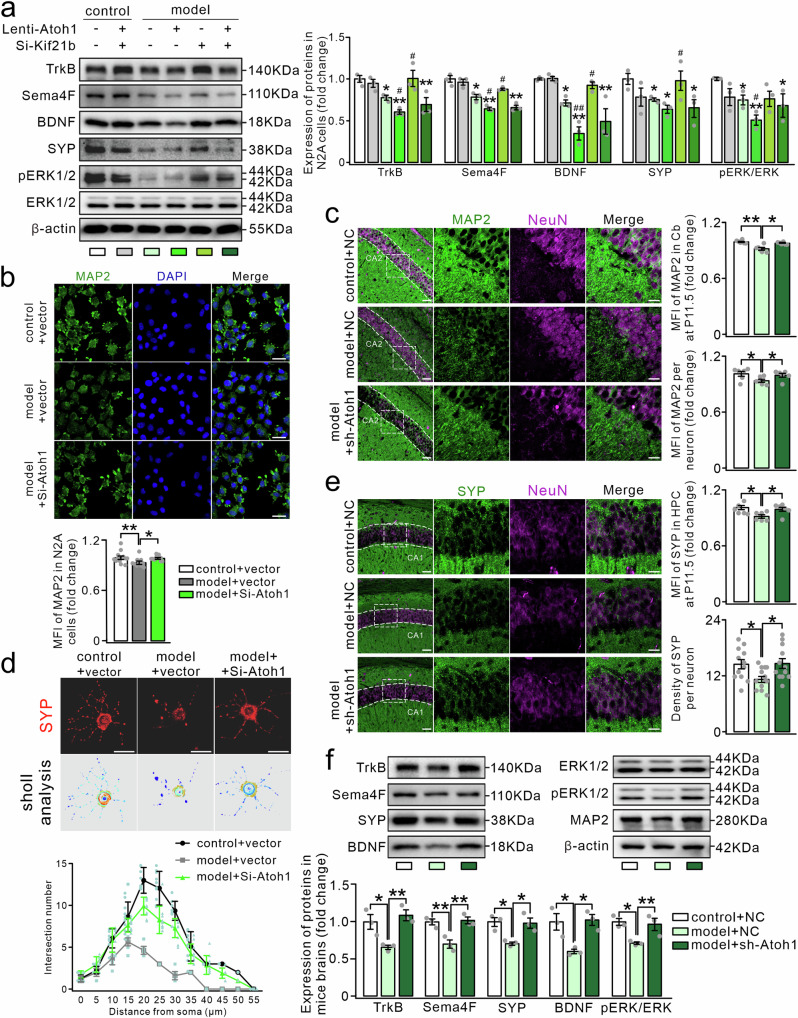
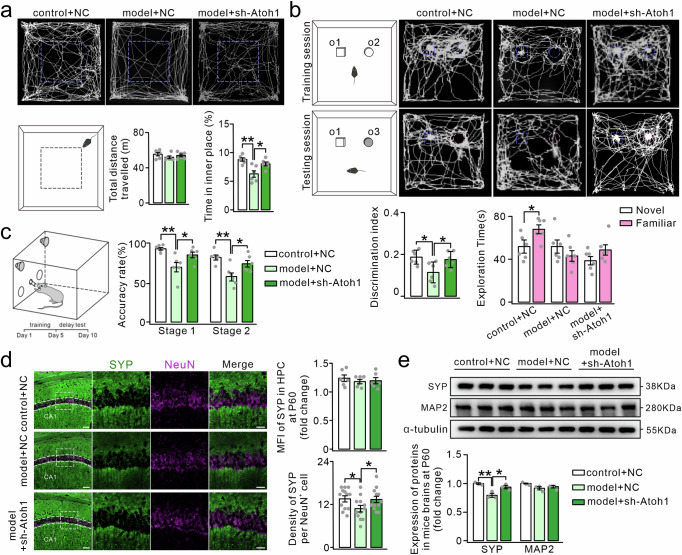
Neurodevelopmental disorders are currently one of the major complications faced by patients with congenital heart disease (CHD). Chronic hypoxia in the prenatal and postnatal preoperative brain may be associated with neurological damage and impaired long-term cognitive function, but the exact mechanisms are unknown. In this study, we find that delayed neuronal migration and impaired synaptic development are attributed to altered Atoh1 under chronic hypoxia. This is due to the fact that excessive Atoh1 facilitates expression of Kif21b, which causes excess in free-state α-tubulin, leading to disrupted microtubule dynamic stability. Furthermore, the delay in neonatal brain maturation induces cognitive disabilities in adult mice. Then, by down-regulating Atoh1 we alleviate the impairment of cell migration and synaptic development, improving the cognitive behavior of mice to some extent. Taken together, our work unveil that Atoh1 may be one of the targets to ameliorate hypoxia-induced neurodevelopmental disabilities and cognitive impairment in CHD.


Conflict of interest statement

The authors declare no competing interests.

Figures

Fig. 1
Fig. 1. Structural aberration of brain after chronic hypoxia.
a 3D graphs of control and model mice in P11.5 brain by T2 scanning (A, anterior; L, left; D, dorsal). Bar graphs on the left show the total brain volume of control and model mice at P11.5 and P30 (control, n = 6; model, n = 6) (For statistics, see Table S3). Bar graphs on the right show the normalized total brain volume of control and model mice at P11.5 and P30 (control, n = 6; model, n = 6) (For statistics, see Table S4). b Staining of cerebellar lobule IV-V by antibodies against Ki67 and NeuN in mice at P11.5. The three right panels show a magnified view of dashed squares on the left. (EGL, external granular layer; ML, molecular layer; IGL, internal granular layer) Scale bars: 50 μm. (column on the left, objective 20x; three right columns, objective 40x). Bar graph above shows the ratio of Ki67 positive cells in EGL. Bar graph below shows the ratio of NeuN positive cells in EGL (control, n = 6; model, n = 6) (For statistics, see Table S5). c Staining of cerebellar lobule III by antibodies against Pax6 and NeuN in mice at P11.5. Scale bars: 50 μm. Objective 20x. White arrows indicate double positive cells. Bar graph above shows the number of Pax6 and NeuN positive cells in EGL (control, n = 6; model, n = 6). Bar graph below shows the number of Pax6 and NeuN positive cells in ML (control, n = 6; model, n = 6) (For statistics, see Table S6). d Staining of hippocampal CA1 by antibodies against SYP and NeuN in mice at P11.5. The three right panel shows a magnified view of dashed squares on the left. HPC, hippocampus. Scale bars: 50 μm (columns on the left, objective 20x); 20 μm (three right columns, objective 63x). Bar graph above shows mean fluorescence intensity (MFI) of SYP staining, data were presented as relative to control (control, n = 6; model, n = 6). Bar graph below shows density of SYP+ points on per neuron (control, n = 16; model, n = 16) (For statistics, see Table S7). e Protein fractions from brains of P11.5 mice were tested with TrkB, BDNF, SYP, and Sema4F. Left panels show representative bands of proteins mentioned above. β-actin was used as an internal control. Bar graphs on the right show percentage changes of proteins in model mice relative to control (control, n = 3; model, n = 3) (For statistics, see Table S8). All data were shown as mean ± SEM. *p < 0.05, **p < 0.01, ***p < 0.001.
Fig. 2
Fig. 2. Altered Atoh1 levels in the hypoxic neonatal brain affected neuronal development.
a Heat map shows DEGs of the whole brain from P11.5 mice (control, n = 6; model, n = 6) (p < 0.05, Log2FC > 1). b Bar graph shows TFs families in DEGs (control, n = 6; model, n = 6) (p < 0.05, Log2FC > 1). c Volcano plot shows genes in the leading positions of DEGs (control, n = 6; model, n = 6) (p < 0.05, Log2FC > 1.5). d Protein fractions in cytoplasm and cytoblast extracted from P11.5 mice brains were tested with Atoh1. Left panels show representative bands of Atoh1. β-actin and H3 were used as internal controls of cytoplasm and cytoblast, respectively. Bar graphs on the left show percentage changes of proteins in model mice relative to control. Bar graph on the right shows ratio of Atoh1 level in cytoblast relative to cytoplasm. (control, n = 3; model, n = 3) (For statistics, see Table S9). e Staining of cerebellar lobule III by antibodies against Atoh1 and NeuN in P11.5 mice. Cb, cerebellum. Scale bars: 20 μm. Objective 40x. Bar graph shows MFI of Atoh1 staining (control, n = 6; model, n = 6) (t = −3.89, **p = 0.0030, df = 10) (1.00 ± 0.033 vs 1.20 ± 0.040). f Protein fractions from P11.5 mice brains of control and model mice were tested with TrkB, BDNF, SYP, Sema4F, Atoh1, pErk1/2, and Erk1/2. Left panels show representative bands of proteins mentioned above. α-tubulin was used as an internal control. (NC, negative control; OE, over expression). Bar graphs show percentage changes of proteins (control + NC, n = 3; model + NC, n = 3; model + OE-Atoh1, n = 3) (For statistics, see Table S10). g Sholl analysis of cultured primary neurons stained of SYP. Left panels show representative staining of SYP and intersection of dendrites with concentric circles. Line chart shows the intersection numbers of dendrites and concentric circles. Scale bars: 20 μm. Objective 63x. (All groups, n = 6 batches for each group, n = 2 cells for each batch) (For statistics, see Table S11). All data were shown as mean ± SEM. *p < 0.05, **p < 0.01.
Fig. 3
Fig. 3. The results of resting-state BOLD and cognition-related behavior tests of model mice.
a ReHo analysis of control and model mice at P60 (p < 0.05) (control, n = 6; model, n = 6). b ALFF analysis of control and model mice at P60 (p < 0.05) (control, n = 6; model, n = 6). The bregma for each layer of the brain map is shown below the image in the (a, b). The green arrows indicate changes of brain regions. c Top left: schematic of the OF tests. Top right: bar graphs show the total distance traveled in OF and time in inner space (control + NC, n = 6; model + NC, n = 6; model + OE-Atoh1, n = 6) (For statistics, see Table S12). Bottom: Sample tracing of mice in OF. d The most left panels: schematic of the NOR tests. The right three panels: Sample tracing of mice in training and testing sessions. Bar graph in bottom left panel shows the discrimination index. Bar graphs in bottom right panel show the exploration time of the familiar and novel object (control + NC, n = 6; model + NC, n = 6; model + OE-Atoh1, n = 6) (discrimination index, F = 17.49, df = (15, 2) control + NC vs model + NC, **p = 0.0020; control + NC vs model + OE-Atoh1, **p = 0.0010; model + NC vs model + OE-Atoh1, *p = 0.049 (0.16 ± 0.0087 vs 0.10 ± 0.013 vs 0.068 ± 0.011); exploration time, for statistics, see Table S13. e The left panel: schematic of the Skinner’s box tests. The right panel: Bar graphs show accuracy of mice in probing the correct hole to achieve reward in the first stage and the second stage (control + NC, n = 6; model + NC, n = 6; model + OE-Atoh1, n = 6) (For statistics, see Table S14). All data were shown as mean ± SEM. *p < 0.05, **p < 0.01.
Fig. 4
Fig. 4. Atoh1 regulates expression of Kif21b and affects microtubule stability under hypoxia.
a Upper: Venn diagram shows co-altered genes analyzed by the transcriptomics sequencing data (blue), the Atoh1-null sequence dataset (yellow), and the Atoh1-CHIP sequence dataset (green). bottom: sequence logo diagram shows a prediction of conserved motif of Atoh1. b Upper: Transcriptional factor binding site (TFBS) of Atoh1 predicted by the JASPAR database (relative score > 0.85). Bottom: Bar graph shows transcription of Kif21b by Atoh1 verified by real time-PCR in N2A cells (All groups, n = 3) (control + vector vs control + Si-Atoh1, t = 8.54, **p = 0.0011, df = 4; model + vector vs model + Si-Atoh1, t = 2.84, *p = 0.047, df = 4) (1.00 ± 0.07 vs 0.40 ± 0.07 vs 7.65 ± 1.14 vs 3.99 ± 1.42). c, Protein fractions extracted from N2A cells after transfection and hypoxia were tested with Kif21b and Atoh1. Upper panels show representative bands of proteins mentioned above. α-tubulin was used as internal control. Bar graphs show percentage changes of proteins, *p vs control + vector; #p vs model + vector (All groups, n = 3) (For statistics, see Table S15). d Protein fractions extracted from brains of P11.5 mice were tested with Kif21b and Atoh1. Upper panels show representative bands of proteins mentioned above. β-actin was used as internal control. Bar graphs show percentage changes of proteins relative to control (control, n = 3; model, n = 3) (For statistics, see Table S16). e Staining of N2A cells after transfection and hypoxia by antibody against MAP2. Scale bars: 20 μm. Objective 40x. Bar graphs show MFI of MAP2 staining, data were presented as relative changes (*p vs control+ vector; #p vs model+ vector; ^p vs model+ Lenti-Atoh1) (All groups, n = 6) (F = 14.14, df = (20, 3), control + vector vs model + vector, **p = 0.0010; control + vector vs model + Lenti-Atoh1, **p = 0.0010; control + vector vs model + Lenti-Atoh1 + Si-Kif21b, *p = 0.010; model + vector vs model + Lenti-Atoh1, #p = 0.039; model + Lenti-Atoh1 vs model + Lenti-Atoh1 + Si-Kif21b, ^p = 0.036) (1.00 ± 0.068 vs 0.74 ± 0.028 vs 0.61 ± 0.037 vs 0.73 ± 0.030). f Staining of cerebellar lobule IV-V by antibodies against MAP2 and NeuN in P11.5 mice after micro-injection of recombinant virus illustrated and hypoxia. The three panels below show a magnified view of dashed squares on the top. Scale bars: 50 μm (columns above, objective 20x); 20 μm (three columns below, objective 63x). Bar graphs on the left show MFI of MAP2 staining. Bar graphs on the right show MFI of MAP2 around per neuron, data were presented as relative changes (*p vs control+NC; #p vs model+NC; ^p vs model+ OE-Atoh1) (All groups, n = 6) (For statistics, see Table S17). g Protein fractions extracted from N2A cells after transfection and hypoxia were tested with acetyl-α-tubulin and total-α-tubulin. β-actin was used as internal control. Bar graphs show percentage changes of proteins, *p vs control + vector; #p vs model + vector (All groups, n = 3) (F = 35.34, df = (12, 5), vs control + vector, from left to right, p = 0.71, **p = 0.0010, **p = 0.0010, p = 0.30, **p = 0.0010; vs model + vector, from left to right, ##p = 0.0010, ##p = 0.0010, p = 0.577) (1.00 ± 0.10 vs 1.04 ± 0.050 vs 1.56 ± 0.057 vs 1.93 ± 0.060 vs 1.10 ± 0.059 vs 1.61 ± 0.049). All data were shown as mean ± SEM. *p < 0.05, **p < 0.01.
Fig. 5
Fig. 5. Downregulation of Atoh1 under hypoxia promotes MTs stability and neuronal migration.
a Protein fractions extracted from N2A cells after transfection and hypoxia were tested with TrkB, BDNF, SYP, Sema4F, pErk1/2, and Erk1/2. β-actin was used as an internal control. Bar graphs show percentage changes of proteins (*vs control+ vector; #vs model+ vector) (n = 3 per group) (For statistics, see Table S18). b Staining of N2A cells after transfection and hypoxia by antibody against MAP2. Scale bars: 20 μm. Objective 40x. Bar graph shows MFI of MAP2 staining, data were presented as relative changes (n = 6 per groups) (F = 4.70, df = (33, 2), control + vector vs model + vector, **p = 0.0080; model + vector vs model + Si-Atoh1, *p = 0.020) (1.00 ± 0.020 vs 0.94 ± 0.014 vs 0.99 ± 0.0082). c Staining of hippocampal CA2 by antibodies against MAP2 and NeuN in P11.5 mice after micro-injection of recombinant virus and hypoxia. The three right panels show a magnified view of dashed squares on the left. Scale bars: 50 μm (columns above, objective 20x); 20 μm (three columns below, objective 63x). Bar graph above shows MFI of MAP2 staining, data were presented as relative changes (n = 6 per group). Bar graph below shows MFI of MAP2 around per neuron, data were presented as relative changes (n = 6 per group) (For statistics, see Table S19). d Sholl analysis of cultured primary neurons stained by SYP after treatment illustrated. Line chart shows the intersection numbers of dendrites and concentric circles. (All groups, n = 6 batches for each group, n = 2 cells for each batch) (For statistics, see Table S20). e Staining of hippocampal CA1 by antibodies against SYP and NeuN in P11.5 mice after micro-injection of recombinant virus and hypoxia. The three right panels show a magnified view of dashed squares on the left. Scale bars: 50 μm (columns above, objective 20x); 20 μm (three columns below, objective 63x). Bar graph above shows MFI of SYP staining, data were presented as relative changes (For all groups, n = 6). Bar graph below shows density of SYP+ points on per neuron (For all groups, n = 12) (For statistics, see Table S21). f Protein fractions extracted from brains of P11.5 mice after hypoxia and micro-injection of recombinant virus were tested with TrkB, BDNF, SYP, Sema4F, pErk1/2, and Erk1/2. β-actin was used as an internal control. Bar graphs show percentage changes (n = 3 per group) (For statistics, see Table S22). All data were shown as mean ± SEM. *p < 0.05, **p < 0.01.
Fig. 6
Fig. 6. Downregulation of Atoh1/kif21b after hypoxia improves distant cognitive performance in mice.
a Upper: Sample tracing of mice in OF tests after manipulation. Bottom left: Schematic of the OF tests. Bottom right: Bar graphs show the total distance traveled in OF and time in inner space (n = 6 per group) (For statistics, see Table S23). b The most left panels: Schematic of the NOR tests. The right three panels: Sample tracing of mice in training and testing sessions. Bottom left panel: Bar graph shows the discrimination index. Bottom right panel: Bar graphs show the exploration time of the familiar and novel object (n = 6 per group) (discrimination index, F = 5.39, control + NC vs model + NC, *p = 0.014; control + NC vs sh-Atoh1, p = 0.63; model + NC vs model + sh-Atoh1, *p = 0.021) (discrimination index, 0.19 ± 0.030 vs 0.12 ± 0.050 vs 0.18 ± 0.040). Exploration time, for statistics, see Table S24. c The left panel: Schematic of the skinner’s box tests. Bar graphs show accuracy of mice in probing the correct hole in the first stage and the second stage (n = 6 per group) (For statistics, see Table S25). d Staining of hippocampal CA1 by antibodies against SYP and NeuN in mice at P60. The three right panels show a magnified view of dashed squares on the left. Scale bars: 50 μm (columns above, objective 20x); 20 μm (three columns below, objective 63x). Bar graph above shows MFI of SYP staining, data were presented as relative changes (For all groups, n = 6). Bar graph below shows density of SYP+ points on per neuron (For all groups, n = 12) (For statistics, see Table S26). e Protein fractions from brains of P60 mice were tested with SYP and MAP2. Panels above show representative bands of proteins mentioned above. α-tubulin was used as an internal control. Bar graphs show percentage changes of proteins (For all groups, n = 3) (from left to right: SYP, F = 13.50, df = (6, 2), **p = 0.0020, *p = 0.010, 1.00 ± 0.013 vs 0.80 ± 0.035 vs 0.95 ± 0.030; MAP2, F = 3.16, df = (6, 2), 1.00 ± 0.015 vs 0.93 ± 0.028 vs 0.94 ± 0.022). All data were shown as mean ± SEM. *p < 0.05, **p < 0.01.

Similar articles

Cited by

References

    1. van der Bom, T. et al. The changing epidemiology of congenital heart disease. Nat. Rev. Cardiol.8, 50–60 (2011). 10.1038/nrcardio.2010.166 - DOI - PubMed
    1. Ortinau, C. et al. Cortical folding is altered before surgery in infants with congenital heart disease. J. Pediatr.163, 1507–1510 (2013). 10.1016/j.jpeds.2013.06.045 - DOI - PMC - PubMed
    1. Morton, P. D., Ishibashi, N. & Jonas, R. A. Neurodevelopmental abnormalities and congenital heart disease insights into altered brain maturation. Circ. Res. 120, 960–977 (2017). 10.1161/CIRCRESAHA.116.309048 - DOI - PMC - PubMed
    1. Warnes, C. A. et al. Task force 1: the changing profile of congenital heart disease in adult life. J. Am. Coll. Cardiol.37, 1170–1175 (2001). 10.1016/S0735-1097(01)01272-4 - DOI - PubMed
    1. Naef, N. et al. Neurodevelopmental profiles of children with congenital heart disease at school age. J. Pediatr.188, 75–81 (2017). 10.1016/j.jpeds.2017.05.073 - DOI - PubMed

Publication types

Substances

LinkOut - more resources