. 2024 Sep;6(9):1712-1735.
doi: 10.1038/s42255-024-01121-9. Epub 2024 Sep 11.

Organization of a functional glycolytic metabolon on mitochondria for metabolic efficiency

Affiliations

Organization of a functional glycolytic metabolon on mitochondria for metabolic efficiency

Haoming Wang et al. Nat Metab. 2024 Sep.

Abstract

Glucose, the primary cellular energy source, is metabolized through glycolysis initiated by the rate-limiting enzyme hexokinase (HK). In energy-demanding tissues like the brain, HK1 is the dominant isoform, primarily localized on mitochondria, and is crucial for efficient glycolysis-oxidative phosphorylation coupling and optimal energy generation. This study unveils a unique mechanism regulating HK1 activity, glycolysis and the dynamics of mitochondrial coupling, mediated by the metabolic sensor enzyme O-GlcNAc transferase (OGT). OGT catalyses reversible O-GlcNAcylation, a post-translational modification influenced by glucose flux. Elevated OGT activity induces dynamic O-GlcNAcylation of the regulatory domain of HK1, subsequently promoting the assembly of the glycolytic metabolon on the outer mitochondrial membrane. This modification enhances the mitochondrial association with HK1, orchestrating glycolytic and mitochondrial ATP production. Mutation in HK1's O-GlcNAcylation site reduces ATP generation in multiple cell types, specifically affecting metabolic efficiency in neurons. This study reveals a previously unappreciated pathway that links neuronal metabolism and mitochondrial function through OGT and the formation of the glycolytic metabolon, providing potential strategies for tackling metabolic and neurological disorders.


Conflict of interest statement

COMPETING INTERESTS

The authors declare no competing interests.

Figures

Extended Data Fig. 1.
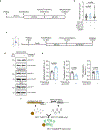
Extended Data Fig. 1.. The mitochondrial localization of Hexokinase 1 depends on glucose metabolism
a, Experimental scheme detailing the sequence of plating, transfection, imaging, and alteration of extracellular glucose levels in cultured rat hippocampal neurons. b, Evaluation of HK1-shRNA knockdown efficiency in Neuro-2a cells. HK1-shRNA and shRNA resistant eGFP tagged HK1 (HK1-GFP) were expressed for 48–72 hrs, and whole cell lysate (Input) were probed with anti-GFP and anti-Tubulin (loading control) antibodies. Asterisk indicates endogenous HK1. c, Quantification of endogenous HK1 (left) and eGFP-tagged HK1 (WT-HK1-GFP) (right) expression levels as shown in (b). All values are shown as mean ± SEM. n= 4 (Mann-Whitney U test). d, Experimental scheme detailing the sequence of plating, transfection, and imaging conditions for the 0mM glucose experiments in cultured rat hippocampal neurons. e, Axonal localization of HK1 in cultured rat hippocampal neurons transfected with HK1-shRNA, shRNA-resistant eGFP-tagged HK1 (pseudo-color, fire), and Mito-DsRed (gray). Representative axonal images were captured at 5mM glucose, following a 2-hour exposure to 0mM glucose, and at 5mM glucose after 2 hours exposure to 0mM glucose (1mM lactate and pyruvate), as depicted in (d). Scale bar represents 5μm. f, The mitochondrial (Mito) and cytoplasmic (Cyto) HK1 intensity ratios were quantified along axons. Data are presented as a violin plot with individual data points and associated p-value. n = 94–117 mitochondria, 9–10 axons from three independent experiments (one-way ANOVA with post hoc Tukey’s multiple comparison test). g, Axonal localization of HK1 in cultured rat hippocampal neurons transfected with HK1-shRNA, shRNA-resistant eGFP-tagged HK1 (pseudo-color, fire), and Mito-DsRed (gray). Representative images of axons were captured after 2 hours in 2mM glucose, and subsequently following 2 hours in 5mM glucose after initial exposure to 2mM glucose. The switch from 2mM to 5mM glucose was performed in the presence of either vehicle or OSMI-4 treatments. Scale bar represents 5μm. h, Quantification of mitochondrial (Mito) and cytoplasmic (Cyto) HK1 intensity ratios along axons. Data are presented as a violin plot with individual data points and associated p-value. n = 65–79 mitochondria, 10–11 axons (unpaired t-test). i, Blood glucose measurements from the Fasted and Re-fed mice used for comparing subcellular localization of Hexokinase 1 as shown in Fig. 1. n = 3 mice for each condition, three independent experiments. All values are shown as mean ± SEM (Mann-Whitney U test). j, HK1 distribution pattern in the CA3 region of the hippocampus in Ad-lib, and after 6 hours fasting (6hrs Fasted) states. Scale bar represents 10μm. k, Co-localization analysis to measure the percent intensity of HK1 on mitochondria for each condition. Data are presented as violin plots with individual data points and associated p-values. n = 9 hippocampal CA3 regions, 9 mice from three independent experiments (unpaired t-test).
Extended Data Fig. 2.
Extended Data Fig. 2.. O-GlcNAcylation promotes mitochondrial enrichment of Hexokinase 1 in various cell types
a, The experimental timeline illustrating the sequence of HEK293T cell plating, OGT transfection, administration of vehicle or Thiamet-G, and mitochondrial isolation. b, Analysis of mitochondrial size in cultured rat hippocampal neurons co-transfected with HK1-shRNA and eGFP-tagged HK1 to achieve endogenous HK1 levels. O-GlcNAcylation level was upregulated by ectopic OGT expression and Thiamet-G treatment, and downregulated by OGA expression and OSMI-4 treatment. Data are presented as a violin plot with individual data points and associated p-values. n= 83–120 mitochondria, 11–13 neurons, three independent experiments (one-way ANOVA with post hoc Kruskal-Wallis multiple comparison test). c, Experimental timeline outlining the sequence of plating, transfection, Thiamet-G and OSMI-4 treatments, and imaging of cultured rat hippocampal neurons in 5mM glucose for experiments illustrated in Fig. 2d. d, Western blot analysis of whole cell lysate (Input), isolated mitochondrial and cytoplasmic fractions from HEK293T. The samples were probed with antibodies against HK1, ATP5B (mitochondrial marker), and Tubulin (cytoplasmic marker) with or without ectopic OGT expression and Thiamet-G or vehicle treatments. e, Quantification of HK1 levels in mitochondrial (left), cytoplasmic (middle), and whole cell lysate (right) under indicated different conditions. n = 3 (all values are shown as mean ± SEM, Mann-Whitney U test). f, A schematic illustration of Native and Tissue-specific Fluorescence (NATF) method used for endogenous labeling of HK1 in C. elegans DA9 neuron.
Extended Data Fig. 3.
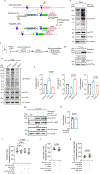
Extended Data Fig. 3.. Elucidating the O-GlcNAc modification of Hexokinase 1 and 2
a, Illustration of CRISPR-based approach to add eGFP tag at the C-terminal of HK1 in HEK293T cells. The strategy is based on transcript-202 (NM_000188.2) and was implemented by BioCytogen. b, Western blot analysis of the whole cell lysate (Input), used for the generation of mitochondrial and cytoplasmic fractions as shown in Fig. 3, from HEK293T cells. The whole cell lysate (Input) from CRISPR edited HEK293T cells was probed with antibodies against O-GlcNAc (RL2), GFP (HK1), OGT and tubulin (loading control), with or without OGT overexpression and Thiamet-G treatments. c, Schematic demonstrating the sequence of mitochondrial isolation and O-GlcNAc immunoprecipitation (IP) using the anti-O-GlcNAc antibody RL2 from cultured rat hippocampal neurons. d, Western blot analysis of mitochondrial fraction (Input) and O-GlcNAc IP using antibody against HK1 and ATP5B (mitochondrial marker). e-f, Western blot analysis of whole cell lysate from cortical neuron cultures. The lysate was probed with antibodies against O-GlcNAc (RL2), OGT, OGA, and tubulin (as a loading control), following treatments with Thiamet-G or OSMI-4. (f) Quantification of O-GlcNAcylation levels, normalized to tubulin. All values are presented as mean ± SEM. n= 3 independent experiments (Mann-Whitney U test). g, eGFP tagged Hexokinase 2 (HK2) was expressed in HEK293T cells. GFP antibody was used to immunoprecipitate (IP) HK2, with or without OGT overexpression and Thiamet-G treatments. The IPs were probed with anti-GlcNAc (RL2) and anti-GFP antibodies. Whole cell lysates (Input) were probed with anti-GFP and anti-tubulin antibodies. Rabbit IgG serves as an IP control. h, Quantification of HK2 O-GlcNAcylation levels. All values are shown as mean ± SEM, unpaired t-test. n= 3. i-k, Quantification of the expression levels of HK1-GFP (i), myc-OGA (1–400) (j) and nGFP-HA-OGA (544–706) (k) in COS-7 cells, as shown in Fig. 3d. Data are presented as a violin plot with individual data points and associated p-value. n= 42 cells, three independent experiments (Unpaired t-test, and one-way ANOVA with post hoc Tukey’s multiple comparison test).
Extended Data Fig. 4.
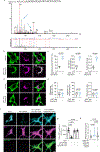
Extended Data Fig. 4.. Identification and functional analysis of Hexokinase 1 T259 O-GlcNAcylation Site
a, Tandem mass spectra showing O-GlcNAc on peptides derived from human Hexokinase 1. Data were acquired using HCD fragmentation and prominent y and b-type ions are labeled. Blue arrow indicates the O-GlcNAc modified threonine (T). Bottom figure demonstrating the survey scan and prominent y/b-type ions. b-e, Quantitative analysis of HK1 co-localization to measure the percentage of mitochondrial HK1 intensity in HEK293T cells, cultured in 5mM glucose containing media. (b and d) Representative images of HEK293T cells expressing WT-HK1-GFP or T259A-HK1-GFP (green) and Mito-DsRed (magenta) with or without OGT overexpression and Thiamet-G treatments. (c and e) WT and T259A HK1 intensity on mitochondria, percentage of total WT and T259A HK1 on mitochondria and the Pearson’s correlation coefficient (R value) for each condition. Data are presented as violin plots with individual data points and associated p-values. n = 9 cells, three independent experiments (Mann-Whitney U test). f, Representative images of hippocampal neurons expressing HK1-shRNA, WT-HK1-GFP, and the O-GlcNAc mutant T259A HK1-GFP (T259-HK1-GFP) are shown in green, along with Mito-DsRed in magenta. These images were stained with an HK1 antibody (in cyan) to visualize the total HK1 expression. g, Quantification of HK1 expression levels was performed retrospectively for all experiments by analyzing the anti-HK1 staining to ensure consistent endogenous HK1 levels throughout all experiments (one-way ANOVA with post hoc Tukey’s multiple comparison test). h, Quantification of the size of the mitochondria along the axons as depicted in Fig. 4g. n= 81–86 mitochondria from 10–13 axons from three independent experiments (one-way ANOVA with post hoc Kruskal-Wallis multiple comparison test).
Extended Data Fig. 5.
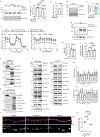
Extended Data Fig. 5.. O-GlcNAcylation modifies Hexokinase 1 activity and contributes to the formation of mitochondrial glycosome
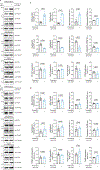
a-b, Quantification of WT and T259A-HK1 expression levels in HEK293T cells, corresponding to the Fig. 5b. Whole cell lysates (Input) were probed with anti-HK1 and anti-tubulin (loading control) antibodies. All values are shown as mean ± SEM. n= 4 (one-way ANOVA with post hoc Tukey's multiple comparison test). c-e, Glucose-6-phosphate (G6P) levels were measured in HEK293T cells (maintaining endogenous HK1 levels) following OGT overexpression and treatment with either Thiamet-G or vehicle. G6P levels in untreated cells were set as 1, and fold changes in response to Thiamet-G treatment and OGT overexpression were calculated. (d and e) Endogenous HK1 levels were quantified from whole cell lysates (Input) using anti-HK1 and anti-tubulin (loading control) antibodies (Mann-Whitney U test). f, Mitochondrial oxygen consumption rates (left) and extracellular acidification rates (right) were measured in HEK293T cells expressing control vector, eGFP-tagged WT, or T259A HK1, following treatment with either vehicle (DMSO) or overnight Thiamet-G treatment. The subsequent injections of Oligomycin (Oligo, 2 μM), FCCP (2 μM), and a combination of rotenone (Rot, 0.5 μM) and antimycin A (AA, 0.5 μM) were used to calculate ATP production rates. All values are presented as the mean ± SEM. g-i, HK1 levels in HEK293T cells used for metabolic measurements were quantified using western blot analysis of whole cell lysates, probed with antibodies against HK1 and tubulin (serving as a loading control). The asterisk indicates the presence of endogenous HK1. All values are shown as mean ± SEM. n= 3 (Mann-Whitney U test and and post hoc Kruskal-Wallis multiple comparison test). j, k, Western blot analysis of mitochondrial (Mito) and cytoplasmic (Cyto) fractions from HEK293T (j) and Cortical neurons (k) using antibodies against ATP5B (mitochondrial marker), Actin (cytosolic marker), Golgin 97 (Golgi Marker), KDEL and CKAP4 (endoplasmic reticulum marker), PEX19 (peroxisome marker), LAMP2 (lysosome marker) and Lamin A (nuclear marker). Input indicates whole cell lysate from Cortical neurons. Total loading amount per lane is indicated as percentage for each fraction. l-m, Analysis of glycolytic enzymes in mitochondrial and cytoplasmic fractions from rat cortical neurons. Mitochondrial (left) and cytoplasmic fractions (right) from rat cortical neurons, treated overnight with vehicle or Thiamet-G to upregulate O-GlcNAcylation, were analyzed for all glycolytic enzymes using the following antibodies: HK1, Glucose-6-phosphate isomerase (GPI), phosphofructokinase muscle isoform (PFK M), Aldolase A (Aldo A), Glyceraldehyde 3-phosphate dehydrogenase (GAPDH), Phosphoglycerate kinase (PGK), Phosphoglycerate mutase 1 (PGAM1), neuron-specific enolase (NSE), Triosephosphate isomerase (TPI), Pyruvate kinase (PKM), ATP5B (mitochondrial loading control), and Tubulin (cytoplasmic loading control) (l). Quantified enzyme levels under baseline conditions (m) were normalized to 1 (dashed line), and fold changes in response to Thiamet-G treatment were calculated. All values are shown as mean ± SEM. n = 3–4 independent experiments. n-o, Axonal segments of hippocampal neurons cultured in 5mM glucose, co-transfected with Mito-DsRed (gray), and human PKM2 tagged with mEGFP (pseudocolor, fire). O-GlcNAcylation level was upregulated by Thiamet-G treatment, and downregulated by OSMI-4 treatment. Scale bar represents 5μm. (o) Quantification of mitochondrial (Mito) and cytoplasmic (Cyto) PKM2-mEGFP intensity ratios along axons. Data are presented as a violin plot with individual data points and associated p-values. n = 93–110 mitochondria from 9–12 axons, three independent experiments (one-way ANOVA with post hoc Tukey’s multiple comparison test)
Extended Data Fig. 6.
Extended Data Fig. 6.. Hexokinase 1 O-GlcNAcylation is required for glycosome formation
a-d, Analysis of glycolytic enzymes in mitochondrial and cytoplasmic fractions from HEK293T cells expressing WT-HK1-GFP or T259-HK1-GFP. Whole cell lysates, as well as mitochondrial and cytoplasmic fractions from HEK293T cells expressing WT (a and b) and T259A HK1 (c and d) with or without ectopic OGT expression and overnight vehicle (DMSO) or Thiamet-G treatment, were analyzed to quantify the glycolytic enzyme levels. The following antibodies were used: HK1, Aldolase A (Aldo A), Phosphoglycerate kinase (PGK), Pyruvate kinase 2 (PKM2), ATP5B (mitochondrial loading control), and Tubulin (cytoplasmic loading control). Quantified enzyme levels under baseline conditions were normalized to 1, and fold changes in response to OGT overexpression and Thiamet-G treatment were calculated. All values are shown as mean ± SEM. n = 3 independent experiments (Mann-Whitney U test).
Extended Data Fig. 7.
Extended Data Fig. 7.. Hexokinase 1 O-GlcNAcylation and neuronal functional measurements
a, Representative images of neuronal soma expressing shRNA-resistant BFP tagged WT or T259A-HK1 (blue) with HK1-shRNA, mCherry cell filler (magenta), and vGLUT1-pH (green). b-c, Retrospective quantification of WT-HK1 and T259A-HK1-BFP, and vGLUT1-pH (c) in rat hippocampal neurons used for imaging experiments depicted in Fig. 7. Scale bar represents 5μm. All values are presented as mean ± SEM. n= 12–13 neurons from three independent experiments (unpaired t-test). d-g, The experimental design outlines the timeline for the plating, transfection, Tetrodotoxin (TTX) treatment, and imaging of cultured rat hippocampal neurons. e, Hippocampal neurons were transfected with shRNA-resistant BFP-tagged WT or T259A-HK1-BFP, HK1-shRNA, and vGLUT1-pH. Following transfection, 1μM TTX was added to neuronal culture. Two hours before imaging, TTX was washed-off as shown in (d). Neurons were electrically stimulated with 100 APs 10Hz. Images showing vGLUT1-pH (pseudo-color, fire) and the cell filler mCherry (gray) before and after stimulation with WT-HK1 or T259A-HK1-BFP expressing neurons. Neutralization of vGLUT1-pH vesicles with NH4Cl reveals total axonal vesicle pool. f, Average traces of vGLUT1-pH with 100 APs 10Hz stimulation in WT-HK1 (black) or T259A-HK1 (orange) expressing neurons, previously TTX treated. ΔF values were normalized to maximal ΔF obtained from NH4Cl treatment. Error bars represent SEM. n = 8–9 neurons and 20–55 presynaptic boutons from four independent experiments. g, Baseline and maximal (after electrical stimulation) vGLUT1-pH ΔF/F values. All values are shown as mean ± SEM (unpaired t-test).
Extended Data Fig. 8.
Extended Data Fig. 8.. Impact of Hexokinase 1 O-GlcNAcylation on Presynaptic Calcium Dynamics
a, Hippocampal neurons were transfected with shRNA-resistant BFP-tagged WT or T259A-HK1-BFP, HK1-shRNA, and GCaMP6s. The displayed images illustrate the GCaMP6s signal (pseudo-colored, fire) and the cell filler mCherry (magenta) prior to and following stimulation with 100 APs at 10Hz. in neurons expressing either WT-HK1 or T259A-HK1-BFP. The peak of the Ca2+ response elicited by KCl defines the maximum GCaMP6s intensity. The scale bar represents 5μm. b, The average trace of GCaMP6s during the 100 APs at 10Hz stimulation in neurons expressing either WT-HK1 or T259A-HK1. ΔF values were normalized to the maximal ΔF observed during KCl treatment. All values are presented as mean ± SEM. n = 132 ROIs, 12 neurons from three independent experiments. c, Maximum GCaMP6s ΔF/Fmax values. Data are presented as a violin plot with individual data points and associated p-value (unpaired t-test). d-f, Retrospective quantification of WT-HK1 and T259A-HK1-BFP (blue), GCaMP6s, and mCherry cell filler (magenta) in rat hippocampal neurons used for imaging experiments depicted in (d-f). Scale bar represents 10μm. All values are presented as mean ± SEM. n= 12–13 neurons from three independent experiments (unpaired t-test). g, Representative raster plots of demonstrating the firing patterns of rat cortical neurons (cultured on microelectrode array plates) across 64 electrodes at different time points, following transduction with lentiviral particles containing shRNA-resistant GFP-tagged WT or T259A-HK1, and HK1-shRNA. Each black line indicates a detected spike (action potentials), while blue lines represent a single-channel burst, defined as a sequence of at least five spikes with an inter-spike interval not exceeding 100 milliseconds. Each magenta line indicates coordinated bursts across the electrodes, known as network bursts h, Mean firing rate (Hz) and network bursts were calculated from MEA recordings of neurons expressing WT or T259A-HK1. Data are shown as mean values ± SEM with associated p-values (unpaired t-test), n = 5–6 MEA recordings across conditions, from two independent primary neuron preparation.
Fig. 1.
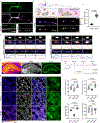
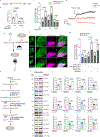
Fig. 1.. Glucose-dependent regulation of Hexokinase 1 localization
a, Immunofluorescence staining of hippocampal neurons for endogenous Hexokinase 1 (HK1; green) and mitochondria (MitoDsRed; gray), illustrating subcellular localization of HK1 in the somatodendritic region, axon and dendrites (three independent experiments). b-e, Hippocampal neurons cultured in 5mM glucose, expressing MitoDsRed (gray), wild-type (WT) human HK1 tagged with eGFP, and rat shRNA-HK1 to achieve endogenous level of HK1 (pseudocolor, fire), then transferred to 1mM glucose for 72 hours. (c) Representative axonal images following a 2-hour exposure to 5mM glucose or at 1mM glucose, as in (b). Scale bar represents 5μm (a,b), pseudocolor scale indicates low to high intensity. (d) Quantification of mitochondrial (Mito) and cytoplasmic (Cyto) HK1 intensity ratios along axons. Data are presented as a violin plot with individual data points and associated p-value. n = 102–117 mitochondria, 9–10 axons from three independent experiments (unpaired two-tailed t-test) (e) Spatiotemporal changes of HK1 was measured by live-cell imaging for 10 minutes along the axon within cytoplasmic (Cyto; blue intensity plot) and mitochondrial (Mito; orange intensity plot) compartments during a medium switch from 1 to 1mM or 5mM glucose (Scale bar represents 2μm). f-i, Immunofluorescence staining of mouse brain coronal slices (Bregma, -2mm) with antibodies against HK1 (pseudocolor, fire), mitochondrial marker Pyruvate Dehydrogenase (PDH; gray) and neuronal marker NeuN (green). (f) The hippocampal section at ad libitum fed state (Ad-lib). Scale bar represents 100μm. (g) Enlarged images of white dashed boxes in (f) display the HK1 distribution in the CA3 region of the hippocampus in Ad-lib, Fasted and Re-fed states. Scale bar represents 10μm. (h) Schematic illustration of the experiment for altering blood glucose levels through fasting and refeeding in mice, used to compare HK1 localization in the brain. (i) Co-localization analysis to measure the percent intensity of HK1 on mitochondria and mitochondrial HK1, the Pearson’s correlation coefficient (R value), and quantification of HK1 level for each condition. Data are presented as violin plots with individual data points and associated p-values. n = 3 mice and biological replica per condition (one-way ANOVA with post hoc Holm-Šídák's multiple comparison test). See also Extended Data Fig. 1.
Fig. 2.
Fig. 2.. O-GlcNAcylation regulates mitochondrial localization of Hexokinase 1
a, Schematic representation of glucose metabolism via Hexosamine Biosynthetic Pathway (HBP). Rate-limiting steps and inhibitors used in this study are also indicated. Increased glucose flux upregulates HBP pathway, UDP-GlcNAc synthesis, and OGT activity. b-c, Mitochondrial and cytoplasmic fractions, obtained from rat cortical neurons treated overnight with OGA inhibitor Thiamet-G to enrich neuronal O-GlcNAcylation or vehicle (DMSO), were separated by SDS gel electrophoresis and probed with anti-HK1, anti-ATP5B (mitochondrial marker), and anti-tubulin (cytoplasmic marker). (c) Quantification of HK1 bands normalized to the intensity of ATP5B (mitochondrial fraction) or tubulin (cytoplasmic fraction) for each condition. n = 3 independent experiments (All values are shown as mean ± SEM; unpaired two-tailed t-test). d-e, Manipulating O-GlcNAcylation affects HK1 localization in neurons. (d) Axonal segments of hippocampal neurons cultured in 5mM glucose, co-transfected with MitoDsRed (gray), rat shRNA-HK1, and wild-type human (WT) HK1 tagged with eGFP(pseudocolor, fire) to achieve endogenous expression level of HK1. O-GlcNAcylation level was upregulated by ectopic expression of OGT and Thiamet-G treatment, and downregulated by expression of OGA and OSMI-4 treatment. Scale bar represents 5μm. (e) Quantification of mitochondrial (Mito) and cytoplasmic (Cyto) HK1 intensity ratios along axons. Data are presented as a violin plot with individual data points and associated p-values. n = 83–120 mitochondria from 11–13 axons across conditions, three independent experiments (one-way ANOVA with post hoc Tukey’s multiple comparison test). f-h, In vivo imaging of endogenously-GFP tagged HK1 in C. elegans neurons. (f) Schematic representation of the DA9 neuron cell body in C. elegans nervous system. (g) DA9 neurons expressing (hxk-1) HK1–7xSplitGFP (pseudo-color, fire) and mito-TagRFP (gray) following vehicle (DMSO) or OGT inhibitor ST045849 treatments. Scale bar represents 5μm. (h) Mitochondrial and cytoplasmic HK1–7xSplitGFP ratios were quantified from DA9 neuron cell bodies for each condition. Data are presented as a violin plot with individual data points and associated p-value. n = 16–23 cell bodies, three independent experiments (unpaired two-tailed t-test). See also Extended Data Fig. 2.
Fig. 3.
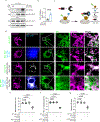
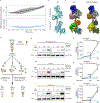
Fig. 3.. OGT and OGA regulate Hexokinase 1 O-GlcNAcylation
a-b, The impact of O-GlcNAcylation upregulation, elicited by ectopic OGT expression and Thiamet-G treatment, on HK1 was investigated using immunoprecipitation (IP) of endogenous HK1 from HEK293T-eGFP-HK1 cells (CRISPR-edited cells expressing endogenously eGFP-tagged HK1). HK1 was immunoprecipitated using an anti-GFP antibody from cells treated overnight with either vehicle (DMSO) or Thiamet-G, with or without OGT expression. Rabbit IgG served as a negative IP control. Input lanes, which were loaded with 3% of cell lysates used for IP, were also probed with an anti-tubulin antibody to confirm equal loading. (b) HK1 O-GlcNAcylation was quantified by normalizing the intensity of each GlcNAc band to the corresponding HK1 (GFP) band. OGT overexpression resulted in a significant increase in HK1 O-GlcNAcylation. n = 3 independent experiments (mean ± SEM; unpaired one-tailed t-test). c-g, Selective downregulation of HK1 O-GlcNAcylation by a nanobody-fused split OGA eraser and evaluation of subcellular localization. (c) Schematic illustrating the approach to selectively downregulate HK1 O-GlcNAcylation using eGFP-tagged HK1 (HK1-GFP) and GFP-nanobody (nGFP)-directed split O-GlcNAc eraser (nGFP-HA-OGA (544–706) and myc-OGA (1–400)). The OGA enzyme was engineered into a split and truncated form with limited substrate activity. nGFP-HA-OGA (544–706) recognizes HK1-GFP and redirects the catalytic half of OGA myc-OGA (1–400), to remove the O-GlcNAc modification from HK1. (d) Representative images of COS-7 cells expressing HK1-GFP (green), myc-OGA (1–400) (blue) and nGFP-HA-OGA (544–706) (gray). The subcellular localization of HK1 was examined using immunofluorescence staining with anti-Tomm20 (mitochondrial marker; magenta), anti-myc (myc-OGA (1–400); blue) and anti-HA (nGFP-HA-OGA (544–706); gray) antibodies. The HK1 distribution pattern is highlighted in the enlarged images corresponding to the white dashed boxes in (d). Scale bars represents 5μm. (e-g) Quantitative analysis of HK1 co-localization to assess the percentage of mitochondrial HK1 intensity (e), HK1 intensity on mitochondria (f), and the Pearson’s correlation coefficient (R value) for each condition (g). Data are presented as violin plots with individual data points and associated p-values. n = 42 cells from three independent experiments (one-way ANOVA with post hoc Tukey’s multiple comparison test). See also Extended Data Fig.3.
Fig. 4.
Fig. 4.. OGT-dependent regulation of Hexokinase 1 localization requires O-GlcNAcylation
a-f, Characterization of HK1 O-GlcNAcylation. (a) To identify the O-GlcNAc modification site, eGFP tagged HK1 (with or without OGT/Thiamet-G) was overexpressed in HEK293T cells and immunoprecipitated (IP). Input lanes contained 3% cell lysates used for the IP. Anti-tubulin staining used as a loading control. HK1 O-GlcNAcylation levels were quantified by normalizing the intensity of each GlcNAc band to the intensity of HK1-GFP bands (Three biological replicas, mean ± SEM and associated p-values; unpaired one-tailed t-test). (c) Human HK1 (amino acid residues 256–275) sequence alignment with different species. O-GlcNAcylated threonine (T) residue(red), conserved amino acids (black) and HK isoforms are also shown. (d) Structural differences between the unmodified HK1 (gray) and O-GlcNAcylated HK1 (blue). The Cα atoms in residues 20 to 460 were used for alignment. Top left inset shows key residues coordinating the phosphate of G6P and the 2’ hydroxyl. Bottom left inset shows the binding pockets for G6P (green) and glucose (purple). Right inset shows T259-HK1 with O-GlcNAcylation, the single-turn alpha-helix (residues 260 to 264) forms a flexible loop to accommodate the O-GlcNAc with the positions of G6P and glucose. (e) Either wild type (WT) or O-GlcNAc site mutated (T259A) HK1-GFP IP’ed from HEK293T cells, with or without OGT/ Thiamet-G. Then were analyzed with anti-GlcNAc and anti-GFP antibodies to quantify HK1 GlcNAcylation levels. (f) The intensity of each GlcNAc band was normalized to the GFP band for quantification of O-GlcNAcylation levels (Three biological replicas, mean ± SEM and associated p-values; One-way ANOVA with post hoc Tukey's multiple comparison test). (g,h), Hippocampal neurons cultured in 5mM glucose, expressing MitoDsRed (gray), rat shRNA-HK1, and T259A-Hk1-GFP (pseudocolor, fire). O-GlcNAcylation levels were upregulated by OGT and Thiamet-G treatment, and downregulated by OGA and OSMI-4 treatment. Scale bar represents 5μm. The mitochondrial (Mito) and cytoplasmic (Cyto) HK1 intensity ratios along axons. Data are presented as a violin plot with individual data points and associated p-values. n = 81–86 mitochondria from 10–13 axons, three independent experiments (one-way ANOVA with post hoc Tukey's multiple comparison test, Scale bar represents 5μm). See also Extended Data Fig. 4.
Fig. 5.
Fig. 5.. Hexokinase 1 O-GlcNAcylation enhances metabolic efficiency
a, Hexokinase catalyzes the first step of glucose metabolism, where glucose and ATP are converted into glucose-6-phosphate (G6P) and ADP. b, Quantification of G6P levels in HEK239T cells expressing eGFP-tagged WT or T259A HK1 with or without ectopic OGT expression and Thiamet-G treatment (Four biological replicas, mean ± SEM and associated p-values; One-way ANOVA, post hoc Holm-Šídák's multiple comparison test). c, Mitochondrial/glycolytic ATP production rates calculated from HEK293T cells expressing control vector, WT or T259A HK1, following vehicle or Thiamet-G treatments (Three biological replicas, mean ± SEM and associated p-values; Mann-Whitney U test). d, Average fluorescence traces of the intracellular F1,6BP sensor, HYlight, in neuronal axons expressing shRNA-resistant FLAG-tagged WT or T259A-HK1, and rat shRNA-HK1. The arrowhead indicates the application of the glycolysis inhibitor 2-deoxyglucose (2-DG) and the electrical field stimulation (100 AP, 10 Hz). Data are presented as mean ± SEM. n= 10 neurons from three independent experiments. e, The strategy for inducing the mitochondrial relocation of truncated cytoplasmic HK1 (Tr-HK1). The dimerization of the FRB domain on Tr-HK1-GFP and the FKBP domain on a mitochondria-targeted mCherry tag upon AP21967 treatment. f,g, Representative HEK293T cell expressing FRB-Tr-HK1-GFP(green) and mCherry-mito-FKBP(magenta) before and 10 minutes after dimerizer treatment. Scale bars represents 5μm. (g) Mitochondrial and glycolytic ATP production rates were calculated for HEK293T cells expressing either control Tr-HK1-GFP, FRB-Tr-HK1-GFP, or FRB-Tr-HK1-T259A-GFP, with or without AP21967 treatments. (Three biological replicas, mean ± SEM, one-way ANOVA, post hoc Kruskal-Wallis multiple comparison test). h, Diagram illustrating glycolysis enzymes. The two steps of glycolysis that generate ATP are indicated by red arrows. i-j, Analysis of glycolytic enzymes in mitochondrial and cytoplasmic fractions. HEK293T cells treated with vehicle/Thiamet-G, then mitochondrial/cytoplasmic fractions were subjected to SDS-PAGE and analyzed by Western blotting using antibodies against HK1, PKM2, Aldo A, PGK, ATP5B (mitochondrial marker), and tubulin (cytoplasmic marker). (j) Quantification of glycolytic enzymes in mitochondrial, cytoplasmic fractions, and total cell lysates (input), normalized to the intensity of ATP5B and tubulin. Data are presented as mean ± SEM from three biological replicas (one-tailed Mann-Whitney U test). See also Extended Data Fig. 5.
Fig. 6.
Fig. 6.. O-GlcNAcylation Modifies G6P Affinity and Stabilizes Hexokinase 1 on Mitochondria
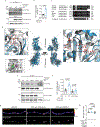
a, The average accumulated work profiles computed from steered MD simulations, in which Glucose-6-phosphate (G6P) was pushed out of the N-terminal binding pocket. The line represents the average accumulated work over 20 steered MD simulations, and the shading indicates one standard deviation from the mean accumulated work. b, Optimal pathway of information transfer from the N-terminal Ser:449 to the C-terminal T:784 for the unmodified HK1. Dark blue nodes (spheres representing Cα atoms) and edges (cylinders representing allosteric interactions) illustrate the optimal pathway of allosteric interactions. c, The community substructure for the network of allosteric interactions. Nodes within a community (single color) represent a network of interactions with more frequent and stronger connections with nodes in a community than with nodes outside of that community. Black edges represent connections between communities. d, Schematic diagram illustrating the G6P titration assay for mitochondrial fractions. Isolated mitochondria, containing HK1, were exposed to three different concentrations of G6P for 30 minutes at room temperature. Following incubation, mitochondria and the supernatant, which contains the released HK1, were separated by centrifugation. Both the pellet (mitochondria) and supernatant (flowthrough containing released HK1) were collected and subsequently analyzed. e-j, Mitochondrial fractions were prepared from HEK239T cells expressing control vector (e and f), eGFP-tagged WT (g and h) or T259A HK1 (i and j) with or without OGT co-expression and overnight Thiamet-G treatment. Flowthrough (FT) fractions were collected as described in (d) following 0, 250 and 500μM G6P treatments of the mitochondrial pellet (Mito). (e,g,i) Samples were then separated by SDS gel electrophoresis, and probed with anti-HK1, anti-ATP5B (mitochondrial marker) antibodies. (f,h,j) The total intensity of HK1 band was quantified for each condition. n = 3 independent experiments (All values are shown as mean ± SEM; One-way ANOVA with post hoc Holm-Šídák's multiple comparison test). See also Extended Data Fig. 6.
Fig. 7.
Fig. 7.. Presynaptic function relies on Hexokinase 1 O-GlcNAcylation
a-c, Representative images of neuronal axons expressing ATP sensor iATPSnFR1.0-mRuby (pseudo-color, fire for iATPSnFR and magenta for mRuby), and shRNA-resistant BFP tagged WT or T259A-HK-1 (gray) with HK1-shRNA. Images were taken before, 40 seconds and 490 seconds after stimulation at 10Hz 100AP, and with indicated pharmacological treatments. Scale bar represents 5μm. (b) Average fluorescence traces of iATPSnFR, with indicated conditions or pharmacological treatments and field stimulation (10 Hz, 100AP) (black: WT-HK1-BFP with HK1shRNA; brown: T259A-HK1-BFP with HK1-shRNA; red: 2-DG and Oligomycin treated neurons). (c) Average fluorescence traces of mRuby (magenta) control under conditions as indicated in (b), before, and 40- and 490-seconds following stimulation at 10Hz 100AP. All values are shown as mean ± SEM. n= 9–10 neurons, three independent experiments. d, Schematic of the pHluorin-tagged vesicular glutamate transporter 1 (vGLUT1-pH) located at the presynaptic release site of a neuron. The pHluorin protein, conjugated to the luminal domain of vGLUT1, exhibits fluorescence quenching at the acidic pH (~5.5) inside synaptic vesicles. Upon neuronal stimulation and vesicle fusion, the luminal tag is exposed to the extracellular pH, leading to a significant increase in fluorescence. Post-endocytosis, pHluorin fluorescence is quenched again as the vesicle lumen becomes acidic by the activity of the vacuolar ATPase (v-ATPase). e, The schematic demonstrating the experimental design. f-h, Hippocampal neurons expressing either WT or T259A-HK1-BFP, HK1-shRNA with vGLUT1-pH were electrically stimulated with 100 APs at 10 Hz. Representative images display vGLUT1-pH (pseudocolor, fire) and mCherry cell filler (gray) before and after stimulation in neuronal axons expressing either WT or T259A-HK1-BFP. Neutralization of vGLUT1-pH vesicles with NH4Cl treatment reveals total axonal vesicle pool. Scale bar represent 5μm. (g) Average trace of vGLUT1-pH with 100 APs 10Hz stimulation in WT-HK1 (black) or T259A-HK1 (orange) expressing neurons. ΔF values were normalized to maximal ΔF obtained from NH4Cl treatment. (h) Baseline and maximal (post-electrical stimulation) vGLUT1-pH ΔF/F values. All values are shown as mean ± SEM. n = 10–11 neurons and 91–205 presynaptic boutons, four independent experiments (unpaired two-tailed t-test). See also Extended Data Fig. 7 and 8.

References

    1. Herrero Martin JC, et al. An ETFDH-driven metabolon supports OXPHOS efficiency in skeletal muscle by regulating coenzyme Q homeostasis. Nat Metab 6, 209–225 (2024). - PMC - PubMed
    1. Ho T, Potapenko E, Davis DB & Merrins MJ A plasma membrane-associated glycolytic metabolon is functionally coupled to K(ATP) channels in pancreatic alpha and beta cells from humans and mice. Cell Rep 42, 112394 (2023). - PMC - PubMed
    1. Hong M, et al. Cardiac ATP-sensitive K+ channel associates with the glycolytic enzyme complex. FASEB J 25, 2456–2467 (2011). - PMC - PubMed
    1. Patrick M, et al. Metabolon formation regulates branched-chain amino acid oxidation and homeostasis. Nat Metab 4, 1775–1791 (2022). - PMC - PubMed
    1. Puchulu-Campanella E, et al. Identification of the components of a glycolytic enzyme metabolon on the human red blood cell membrane. J Biol Chem 288, 848–858 (2013). - PMC - PubMed