. 2024 Dec;20(12):1662-1669.
doi: 10.1038/s41589-024-01712-3. Epub 2024 Sep 11.

Enriching productive mutational paths accelerates enzyme evolution

Affiliations

Enriching productive mutational paths accelerates enzyme evolution

David Patsch et al. Nat Chem Biol. 2024 Dec.

Abstract

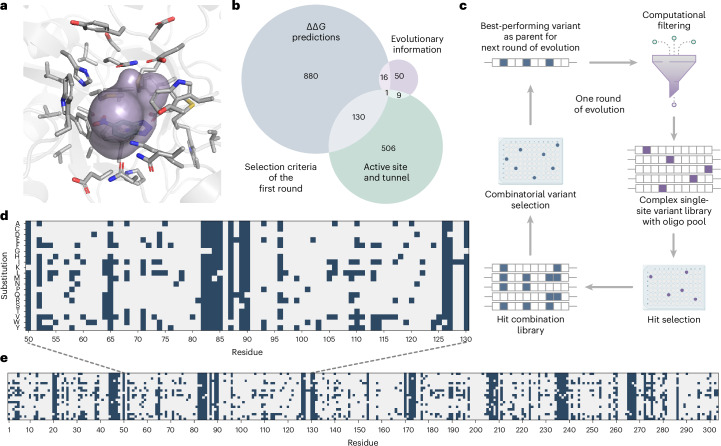
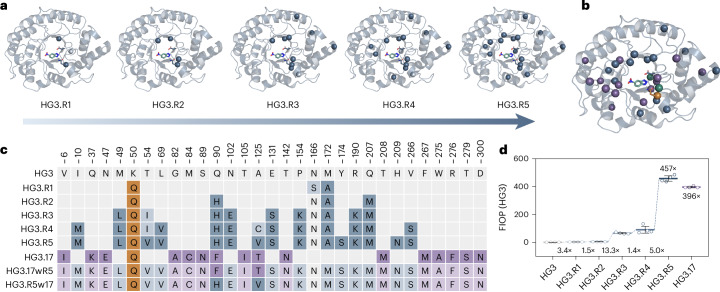
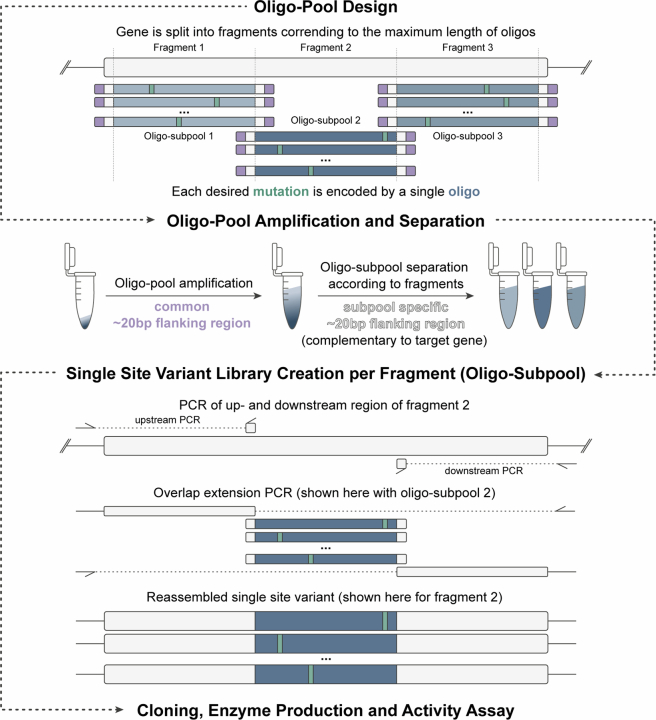
Darwinian evolution has given rise to all the enzymes that enable life on Earth. Mimicking natural selection, scientists have learned to tailor these biocatalysts through recursive cycles of mutation, selection and amplification, often relying on screening large protein libraries to productively modulate the complex interplay between protein structure, dynamics and function. Here we show that by removing destabilizing mutations at the library design stage and taking advantage of recent advances in gene synthesis, we can accelerate the evolution of a computationally designed enzyme. In only five rounds of evolution, we generated a Kemp eliminase-an enzymatic model system for proton transfer from carbon-that accelerates the proton abstraction step >108-fold over the uncatalyzed reaction. Recombining the resulting variant with a previously evolved Kemp eliminase HG3.17, which exhibits similar activity but differs by 29 substitutions, allowed us to chart the topography of the designer enzyme's fitness landscape, highlighting that a given protein scaffold can accommodate several, equally viable solutions to a specific catalytic problem.


Conflict of interest statement

Competing interests: All authors declare no competing interests.

Figures

Fig. 1
Fig. 1. Stability predictions guide library design of Kemp eliminase HG3.
a, The Kemp elimination reaction proceeds through deprotonation of 5-nitrobenzisoxazole (1) to afford salicylonitrile (2). The double dagger indicates the transition state of the reaction. b, Structure of the TSA 6-nitrobenzotriazole (3). c, Density plot of predicted ΔΔG values for HG3 sequences containing single-point mutations (lower values correspond to higher predicted stability). The gray histogram depicts the ΔΔG values of all possible single-site HG3 variants (5,758 variants including wild type, covering residues E1 to Q303). The purple histogram depicts the distribution of the ΔΔG values for HG3 variants, each containing a single beneficial mutation from HG3.17. d, In total, 48.3% (2,781) of all possible single-site HG3 variants (purple-shaded area) exhibit predicted ΔΔG values that lie within the ΔΔG interval defined by the single-site variants containing the most and the least stabilizing mutation found in HG3.17 (HG3 T208M, −4.9 REU and HG3 W275A, 3 REU). Comparatively, 2.4% (138) of all HG3 single-site variants are predicted to contain a more stabilizing mutation (blue-shaded area) and 49.3% (2,839) of all single-site variants are predicted to contain a more destabilizing mutation (gray-shaded area). e, List of ΔΔG values (given in REU) for HG3 sequences containing beneficial single mutations from HG3.17. The most (T208M) and least (W275A) stabilizing mutations are highlighted with a purple box. Source data
Fig. 2
Fig. 2. Library design and variant selection strategy.
a, All HG3 residues (shown in gray sticks) within a 6 Å radius around the TSA 6-nitrobenzotriazole (3) as well as residues lining the active site entry tunnel (purple area, identified with Caver 3.0 (ref. )) were selected as ‘active site and tunnel residues’ and fully saturated. For each round, the TSA (3) was placed by aligning the crystal structure of HG3.17 (PDB 4BS0) to an AlphaFold model of the round’s parent (depicted here: HG3). b, HG3 libraries were designed by including all single-site variants with a predicted ΔΔG below −0.5 REU, all variants obtainable by fully saturating the active site and tunnel residues as well as single-site variants derived from a HotSpot Wizard analysis. c, Schematic representation of a full cycle of engineering, consisting of computational filtering, constructing and screening of the complex single-site variant libraries to identify improved variants, followed by analyzing a combinatorial library built from identified beneficial mutations (hit combination library). The best-performing variant identified in the hit combination library served as the parent for the next round of engineering. d, Heatmap representation of the complex single-site variant library of the first round, highlighting the substitution pattern between sites 50 and 130. Amino acid substitutions, which are included in the oligo pools, are indicated as blue squares (for example, residue 50 is fully saturated excluding the wild-type amino acid lysine), e, Heatmap representation of the entire library design underscoring the attainable library complexity using oligo pools. Source data
Fig. 3
Fig. 3. Evolutionary trajectory of HG3.R5.
a, The evolutionary intermediates from each optimization round are depicted, showing the acquired mutations as dark blue spheres. The light blue spheres indicate transient mutations that undergo further substitution during evolution. b, Comparison of residues mutated in HG3.R5 (blue spheres) and HG3.17 (purple spheres), highlighting the two shared sites Q90 and A125 (green spheres) and the common mutation K50Q (orange sphere). The catalytic dyad (D127 and Q50) is shown in stick representation. c, Overview of the mutations acquired over the five rounds of evolution to yield HG3.R5, allowing a comparison to the mutations present in HG3.17. Mutation patterns for HG3.17 and the combinatorial variants HG3.R5w17 and HG3.17wR5 are included for comparison. d, Graph highlighting the FIOP of the intermediate and final Kemp variants for the cleavage of 5-nitrobenzisoxazole (1) under plate screening conditions. The data are obtained from four independent replicates and presented as mean ± s.d. The blue dashed line connects variants from the HG3.R5 trajectory. The FIOP of HG3.17 assayed under the same conditions is depicted for comparison. Structural illustrations are adapted from PDB 8RD5. FIOP, fold improvement over parent. Source data
Fig. 4
Fig. 4. Structural comparison of HG3, HG3.17 and HG3.R5.
a, Overlay of the cartoon representation of HG3.R5 (blue, PDB 8RD5), HG3 (gray, PDB 5RGA) and HG3.17 (purple, PDB 5RGE) with bound TSA (3). b, Root mean square deviation (RMSD) (Cα) between HG3 and HG3.R5 with bound ligand (3) (n = 8 pairwise alignments of the biological assemblies in the asymmetric unit of PDB 5RGA, 7K4Q and 8RD5). Blue spheres represent mutations in HG3.R5. c, RMSD (Cα) between HG3 and HG3.17 with bound TSA (3) (n = 16 pairwise alignments of the biological assemblies in the asymmetric unit of PDB 5RGA, 5RGE, 7K4Q, 7K4Z and 4BS0). Purple spheres highlight mutations in HG3.17, while black spheres denote catalytic residues K50Q and D127 (b,c). The uncertainty of the pairwise alignments is represented by shading (b,c). d, Overlay of the active sites of HG3 (light gray) and HG3.R5 (blue) highlights the effect of mutation M172A (left) on the conformation of M84 (movement of ∼2 Å) and W87 (movement of ∼2.5 Å) as well as of mutations M49L and L69V (right) on the conformation of P45 (movement of ∼2.4 Å) providing space for the binding of a water molecule (red sphere) not present in the original design HG3. e, Overlay of the active sites of HG3 (light gray) and HG3.17 (purple) highlights that a similar side chain movement of W87 (∼2.5 Å) is enabled by mutation M84C (left), while a conformational change of P45 (∼1 Å) and M49 (∼1.9 Å) is likely triggered through the proximate mutation G82A (right). The latter conformational changes allow the binding of a water molecule (red sphere) not present in the original design HG3. Pymol (2.5.5) was used to measure distances and present structures. Source data
Fig. 5
Fig. 5. Schematic representation of HG3’s fitness landscape.
Overall, 208 unique sequence–function pairs stemming from the evolutionary trajectories of HG3.R5 and HG3.17 as well as combinatorial variants generated via gene shuffling were used to map HG3’s fitness landscape. For each variant, the underlying sequence space is represented by a principal component analysis of the embeddings extracted from the ESM algorithm. The fitness values represent the relative activity of each variant versus HG3.R5 calculated from the activity measurements of three biological replicates under screening assay conditions. The activity data of HG3.3, HG3.7 and HG3.14 were inferred from literature values. a, Three-dimensional representation of the fitness landscape. b, Topological view of the fitness landscape showing all data points. Sequence–activity pairs derived from the shuffled libraries are highlighted as gray dots (195 variants). Sequence–activity pairs derived from the HG3.R5 trajectory are highlighted as blue dots and labeled with their alphanumerical identifiers (five variants), while sequence–activity pairs from the HG3.17 trajectory are highlighted as purple dots and labeled with their alphanumerical identifiers (four variants). Combined variants HG3.R5w17 and HG3.17wR5 are highlighted as orange dots and HG3 K50Q is highlighted as a green dot. The in silico designed HG3 is highlighted with a large gray dot. Source data
Extended Data Fig. 1
Extended Data Fig. 1. Creation of complex single-site variant libraries using oligo pools.
The gene is split into an appropriate number of fragments corresponding to the maximum length of the available oligos (200 bp in our case). For each desired single-site variant, an individual oligo is designed and later used in an overlap extension PCR with appropriate flanking regions, in this way introducing the desired mutations. In each oligo, a common flanking region (purple) is included, allowing the oligo’s initial amplification from the low-concentrated oligo pool. Another flanking region complementary to the gene (white) permits to specifically amplify oligos covering a certain gene fragment (subpool-specific amplification). Each variant gene is reassembled using an overlap extension PCR using the amplified oligo subpool in combination with gene fragments generated from appropriate upstream and downstream PCRs.
Extended Data Fig. 2
Extended Data Fig. 2. Creation of combinatorial hit libraries.
Identified beneficial mutations are encoded on customized primers. If appropriate, adjacent mutations are grouped on one primer, and degenerate codons are used to cover several amino acids at the same site reducing the overall number of required primers. Next, the gene is amplified in fragments spanning regions between mutations. Finally, an overlap extension PCR is performed to reassemble all mutagenized fragments into the final variant library.
Extended Data Fig. 3
Extended Data Fig. 3. Active site architecture of HG3 variants.
a, Schematic representation of ligand–enzyme interactions found in HG3.R5. The TSA (3) interacts via hydrogen bonds with the backbone amide of M237 as well as the side chains of Q50 (oxyanion stabilization) and D127 (catalytic base). Additionally, the nitro group of the ligand is anchored by van der Waals interactions to the side chain of W44. Of note, the TSA (3) forms a hydrogen bond to an evolutionarily acquired water in the active site of HG3.R5. b, Evolutionary optimization of the angles and distances characterizing the hydrogen-bonding interaction between D127 and the TSA (3). Values are given as the difference (∆) between the optimal angles and distances calculated for hydrogen-bonding interactions between acetamide dimers (δHA = 1.94 Å; θ = 159.4°; ψ = 112.3°) and the measured values from the binary crystal structures. In detail, measured distances and angles were obtained from all unique assemblies in the asymmetric unit cell of HG3.R5 (2 assemblies, 8RD5), HG3 (4 assemblies, 5RGA and 7K4Q) and HG3.17 (4 assemblies from 5RGE, 7K4Z and 4BS0). The data are obtained from the above-mentioned assemblies using Pymol (2.5.5) and presented as mean ± SD. ch, Cut-away view of the TSA (3) bound active site of HG3.R5 (blue, c and f), HG3 (gray, d and g) and HG3.17 (purple, e and h), highlighting the improved shape complementarity of active site and ligand in the evolved variants. Structural illustrations are adapted from the PDB (HG3: 5RGA, HG3.R5: 8RD5, HG3.17: 5RGE). Source data
Extended Data Fig. 4
Extended Data Fig. 4. Quantum mechanical calculations of the Kemp elimination catalyzed by HG3.R5.
a, Cluster model transition structures (full QM). b, Enzyme–substrate complex and transition structures (hybrid QM/MM). The TS stabilization exerted by crystallographic water we was calculated to be similar and additive to that achieved by the side chain of Q50. Note the shorter and better-oriented polar contact between the substrate and the water molecule in the TS, reflecting its contribution to oxyanion stabilization. A high degree of preorganization for catalysis was found in the X-ray structures and is reflected in the very low computed reaction barriers. The cluster QM calculated activation energies are incidentally in good agreement with the experimentally measured turnover number (kcat = 702 s−1; ΔG ≈ 13.6 kcal mol−1 at 25 °C), while the QM/MM ones are substantially lower despite using the same DFT functional and a similar basis set. In this regard, a dramatic influence of the level of theory and implicit solvation on the calculated and ΔE and ΔG was found. Hence, attention should be focused on relative rather than absolute activation barriers. Pymol (2.4.0a) was used for structural representations.
Extended Data Fig. 5
Extended Data Fig. 5. Analysis of the interaction network of mutations acquired over the evolutionary trajectory of HG3.R5.
a, Snapshot of the configuration of the active site of HG3. b, In the first round of evolution, mutations M172A and K50Q were acquired, which are in direct contact with the substrate 5-nitrobenzisoxazole (1). c, In evolution round 2, mutation Q207M complements the prior mutation M172A, while mutation Q90H allows for the formation of a π-stacking interaction with W87. d, In evolution round 3, mutation E131S allows the formation of a hydrogen bond with W87, and mutation M49L opens up space close to P45, which is observed to substantially shift position in the final variant HG3.R5. P45’s conformational change presumably leads to the binding of water in the active site, which contributes to the stabilization of the transition state. e, In evolution round 4, the acquisition of mutation L69V seems to further assist in the observed conformational change of P45. f, In the final evolution round, mutations H209N and Y174S are introduced, which further anchor M237 and S131 via an elaborate water network.
Extended Data Fig. 6
Extended Data Fig. 6. MD simulations of HG3 and its variants.
Each variant was simulated 5 times with the substrate 5-nitrobenzisoxazole (1) for 100 ns recording every 1000 steps (step size = 2.0 fs), resulting in a total of 250000 data points per variant. a, Root-mean-squared fluctuation difference against HG3. Mutations acquired during the evolution are denoted by green markers, while the catalytically active D127 and the K50Q mutations are highlighted by outlined spheres. Three distinct regions exhibiting heightened rigidity (21–30, 46–58 and 82–92) are emphasized with shading. In HG3.R4, a region encompassing D127 (119–127) experiences a loss of rigidity, as indicated by a gray-shaded area. Rigidity is subsequently restored in HG3.R5. b, Crystal structure of HG3.R5 highlighting active site residues and the rigidifying regions (loop 1–loop 4). Loop 2 - comprising the K50Q mutation - gains rigidity compared to HG3 over the course of evolution, while loop 4 - comprising the catalytic active D127 temporarily - gains flexibility in HG3.R4. c, Contact frequencies of active site residues with the substrate 5-nitrobenzisoxazole (1). The data are shown from n = 4 (HG3.R1, HG3.R5 and HG3.17) or n = 5 (HG3, HG3.R2, HG3.R3 and HG3.R4) simulations and presented as mean ± SD. Source data

Similar articles

Cited by

References

    1. Tracewell, C. A. & Arnold, F. H. Directed enzyme evolution: climbing fitness peaks one amino acid at a time. Curr. Opin. Chem. Biol.13, 3–9 (2009). - PMC - PubMed
    1. Maynard Smith, J. Natural selection and the concept of a protein space. Nature225, 563–564 (1970). - PubMed
    1. Romero, P. A. & Arnold, F. H. Exploring protein fitness landscapes by directed evolution. Nat. Rev. Mol. Cell Biol.10, 866–876 (2009). - PMC - PubMed
    1. Aharoni, A. et al. The ‘evolvability’ of promiscuous protein functions. Nat. Genet.37, 73–76 (2005). - PubMed
    1. Chen, K. & Arnold, F. H. Tuning the activity of an enzyme for unusual environments: sequential random mutagenesis of subtilisin E for catalysis in dimethylformamide. Proc. Natl Acad. Sci. USA90, 5618–5622 (1993). - PMC - PubMed

Publication types

LinkOut - more resources