. 2024 Oct;5(10):1494-1514.
doi: 10.1038/s43018-024-00821-1. Epub 2024 Sep 11.

ISB 2001 trispecific T cell engager shows strong tumor cytotoxicity and overcomes immune escape mechanisms of multiple myeloma cells

Affiliations

ISB 2001 trispecific T cell engager shows strong tumor cytotoxicity and overcomes immune escape mechanisms of multiple myeloma cells

Laura Carretero-Iglesia et al. Nat Cancer. 2024 Oct.

Abstract

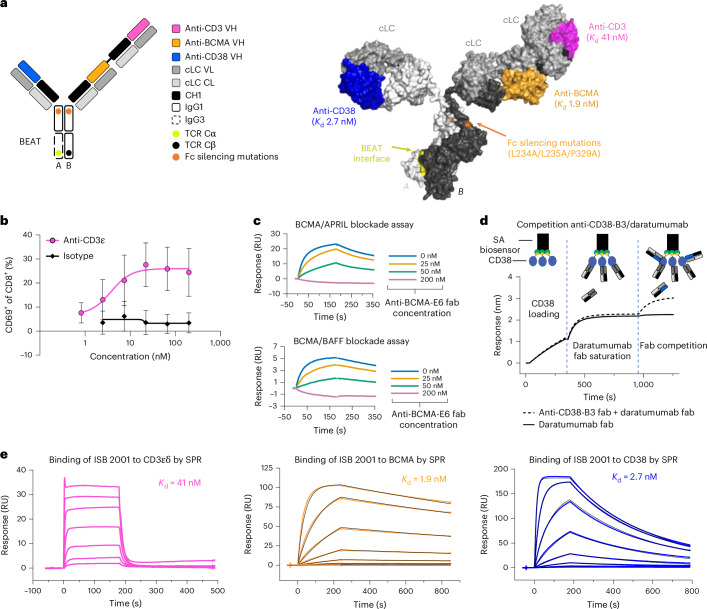
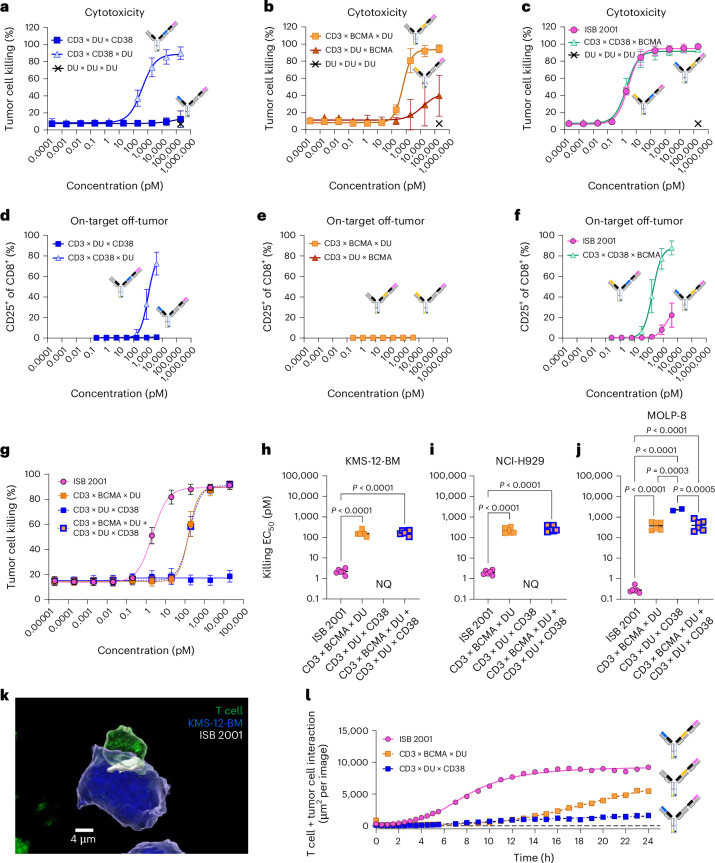
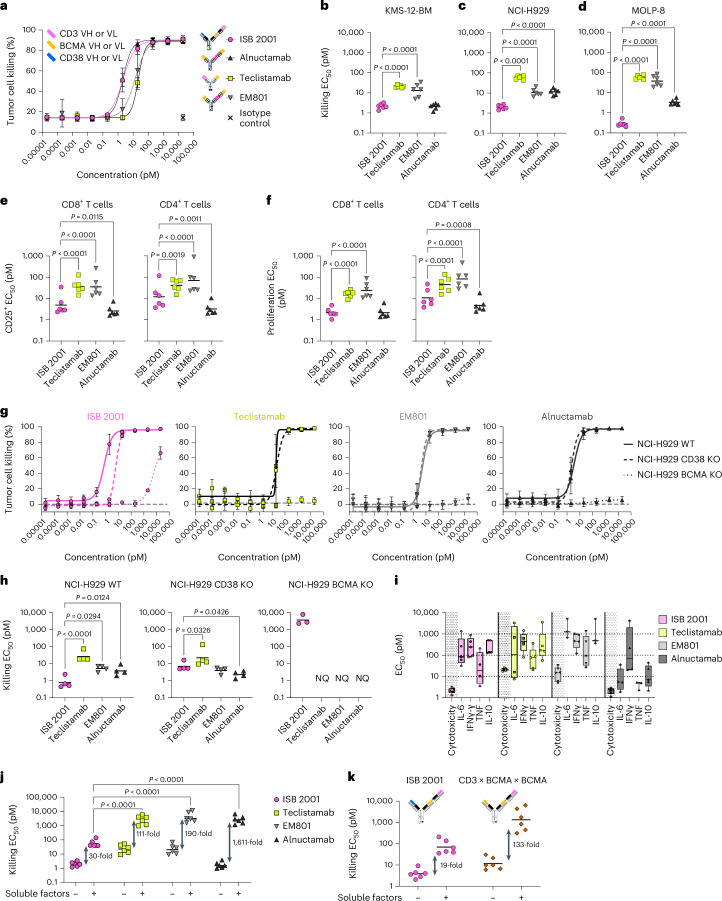
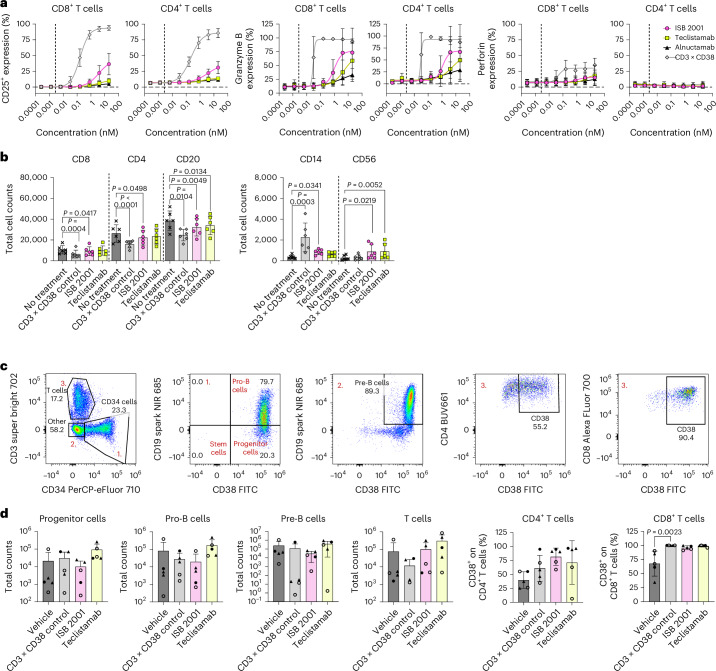
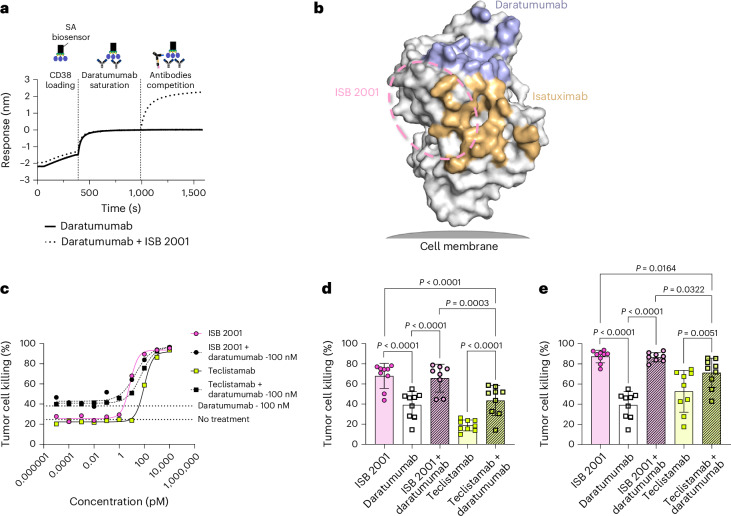
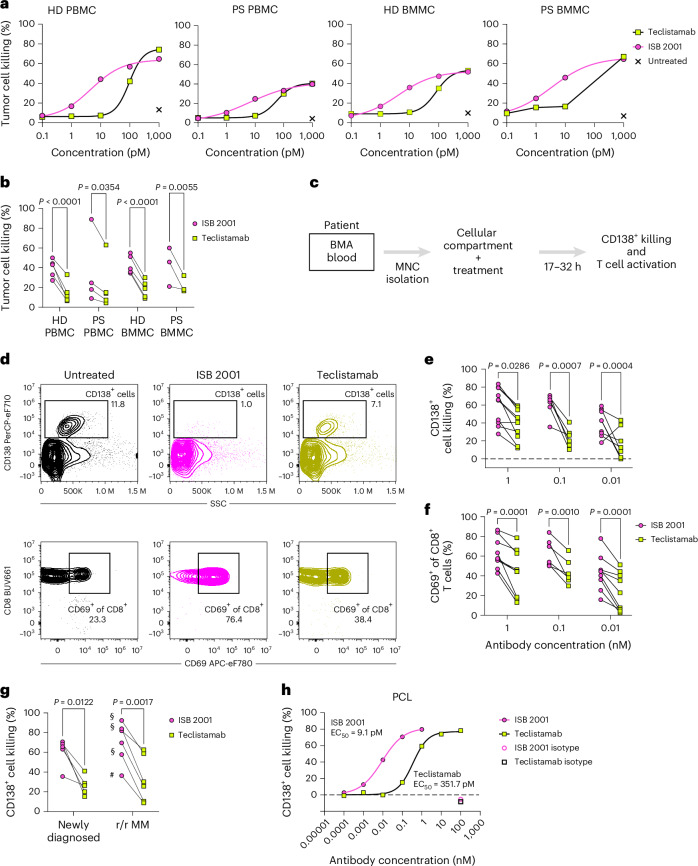
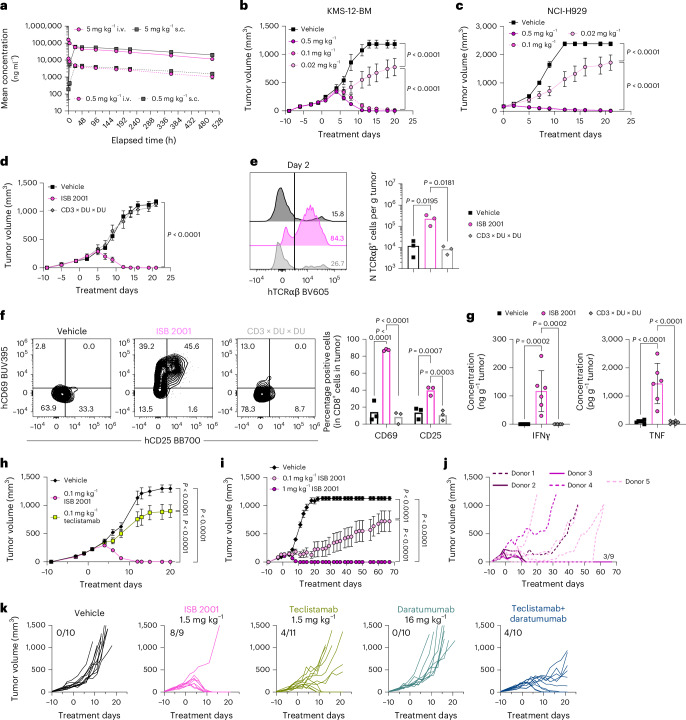
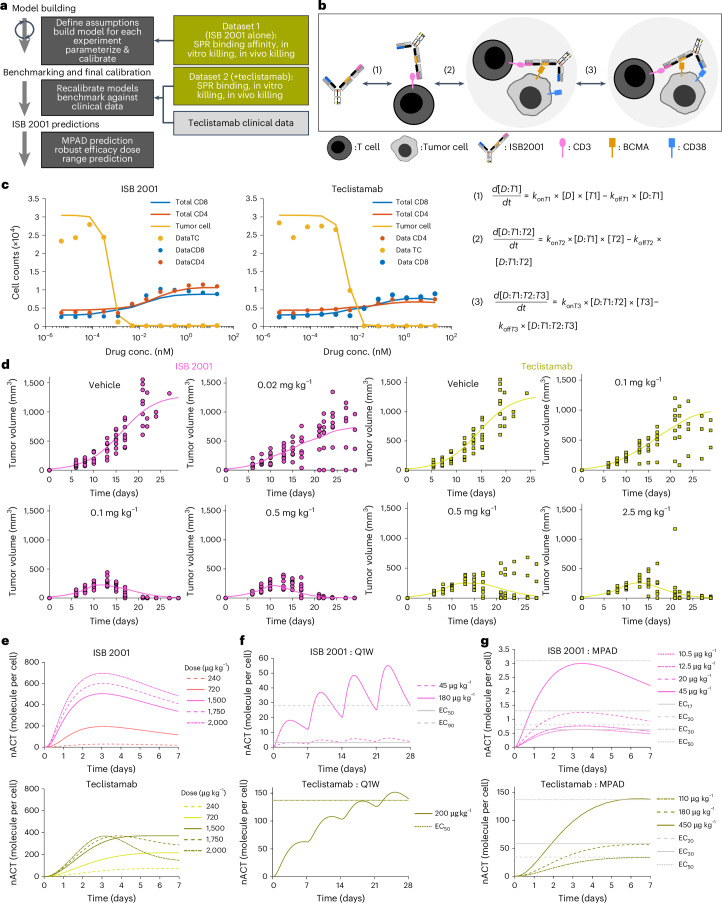
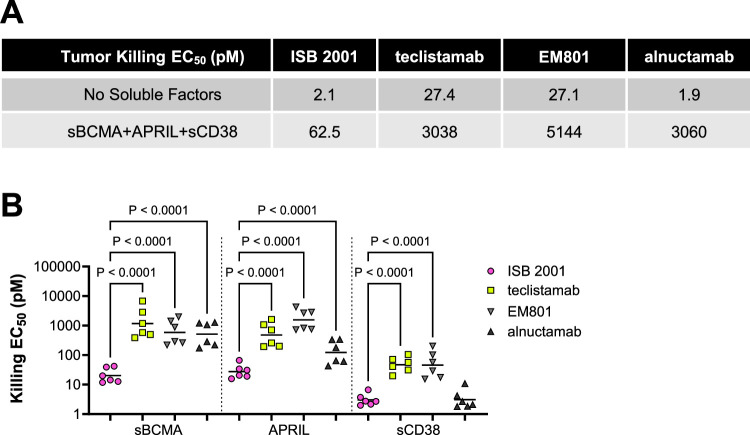
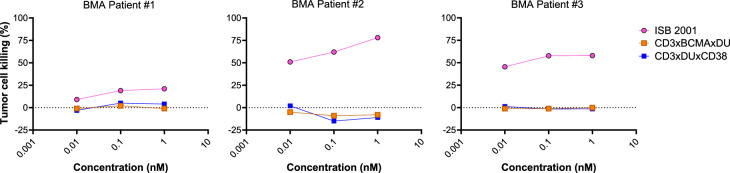
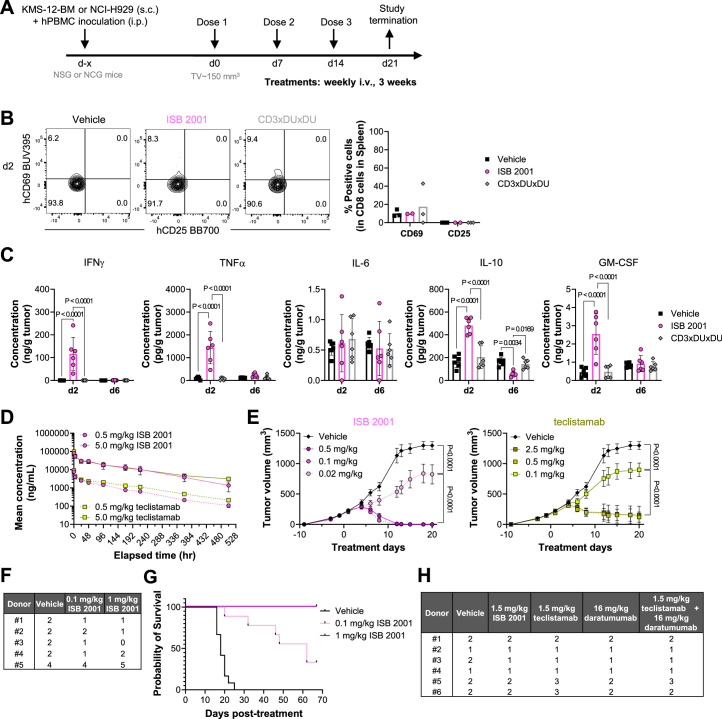
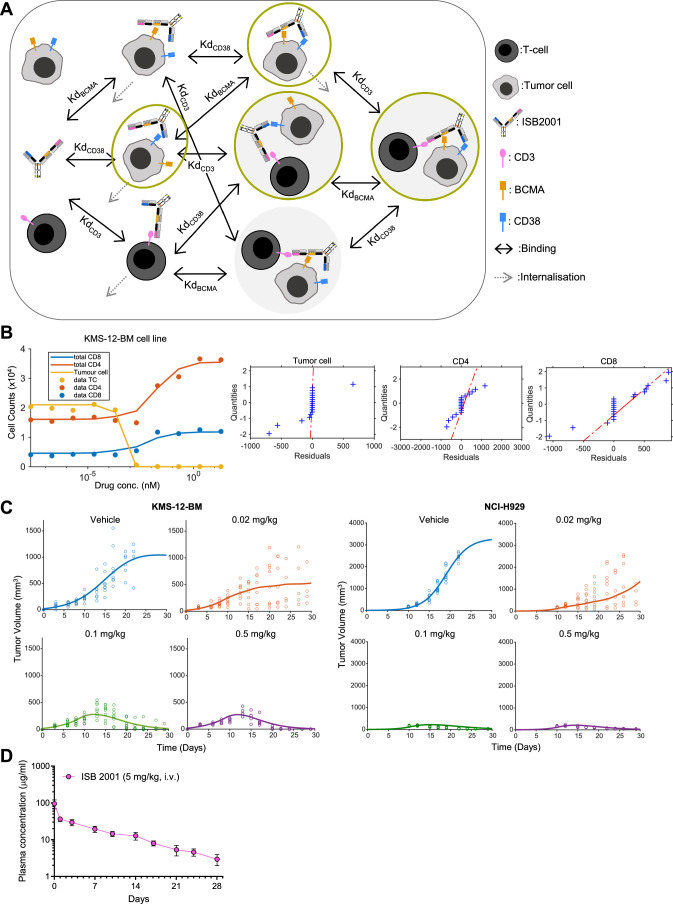
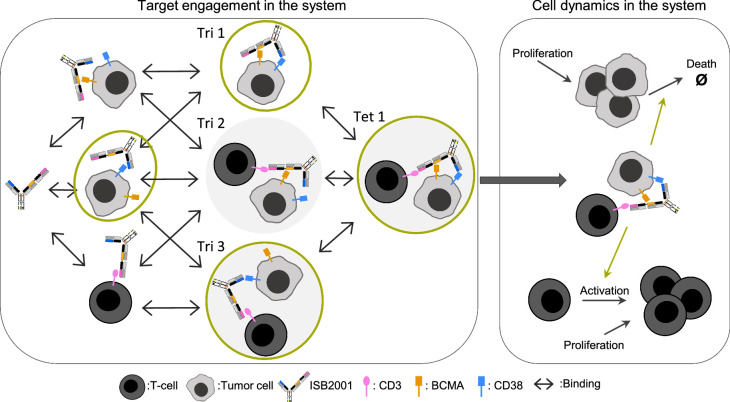
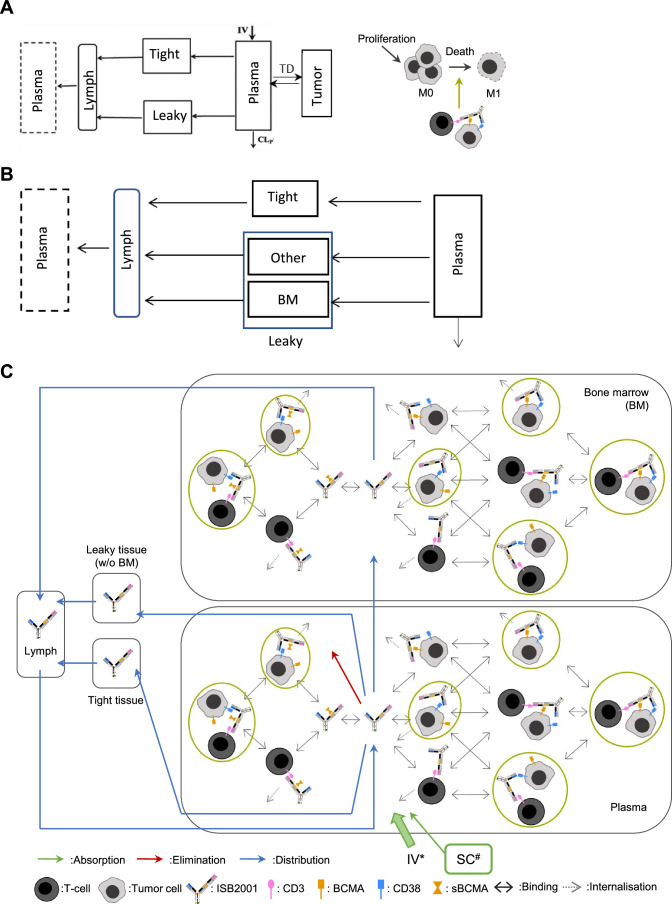
Despite recent advances in immunotherapies targeting single tumor-associated antigens, patients with multiple myeloma eventually relapse. ISB 2001 is a CD3+ T cell engager (TCE) co-targeting BCMA and CD38 designed to improve cytotoxicity against multiple myeloma. Targeting of two tumor-associated antigens by a single TCE resulted in superior cytotoxic potency across a variable range of BCMA and CD38 tumor expression profiles mimicking natural tumor heterogeneity, improved resistance to competing soluble factors and exhibited superior cytotoxic potency on patient-derived samples and in mouse models. Despite the broad expression of CD38 across human tissues, ISB 2001 demonstrated a reduced T cell activation profile in the absence of tumor cells when compared to TCEs targeting CD38 only. To determine an optimal first-in-human dose for the ongoing clinical trial ( NCT05862012 ), we developed an innovative quantitative systems pharmacology model leveraging preclinical data, using a minimum pharmacologically active dose approach, therefore reducing patient exposure to subefficacious doses of therapies.


Conflict of interest statement

L.C.-I., O.J.H., J.B., D.P., A.D., C.E., C.D., T. Monney, J.M., M.C., J.L., C.P., V.M., A.L., I.G., L.N.C., G.S.G., S.B., M.L.M., R.C.-W., A.S., M.D., E.A.Z., C.K., M. Perro and M. Pihlgren are employees or former employees of Ichnos Sciences or Ichnos Glenmark Innovation. T. Matsuura and P.H.v.d.G. are employees of Certara UK. P. Moreau is a member of the scientific advisory board of Ichnos Glenmark Innovation. T. Matthes, Z.K., C.M.E., J.R.E., S.M., C.P.-D. and C.T. declare no competing interests.

Figures

Fig. 1
Fig. 1. Generation of ISB 2001, a CD3 × BCMA× CD38 trispecific antibody based on the BEAT platform.
a, Cartoon and structural model of ISB 2001 BEAT. On the cartoon, immunoglobulin domains are shown as rectangles. VH domains of the anti-CD38, anti-BCMA and anti-CD3ε binders are depicted in blue, orange and magenta, respectively. All binders make use of a cLC depicted in gray. Fc-silencing mutations are depicted by the orange dots. The BEAT interface shown in the CH3 domains is depicted by the green and black dots. Chain A encompasses an engineered human IgG1 CH2 domain with an engineered human IgG3 CH3 domain. Chain B has engineered human IgG1 CH2 and CH3 domains. CHx, constant domain x; TCR Cα or TCR Cβ, BEAT interface proprietary mutations based on the T cell receptor constant domain α or β, respectively. ISB 2001 BEAT was generated by homology modeling. b, Human T cell activation of anti-CD3ε produced as human IgG1 LALA and control isotype by incubating with a dose–response of the cLC Fab bound to the plate. Graph shows mean ± s.d. (n = 6 independent T cell donors from two independent experiments). c, SPR sensorgrams from a single replicate show blockade of BCMA/APRIL interaction (top sensorgram) and blockade of BCMA/BAFF interaction (bottom sensorgram) upon binding of anti-BCMA-E6 Fab to recombinant human BCMA protein. Curves are colored by anti-BCMA-E6 Fab concentration in BCMA/anti-BCMA premix solution. Data provided are from a single experiment (no repeats). d, Competition binding assay by Octet BLI. Curves represent injection of anti-CD38-B3 Fab/daratumumab Fab premix (dashed line) or daratumumab at twofold concentration of saturating solution (solid line) over CD38 immobilized surface saturated with daratumumab Fab from a single replicate in one experiment (no repeats). e, Binding sensorgrams of respective representative measurements from three independent replicates show the binding of ISB 2001 to human CD3εδ, human BCMA and human CD38 by SPR. Colored curves represent single concentration injections with serial dilutions of 1:3. Black curves represent 1:1 kinetic fits (BCMA and CD38). For binding to CD3εδ, the Kd was inferred from a steady-state affinity model. Source data
Fig. 2
Fig. 2. ISB 2001 optimized architecture and avidity binding increases killing and accelerates synapse formation.
ac, Cytotoxicity of KMS-12-BM cells at different concentrations of CD3 ×DU × CD38 and CD3 × CD38 × DU (a), CD3 × BCMA × DU and CD3 × DU × BCMA (b) and ISB 2001 and CD3 × CD38 × BCMA (c). RDL assays were performed at a 5:1 effector to target ratio for 48 h with purified T cells. Graphs show four-parameter logistic curve fitting with symbols representing mean ± s.d. (n = 6 independent T cell donors from two independent experiments). df, T cell activation in a HD-PBMC at different concentrations of CD3 × DU × CD38 and CD3 × CD38 × DU (d), CD3 × BCMA × DU and CD3 × DU × BCMA (e) and ISB 2001 and CD3 × CD38 × BCMA (f). Graphs show four-parameter logistic curve fitting with symbols representing mean ± s.d. (n = 6 independent T cell donors from two independent experiments). g, Cytotoxicity of the KMS-12-BM cell line at different concentrations of ISB 2001, CD3 × BCMA × DU, CD3 × DU × CD38 and the combination of CD3 × BCMA × DU and CD3 × DU × CD38. Graphs show four-parameter logistic curve fitting with symbols representing mean ± s.d. (n = 6 independent T cell donors from three independent experiments). hj, EC50 values for cytotoxicity on KMS-12-BM (h), NCI-H929 (i) and MOLP-8 (j). log10(EC50) (n = 6 independent T cell donors from three independent experiments; EC50 values for CD3 × DU × CD38 were not quantifiable except for n = 2 on MOLP-8) were compared using repeated measure ANOVA followed by Tukey’s multiple comparison in hj. k, Representative confocal image (from three independent experiments) of ISB 2001 (white) and the synapse between a T cell (green) and a KMS-12-BM cell (blue), acquired with a Zeiss LSM 800 inverted confocal microscope, magnification ×40. l, Quantification of T cell and KMS-12-BM tumor cell interaction over time using Incucyte live imaging for ISB 2001, CD3 × BCMA × DU and CD3 × DU × CD38. Quantification of T cell and tumor interaction using Incucyte. Graph shows mean of n = 6 (ISB 2001) or 5 (CD3 × BCMA × DU and CD3 × DU × CD38) technical replicates from two independent experiments. Statistical differences from post-hoc comparison are shown in the graphs as exact P value when statistically significant (P < 0.05). NQ, not quantifiable. WT, wild-type. Source data
Fig. 3
Fig. 3. Dual targeting of BCMA and CD38 by ISB 2001 allows efficient tumor cell killing, even in the presence of sBCMA, APRIL and sCD38.
ad, Cytotoxicity of the KMS-12-BM at different concentrations of ISB 2001, teclistamab, alnuctamab and EM801 (a) and EC50 values for cytotoxicity of KMS-12-BM (b), NCI-H929 (c) and MOLP-8 cell lines (d). Graph in a shows four-parameter logistic curve fitting with symbols representing mean ± s.d. of six independent donors. log10(EC50) (n = 6 independent T cell donors from three independent experiments) were compared using repeated measure ANOVA model and Dunnett’s comparison in bd. e,f, CD8+ T cell activation (e) and proliferation (f) after treatment in an RDL assay against KMS-12-BM. log10(EC50) (n = 6 independent T cell donors from two independent experiments) were compared using repeated measure ANOVA model and Dunnett’s comparison. g,h, ISB 2001, teclistamab, alnuctamab and EM801 killing curves (g) and EC50 values for cytotoxicity (h) of NCI-H929 WT, CD38−/− and BCMA−/− cell lines. log10(EC50) (n = 4 independent T cell donors (before acceptance criteria exclusion) from two independent experiments) were compared using repeated measure ANOVA model and Dunnett’s comparison to ISB 2001. Graphs in g show four-parameter logistic curve fitting with symbols representing mean ± s.d. (n = 4 independent T cell donors). i, EC50 of cytotoxicity, IL-6, IFNγ, TNF and IL-10 release in an RDL assay against KMS-12-BM. Boxplots show 25th to 75th percentile and whiskers minimum and maximum values of n = 6 donors from two independent experiments. j,k, Cytotoxicity in presence (+) or absence (−) of soluble factors after treatment with ISB 2001, teclistamab, alnuctamab and EM801 (j) or ISB 2001 and CD3 × BCMA × BCMA molecule (k) in an RDL assay. log10(EC50) (n = 6 independent PBMC donors from two experiments) were compared using two-way ANOVA and Tukey’s multiple comparisons in k (only differences between ISB 2001 and TCEs with soluble factors are shown). RDL assays were performed at a 5:1 effector to target ratio with purified T cells or PBMCs with six donors for 48 or 72 h. Statistical differences from post-hoc comparison are shown in the graphs as exact P value when statistically significant (P < 0.05). NQ, not quantifiable. Source data
Fig. 4
Fig. 4. ISB 2001 has a tolerability profile comparable to teclistamab both in vitro and in vivo.
a, T cell activation and cytolytic molecules secretion in HD-PBMC assay treated with ISB 2001, teclistamab, alnuctamab and CD3 × CD38 control. Percentage of CD25+ (left), granzyme B (middle) and perforin (right) of CD8+ and CD4+ T cells are shown in a four-parameter logistic curve fitting with symbols representing mean ± s.d. (n = 6 independent PBMC donors from two independent experiments for CD25+; n = 3 independent PBMC donors from two independent experiments for granzyme B and perforin). Dashed line represents the EC90 of ISB 2001 killing potency in RDL assay on KMS-12-BM. b, PBMC counts in HD-PBMC assay treated with 1 nM of ISB 2001, teclistamab, alnuctamab and CD3 × CD38 control. Total counts of CD8+, CD4+ and CD20+ (left) and total counts of CD14+ and CD56+ from live cells (right). Cell counts were compared using RM ANOVA (CD4+ and CD20+) or Friedman test (CD8+ and CD56+), when donor pairing was effective or Kruskal–Wallis (CD14+) test when it was not. Multiple comparisons were performed using Tukey (following RM ANOVA) or Dunn’s multiple comparisons (following Friedman or Kruskal–Wallis). Bars represent the mean and error bars the s.d. (n = 6 independent PBMC donors from two independent experiments). c,d, Quantification of CD38-expressing cells (progenitors, B cell committed progenitors and mature T cells) in the bone marrow of HIS-NXG mice 3 days after treatment with 1.5 mg kg−1 ISB 2001, teclistamab, CD3 × CD38 control or vehicle control (n = 5 bone marrow samples from independent mice from one experiment). Gating of cell populations used for the plots in d from one vehicle mouse (c). Red numbers located in the top left corner of the last four dot plots refer to the gated populations shown in the first dot plot. Plots summarizing the total count and percentage of CD38+ cells of the indicated populations in the bone marrow (d). Mice reconstituted with different CD34+ donor cells are represented with different symbols; bars represent the mean and error bars the s.d. (n = 5 bone-marrow samples from independent mice from one experiment). Samples were compared using Friedman test or one-way ANOVA (only for CD4+ T cells) followed by a Dunn’s multiple comparisons. Differences are shown in the graphs as exact P value when statistically significant (P < 0.05). Source data
Fig. 5
Fig. 5. ISB 2001 cytotoxic potency is not affected by daratumumab co-treatment and shows stronger killing potency than the combination of a BCMA TCE and daratumumab.
a, Competition binding assay by Octet BLI shows the absence of competition between ISB 2001 and daratumumab, as suggested by additive binding signal upon sequential exposure of a daratumumab-saturated CD38 sensor surface to ISB 2001 (dotted line). Saturation of the CD38 sensor surface was verified by dipping the daratumumab-saturated CD38 sensor surface into a solution of daratumumab at twofold concentration of saturation solution (solid line). Representative plot shows binding to the sensor tip as a wavelength shift (response) versus time (n = 2 independent measurements). b, Surface representation of CD38 illustrating the hypothetical epitope bin of ISB 2001 (dashed line), as determined from epitope binning assays including daratumumab and isatuximab. The epitopes of daratumumab (PDB 7DHA) and isatuximab (PDB 4CMH) are colored blue and orange, respectively. c, Cytotoxicity of the KMS-12-BM cell line at different concentrations of ISB 2001 and teclistamab in the presence or absence of 100 nM daratumumab in a MMoAK assay. Dotted lines show the no-treatment and daratumumab at 100 nM-only conditions. Four-parameter logistic curve (c) fitting from a representative donor (n = 9 individual PBMC donors and n = 8 individual donors for ISB 2001 + daratumumab, from n = 3 independent experiments). d,e, Cytotoxicity of ISB 2001 and teclistamab at 10 pM (d) or 100 pM (e) daratumumab (at 100 nM) and a combination of ISB 2001 or teclistamab (at 10 and 100 pM, respectively) plus daratumumab (at 100 nM) in a MMoAK assay. Each dot represents one individual donor (n = 9 or n = 8 for ISB 2001 + daratumumab) and bars show the mean ± s.d. from four independent experiments. Means were compared using a mixed-effects model followed by a Tukey’s multiple comparison and statistical differences are shown as exact P value when statistically significant (P < 0.05). Source data
Fig. 6
Fig. 6. ISB 2001 maintains potency to kill primary tumor cells from patients with MM.
a,b, Representative curves of cytotoxicity of KMS-12-BM cell line at different concentrations of ISB 2001 and teclistamab by T cells isolated from HD- or PS-PBMCs (n = 5 and n = 2, respectively) or BMA (n = 5 and n = 2 donors, respectively) (a) and cytotoxicity at 10 pM (b). Percentage of cytotoxicity of n = 3 (PS-BMMC donors) or n = 5 (HD- and PS-PBMC and HD-BMMC donors, before acceptance criteria application) from n = 5 independent experiments were compared using REML followed by Šidák’s multiple comparison for each population of T cells. c, Experimental setup schema to assess ISB 2001 and teclistamab cytotoxic capacity of CD138+ tumor cells in BMA and T cell activation. d, Representative dot plots of CD138+ cell killing (top) and CD69+ of CD8+ T cells (bottom). e,f, Cytotoxicity of CD138+ tumor cells (e) or T cell activation (CD69+) (f) on samples from patients with MM treated with ISB 2001 or teclistamab at 0.01 (n = 10 PS for cytotoxicity and n = 9 PS for T cell activation), 0.1 (n = 6 PS for cytotoxicity and T cell activation) and 1 nM (n = 10 PS for cytotoxicity and n = 9 PS for T cell activation). CD138+ cell killing and T cell activation were compared using REML followed by Šidák’s multiple comparison for each concentration. g, Cytotoxicity of CD138+ tumor cells on samples from newly diagnosed (left, n = 4 PS) or patients with r/r MM (right, n = 6 PS), treated with ISB 2001 or teclistamab at 0.1 nM. Graph shows dots for individual samples. Previous treatments are stated in the graph as § for anti-CD38-treated or # for anti-BCMA-treated PS. Percentage of CD138+ cell killing was compared using a Holm–Šidák’s multiple two-sided paired t-test. h, Cytotoxicity curve of CD138+ MM cells by ISB 2001, teclistamab and isotype controls at 20 h in a sample from PCL (n = 1 PS). Graph shows four-parameter logistic curve fitting and symbols represent the mean of replicates (n = 2 replicates for ISB 2001 and teclistamab and n = 4 replicates for isotype controls). PCL, plasma cell leukemia. Statistical differences are shown in graphs as exact P value when statistically significant (P < 0.05). Source data
Fig. 7
Fig. 7. ISB 2001 shows superior antitumor activity to BCMA TCE benchmarks in xenograft mouse models.
a, ISB 2001 plasma concentration over time in NCG mice following single i.v. and s.c. injection (n = 4 mice per group). bd, NSG or NCG mice were engrafted s.c. with KMS-12-BM or NCI-H929 cells, respectively and inoculated i.p. with PBMCs. Tumor volume is shown following treatment of KMS-12-BM (n = 8 mice per group, except vehicle n = 7) (b) or NCI-H929 (n = 9 mice per group) with ISB 2001 (c) and following treatment of KMS-12-BM with ISB 2001 or CD3 × DU × DU at 0.5 mg kg−1 (n = 8 mice per group) (d). Mean ± s.e.m. are shown. Tumor volumes were compared using two-way ANOVA with Tukey’s multiple comparisons in bd. e,f, KMS-12-BM tumors were analyzed ex vivo 2 days after treatments (n = 3 mice/group). Expression of human TCRαβ in human CD45+ cells and number of TCRαβ cells per gram of tumor (bars represent the mean and samples were compared using one-way ANOVA followed by Tukey’s multiple comparisons) (e). Contour plots show the expression of human CD69 versus human CD25 in tumor infiltrating CD8+ T cells and graphs show the percentage of both markers in CD8+ T cells (bars represent the mean and samples were compared using two-way ANOVA followed by uncorrected Fisher’s LSD multiple comparisons) (f). g, Concentration of cytokines in NCI-H929 tumor supernatant (n = 6 mice per group, bars represent the mean ± s.d. and samples were compared using one-way ANOVA followed by uncorrected Fisher’s LSD multiple comparisons). hk, KMS-12-BM tumor volume following treatment in NSG tumor-bearing mice inoculated with PBMCs from healthy human donors (n = 8 mice per group, except for teclistamab where n = 7) (h) and HIS-NXG mice (n = 9 mice per group, except for vehicle where n = 12) pretreated with 200 mg kg−1 of IVIG (ik). Mean ± s.e.m. are shown (h,i). Tumor volumes were compared using a two-way ANOVA with Tukey’s multiple comparisons. Tumor growth of individual mice shown in i (0.1 mg kg−1 ISB 2001 group) (j). Tumor growth of individual mice upon treatment with the indicated molecules (k). Each line represents an individual mouse (j,k). Number of mice rejecting the tumor is indicated on the graphs. Statistical differences are shown in graphs as exact P value when statistically significant (P < 0.05). Source data
Fig. 8
Fig. 8. Human QSP modeling.
a, Workflow for developing QSP model. b, Simplified binding schematic with accompanying equations below, where [D] is ISB 2001 concentration; [T1], [T2] and [T3] are the concentrations of free CD3, BCMA and CD38; [D:T1] is a concentration of dimer complex of ISB 2001-CD3; [D:T1:T2] is a concentration of trimer complex of ISB 2001–CD3–BCMA; [D:T1:T2:T3] is a concentration of tetramer complex of ISB 2001–CD3–BCMA–CD38; konT1, konT2 and konT3 are the association rate constants for CD3, BCMA and CD38, respectively; and koffT1, koffT2 and koffT3 are the dissociation rate constants for CD3, BCMA and CD38, respectively. c,d, Goodness-of-fit plots for ISB 2001 and teclistamab dose–response data in vitro and in vivo post-calibration of killing models. RSE for in vitro (CD8, CD4 and tumor) ISB 2001 (30%, 29% and 12%) and teclistamab (20%, 33% and 10%). RSE in vivo ISB 2001 4.7% teclistamab 9.9%. Symbols represent individual experimental data points (tumor, CD4+ T and CD8+ T cell counts for n = 1 representative donor out of 6 (c) and tumor volume for n = 8 mice per group (d)). Lines show model simulations. e, nACT plots showing maximum nACT for a range of doses. f, Repeated dose nACT levels reach the EC50 and EC90 thresholds (ISB 2001) and EC50 threshold for teclistamab. g, MPAD predictions for ISB 2001 and teclistamab. All RSE values are calculated at the EC50 of the effect modeled. Graphs in eg show model predictions of nACT levels in simulated patients. Source data
Extended Data Fig. 1
Extended Data Fig. 1. Target binding properties of ISB 2001, alnuctamab, teclistamab and EM801, and biophysical characterization of ISB 2001.
(a) Curves representing the binding of ISB 2001 to CD38neg T cells compared to teclistamab, EM801 and alnuctamab (n = 6 T cell donors for ISB 2001 and EM801 and n = 5 for teclistamab and alnuctamab performed in 2 independent experiments). Symbols represent the mean ± SD. (b-c) Quantification of the maximum binding (RFI) (b) and KD (nM) (c) to T cells (n = 6 T cell donors for ISB 2001 and n = 5 T cell donors for teclistamab and alnuctamab). Average of maximal binding or Log10(KD) was compared using repeated measure ANOVA and Dunnett’s multiple comparisons to ISB 2001. Statistical differences are shown in the graphs when significant (P < 0.05). (d) Size-Exclusion chromatography profiles of ISB 2001. ISB 2001 eluted mainly as a monodisperse sample (main peak=99.7%) with a retention time of 7.35 min. (e) Non-reducing capillary Gel Electrophoresis (cGE (NR)). ISB 2001 accounts for 88.1% of the total species detected. Traces of disulfide bond variants, with one (4%) or two (3.6%) reduced interchain disulfide bonds was observed. The other species detected at smaller molecular weights (ranging from 0.5 to 2% of the total of the species detected), likely arise from artefactual degradation of the molecule in the analysis sample buffer. (f) cGE profile in reducing conditions (R) showing three main peaks corresponding to the common light chain (cLC) (37.6%), BEAT chain A (BTA) (26.0%), and BEAT chain B (BTB) (35.0%) at respectively 15.2, 19.0 and 20.8 min, and accounting for 98.6% of the total species detected. (g) Thermal stability by Differential Scanning Calorimetry (DSC) shows a first transition at 70.0 °C, corresponding to the melting of ISB 2001 CH2 and CH3 domains, and a second transition at 83.1 °C corresponding to the cooperative unfolding of the different Fabs in ISB 2001. A280=Absorbance at 280nm; AU=Absorbance Units; Tm=melting temperature; Cp=specific heat capacity. Source data
Extended Data Fig. 2
Extended Data Fig. 2. ISB 2001 Binding to Fc receptors by Surface Plasmon Resonance.
(a) Binding to the FcγR is silenced in ISB 2001. The binding of ISB 2001 to Fcγ receptors Ia, IIa, IIb, IIIa and FcRn was measured by SPR and compared to trastuzumab, a classical Fc-competent IgG1. Cartoons on top show schematic of the respective assay settings. For each receptor and molecule tested, the binding sensorgram and plot of equilibrium response versus concentration, when applicable, of a representative measurement are shown. On the binding sensorgrams, colored lines represent experimental data and black lines represent the fitted data. On the plot of equilibrium response versus concentration, colored dots represent experimental data, black curve represent fitted data and vertical blue bars represent inferred equilibrium dissociation constants (KD). For FcγRIA, IIA, IIB and IIIA no or too weak binding of ISB 2001 to Fc receptors was observed to infer a KD value. (b) Summary table of equilibrium dissociation constants (KD). Data are reported as the average of 3 independent measurements ± SD. Source data
Extended Data Fig. 3
Extended Data Fig. 3. On-target off-tumor T cell cytokine release and characterization of surface target expression on patient samples and MM cell lines.
(a-c) Quantification of cytokines and cytolytic factors (granzyme B, IFN-γ, IL-2, IL-6, IL-10, perforin and TNF-α) in a high-density PBMC assay comparing the secretion induced by (a) CD3 × DU ×CD38 and CD3 × CD38 × DU, (b) CD3 × BCMA ×DU and CD3 × DU × BCMA and (c) ISB 2001 and CD3 × CD38 × BCMA. Graphs show the maximum secretion in pg/mL. LLOD for each cytokine are the following: granzyme B = 43.4 pg/ml, IFN-γ = 13.7 pg/ml, IL-2 = 39.5 pg/ml, IL-6 = 3.4 pg/ml, IL-10 = 3 pg/ml, perforin = 9.3 pg/ml and TNF-α = 2.9 pg/ml. Each dot corresponds to a different PBMC donor (n = 6 individual PBMC donors from 3 independent experiment). Samples were compared for each cytokines using multiple paired T-Test (two-sided, using false discovery with the two-stage step-up method) and statistical differences are shown in the graphs when statistically significant (P < 0.05). LLOD=Lower limit of detection (d-e) BCMA and CD38 human antibody binding capacity (BioCytex) on three MM cell lines (KMS-12-BM, NCI-H929 and MOLP-8) and on MM tumor cells from five patients. Each dot represents one patient sample, bars the mean and error bars the SD. The staining on the cell lines were done in parallel to each patient sample. Dotted line corresponds to the mean of all patients tested (f) Representative histograms (from 5 repeats) of sABC staining for BCMA (top, orange) and CD38 (bottom, blue) on KMS-12-BM, NCI-H929 and MOLP-8 MM cell lines compared to the isotype antibody (gray). Numbers show the mean of the experiments for specific antigen binding capacity with mouse anti-BCMA and anti-CD38 antibodies followed by anti-mouse FITC-labeled secondary antibody (QIFIKIT). See Supplementary Figure 1 for gating strategy. Source data
Extended Data Fig. 4
Extended Data Fig. 4. ISB 2001 shows avidity-driven tumor cell binding, killing and synapse formation.
(a-c) Binding to MM cell lines of ISB 2001 (pink), CD3 × BCMA ×DU (orange) and CD3 ×DUxCD38 (blue). Graphs show 4-parameters logistic curve fitting using variable slope with symbols representing the mean ± SD of 3 experiments (top) and maximum binding and KD for the three molecules are shown (bottom), each dot represents one independent experiment. Log10(KD) and Max binding of 3 experiments were compared using repeated measure ANOVA model and Tukey HSD comparison. Statistical differences are shown on the graph when statistically significant (P < 0.05) (d) Curves showing the binding of ISB 2001 to NCI-H929 cell line expressing CD38 and BCMA (WT, full line), not expressing CD38 (CD38 KO, dashed line) or not expressing BCMA (BCMA KO, dotted line). Graph shows 4-parameters logistic curve fitting using variable slope with symbols representing mean ± SD (n = 3 independent experiments). (e) EC50 values for cytotoxicity of ISB 2001, CD3xDUxCD38 and CD3 × BCMAxDU on MM cell lines expressing different sABC levels of BCMA and CD38. Log10(EC50) (n = 6 individual T cell donors from 2 experiments; before exclusion based on acceptance criteria) were compared using repeated measure ANOVA or mixed-effect model (for RPMI-8226 only) followed by Tukey’s multiple comparisons test. (f) Representative images captured at 20X of Incucyte data (from 2 independent experiments) from one donor after 18 h of incubation with ISB 2001 (left), CD3 × BCMAxDU (middle) and CD3xDUxCD38 (right), at 2000 pM. Green show T cells, red KMS-12-BM and yellow the interaction between effector and target cells. (g-i) Quantification of T cell and KMS-12-BM tumor cell interaction over time using Incucyte live imaging for ISB 2001, CD3 × BCMAxDU and CD3xDUxCD38 at (g) 200 pM, (h) 20 pM and (i) 2 pM. Graphs show mean (n = 6 technical replicates performed on 2 independent experiments using 2 different T cell donors). Source data
Extended Data Fig. 5
Extended Data Fig. 5. APRIL and sBCMA decrease the killing potency of BCMA TCE and to a lesser extent the potency of ISB 2001.
(a) Table summarizing average EC50 (pM) killing values in the absence or presence of soluble factors (sBCMA, APRIL and sCD38) for ISB 2001, teclistamab, EM801 and alnuctamab in KMS-12-BM cell line. (b) EC50 killing potency of ISB 2001, teclistamab, EM801 and alnuctamab against the KMS-12-BM cell line in the presence of sBCMA, APRIL or sCD38 alone. PBMC were used as effector cells at a 5:1 ratio.Log10(EC50) (n = 6 PBMC donors from 2 experiments) were compared using repeated measure ANOVA model and Tukey HSD comparison and statistical differences are shown only to compare ISB 2001 to TCEs for each soluble factors when statistically significant (P < 0.05). Source data
Extended Data Fig. 6
Extended Data Fig. 6. ISB 2001 tumor cell killing of bone marrow aspirates is driven by the avidity effect.
Tumor cell killing of bone marrow aspirates (BMA) of ISB 2001 (pink), CD3 × BCMA ×DU (orange) and CD3 ×DU ×CD38 (blue). Graphs show three Multiple Myeloma patients performed in 3 independent experiments. Each dot represents one dose for each molecule. Source data
Extended Data Fig. 7
Extended Data Fig. 7. ISB 2001 shows superior antitumor activity to BCMA TCE benchmarks in xenograft mouse models.
(a) Schematic representation of KMS-12-BM and NCI-H929 hPBMC xenograft mouse models. (b) KMS-12-BM tumors of ISB 2001 or CD3xDUxDU (0.5 mg/kg) treated mice were analyzed ex vivo (n = 3 mice/group, except for ISB 2001 where n = 2 from 1 experiment using 2 PBMC donors). Contour plots show the expression of human CD69 vs human CD25 in splenic CD8+ T cells and graphs show the percentage of human CD69 (left) and human CD25 (right) positive CD8+ T cells in the spleen on day 2 (bars represent the mean). See Supplementary Figure 2 for gating strategy. (c) Graphs display the concentration of the indicated cytokine in the NCI-H929 tumor supernatant normalized per gram of tumor at day 2 or 6 post single dose (bars represent the mean and error bars the SD, n = 6 from 1 experiment using 2 PBMC donors). (d) NCG mice pretreated with 200 mg/kg of Intravenous Immunoglobulin (IVIG) were injected i.v. with two concentrations (0.5 or 5 mg/kg) of ISB 2001 or teclistamab and monitored for the presence of antibody in plasma at various time points. Graph depicts mean concentration ± SD (ng/mL) vs time of sample collection (n = 4 mice/group,1 experiment). (e) KMS-12-BM tumor volume (in mm3) is shown following treatment with ISB 2001 (left) or teclistamab (right) at the indicated concentrations in NSG tumor-bearing mice inoculated with PBMCs from healthy human donors and pretreated with 200 mg/kg of IVIG. Each dot represents the average of 8 mice/group (except for teclistamab at 0.5 and 0.1 mg/kg where n = 7) and error bars represent the SEM with Last Observation Carried Forward (LOCF). Differences in tumor volume were determined using a two-way ANOVA with Tukey’s multiple comparisons test and differences are shown in the graphs when statistically significant (P < 0.05). (f) Table summarizing the distribution of the CD34-reconstituted mice shown in Fig. 7i, j. (g) Graphs is depicting the survival of the mice shown in Fig. 7i, j (n = 9 mice/group, except for vehicle where n = 12 mice/group). (h) Table summarizing the distribution of the CD34-reconstituted mice shown in Fig. 7k. Source data
Extended Data Fig. 8
Extended Data Fig. 8. Human QSP modeling.
(a) Full Schematic of binding model (in vitro). Green circles show species with CD38 binding not found with teclistamab. (b) Goodness of fit plot for in vitro parameterization. RSE CD8-30%, CD4-29%, Tumor-12% Residual distribution plots for tumor, CD4 and CD8 T cells (c) Goodness of fit plot for in vivo parameterization. RSE KMS-116%, NCI-35% (d) TG32 SCID single-dose PK. (5 mg/kg). Source data
Extended Data Fig. 9
Extended Data Fig. 9. QSP schematics.
In vitro killing model with target engagement on left and cell dynamics on right. Species not produced by teclistamab due to lack of a CD38 binder are circled in green and trimers labeled Tri 1, Tri 2, Tri 3 and tetramer Tet 1. Active species (Tri 2, Tri 3, Tet 1) are shown with a light gray background.
Extended Data Fig. 10
Extended Data Fig. 10. QSP Schematics.
(a) In vivo mouse PK/PD model with PK model (left) and tumor compartment cell dynamics upon trimer formation (right). (b) Human PBPK model with specific bone marrow compartment (illustrated in blue box). (c) Human QSP model with binding dynamics in compartments. Species in green circles are not produced by teclistamab due to lack of CD38 binder.

References

    1. Ludwig, H., Durie, S. N., Meckl, A., Hinke, A. & Durie, B. Multiple myeloma incidence and mortality around the globe; interrelations between health access and quality, economic resources, and patient empowerment. Oncol. 25, e1406–e1413 (2020). - PMC - PubMed
    1. Pillarisetti, K. et al. Teclistamab is an active T cell-redirecting bispecific antibody against B-cell maturation antigen for multiple myeloma. Blood Adv.4, 4538–4549 (2020). - PMC - PubMed
    1. Usmani, S. Z. et al. Daratumumab monotherapy in patients with heavily pretreated relapsed or refractory multiple myeloma: final results from the phase 2 GEN501 and SIRIUS trials. Lancet Haematol.7, e447–e455 (2020). - PubMed
    1. Munshi, N. C. et al. Idecabtagene vicleucel in relapsed and refractory multiple myeloma. N. Engl. J. Med.384, 705–716 (2021). - PubMed
    1. Moreau, P. et al. Teclistamab in relapsed or refractory multiple myeloma. N. Engl. J. Med.387, 495–505 (2022). - PMC - PubMed

Publication types

MeSH terms

Associated data