. 2024 Oct;26(10):1700-1711.
doi: 10.1038/s41556-024-01493-w. Epub 2024 Sep 11.

The Polycomb system sustains promoters in a deep OFF state by limiting pre-initiation complex formation to counteract transcription

Affiliations

The Polycomb system sustains promoters in a deep OFF state by limiting pre-initiation complex formation to counteract transcription

Aleksander T Szczurek et al. Nat Cell Biol. 2024 Oct.

Abstract

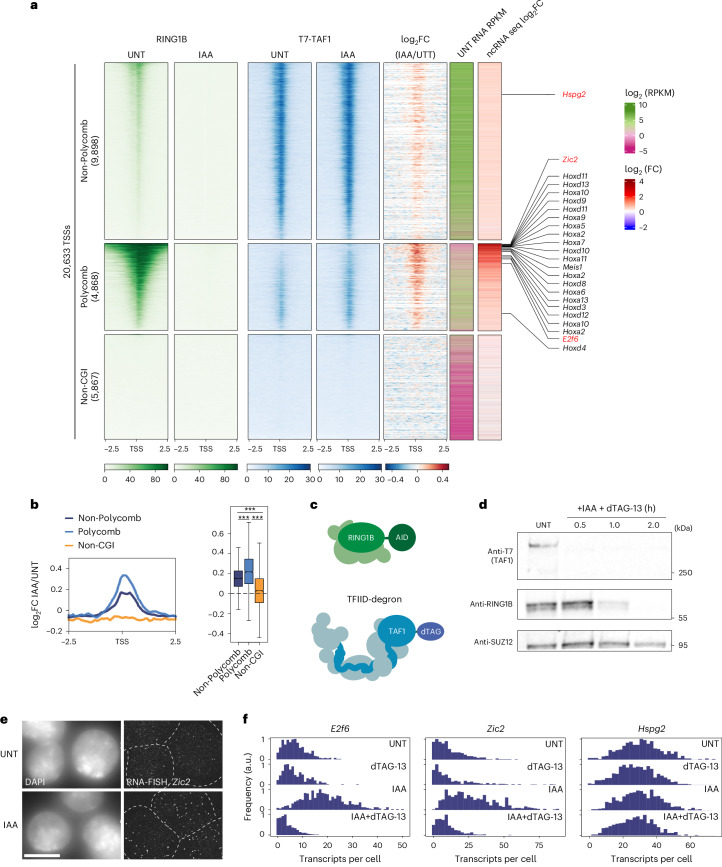
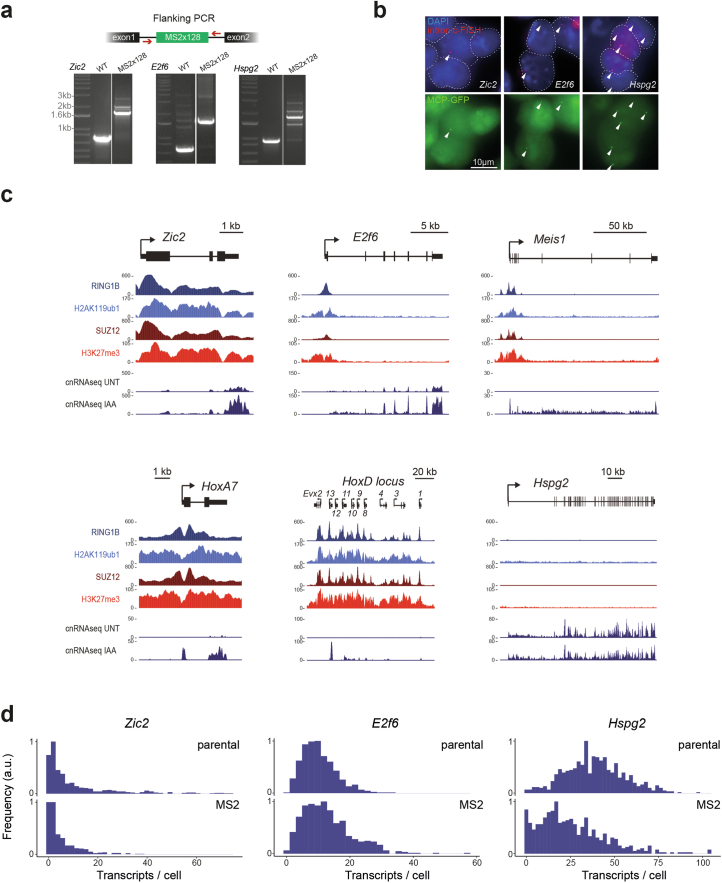
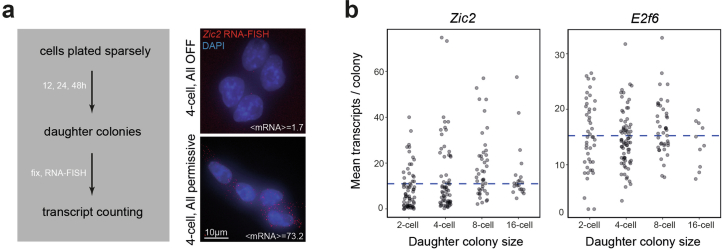
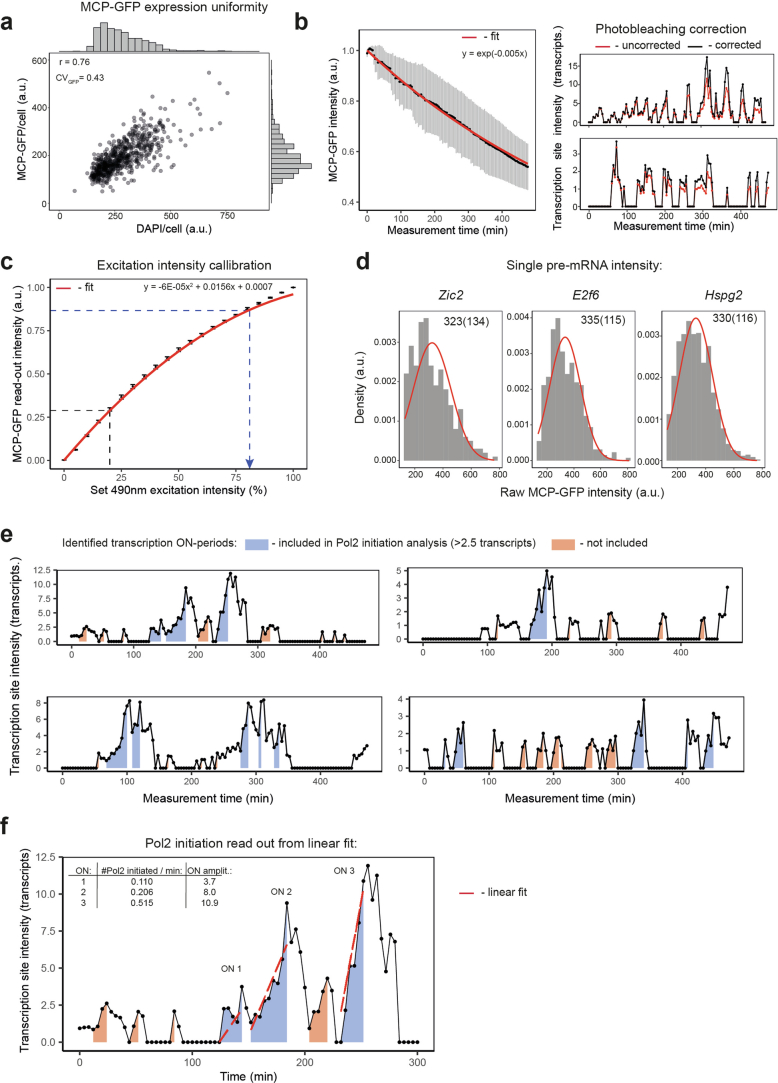
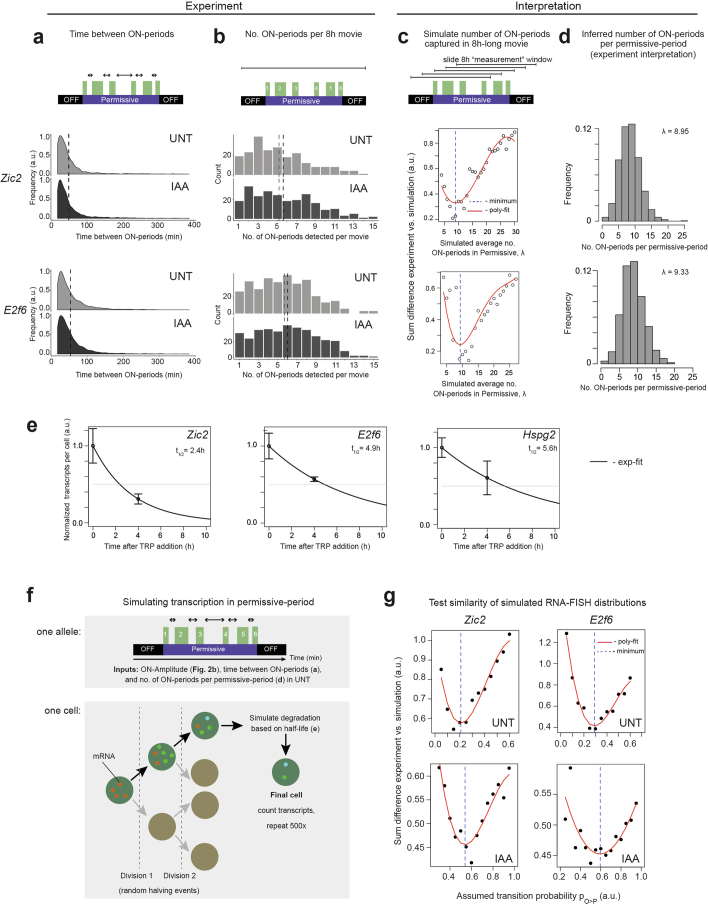
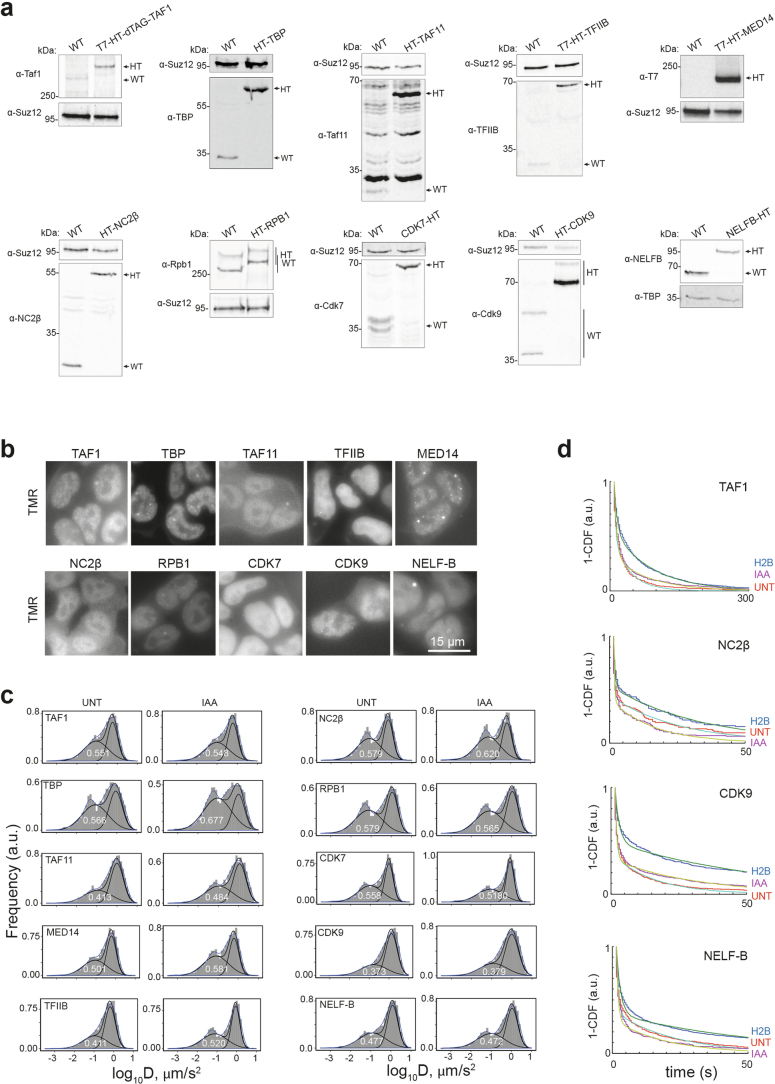
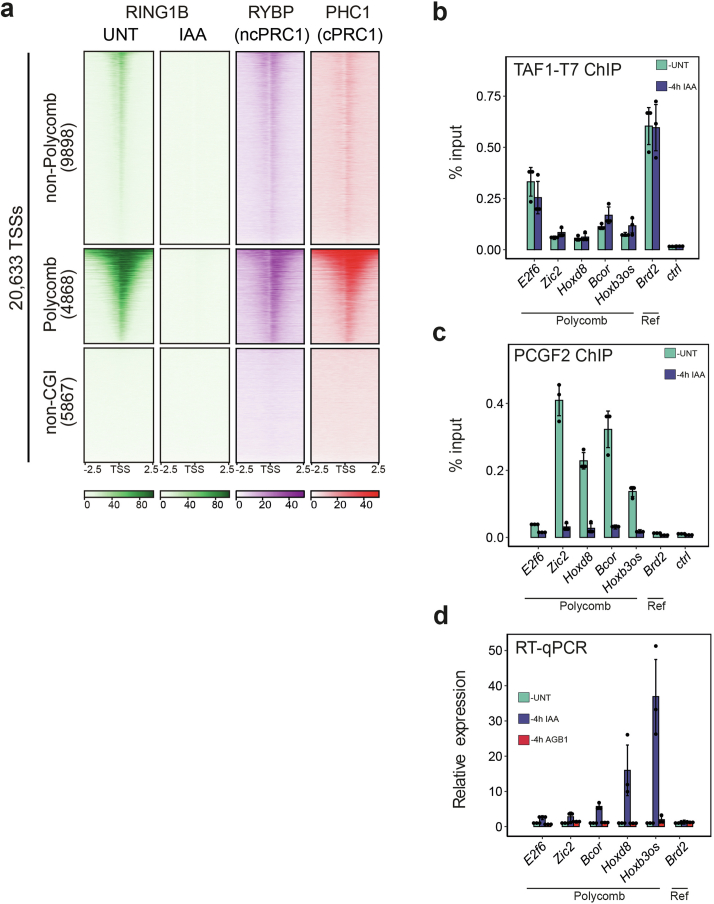
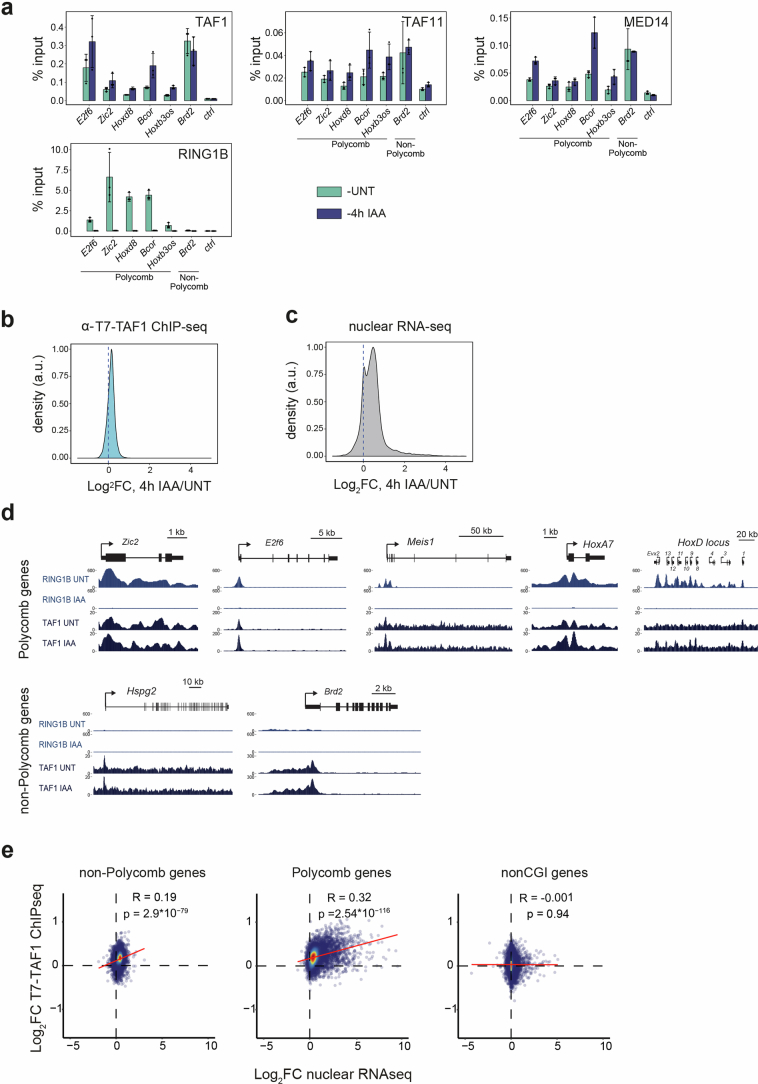
The Polycomb system has fundamental roles in regulating gene expression during mammalian development. However, how it controls transcription to enable gene repression has remained enigmatic. Here, using rapid degron-based depletion coupled with live-cell transcription imaging and single-particle tracking, we show how the Polycomb system controls transcription in single cells. We discover that the Polycomb system is not a constitutive block to transcription but instead sustains a long-lived deep promoter OFF state, which limits the frequency with which the promoter can enter into a transcribing state. We demonstrate that Polycomb sustains this deep promoter OFF state by counteracting the binding of factors that enable early transcription pre-initiation complex formation and show that this is necessary for gene repression. Together, these important discoveries provide a rationale for how the Polycomb system controls transcription and suggests a universal mechanism that could enable the Polycomb system to constrain transcription across diverse cellular contexts.


Conflict of interest statement

The authors declare no competing interests.

Figures

Fig. 1
Fig. 1. Imaging Polycomb gene transcription in live cells.
a, Top: schematic illustrating the transcription imaging approach. MS2 repeats were inserted into a promoter-proximal intron of the genes of interest. As RNA Pol II passes through the array, nascent RNA presents MS2 stem loops that are bound by MCP–GFP leading to accumulation of fluorescence signal at the active transcription site. Bottom: an example image of a cell with a nascent transcription spot corresponding to the active TSS. The white dashed lines indicate the cell outline. b, Example of a transcription activity trajectory from cells engineered to contain the MS2/MCP–GFP system (Zic2). Maximal projections of the focalized MCP–GFP signal are shown above the trajectory to illustrate the pulsatile nature of transcription. c, Example transcription activity trajectories for Polycomb genes (Zic2 and E2f6) and a reference gene (Hspg2). ON (green), permissive (violet), and OFF periods (black) are illustrated. The y axis represents transcriptional activity (in RNA molecules). Source numerical data are available in Source data. Source data
Fig. 2
Fig. 2. PRC1 does not constrain transcription during ON periods.
a, Schematic illustrating the ON-period features extracted from transcription imaging trajectories. These include the rate of RNA Pol II initiation within the ON period (from linear fit of the slope), the duration of the ON period (min) and the amplitude of the ON period (transcripts). b, Box plots centred on the median value comparing the ON-period features, with the interquartile range (IQR) demarcating the minimal and maximal values, whiskers as 1.5× IQR and outliers as dots. Individual data points correspond to individual ON periods (at least 573 measured per box plot). P values were estimated using a two-sided Kolmogorov–Smirnov. Box plots represent data from four (Zic2), three (E2f6) and two (Hspg2) biological replicates. c, Left: diagram illustrating the auxin-inducible system used to rapidly deplete the catalytic subunit of PRC1 (RING1B) in a Ring1a−/− background. Right: western blot analysis of RING1B-AID levels over a 2-h period after addition of auxin (IAA) (right) compared with a wild-type (WT) mouse ES cell line. Shown is a representative example of three independent experiments. d, smRNA-FISH analyses of E2f6, Zic2 and Hspg2 expression 4 h after PRC1 depletion. Dots represent individual biological replicates (n = 3, with >400 cells per replicate) and error bars represent the s.d. e, Schematic illustrating the approach to image transcription in live cells with (+IAA) or without (untreated, UNT) PRC1 depletion. f, Box plots (as in b) corresponding to ON-period analysis for Zic2, E2f6 (Polycomb genes) and Hspg2 (reference) in untreated and PRC1-depleted conditions. Individual data points correspond to individual ON periods (at least 599 measured per box plot). Statistical significance was calculated as in a and P values < 0.05 are shown. For Hspg2 Pol II loading, P = 0.01376; for Hspg2 amplitude, P = 4.2704 × 10−5. Box plots represent data from four (Zic2), three (E2f6) and two (Hspg2) biological replicates. Source numerical data and unprocessed blots are available in Source data. Source data
Fig. 3
Fig. 3. PRC1 sustains a deep OFF state that is refractory to transcription and counteracts gene expression.
a, Schematic illustrating the features extracted from transcription imaging trajectories for permissive-period analysis. These include the time between ON periods within permissive periods (grey arrow) and the duration of permissive periods (purple arrow). b, Box plots centred on the median value comparing the time between ON periods for E2f6, Zic2 and Hspg2 in untreated or IAA-treated (PRC1-depleted) conditions showing the IQR, which is demarcated by the minimal and maximal value, and whiskers as 1.5× IQR. At least 1,010 instances of time intervals between ON periods represent each box plot. P values represent two-sided Kolmogorov–Smirnov and P values < 0.05 are shown. Box plots represent data from four (Zic2), three (E2f6) and two (Hspg2) biological replicates. c, Box plots (as in b) comparing the duration of permissive-periods for E2f6, Zic2 and Hspg2 in untreated or IAA-treated conditions. At least 212 durations of permissive period represent each box plot. Box plots represent data from four (Zic2), three (E2f6) and two (Hspg2) biological replicates. For Hspg2, P = 1.263 × 10–4. d, Bar graphs showing the fraction of total imaging time spent in permissive periods for E2f6, Zic2 and Hspg2. Data are mean and s.d. from four (Zic2), three (E2f6) and two (Hspg2) biological replicates. For E2f6, P = 0.01756; for Zic2, P = 3.850 × 10–4. e, Heat maps illustrating transcription imaging trajectories of individual cells for E2f6, Zic2 and Hspg2 in untreated or IAA-treated conditions over the 8-h imaging time course (horizontal axis). The amplitude of transcription is illustrated in the scale bar (right) and the number of imaging time courses is indicated on the y axis. Heat maps were randomly subsampled to represent equal number of measurements in untreated and IAA-treated conditions to facilitate qualitative comparison. f, Top: schematic illustrating the simple three-state model of transcription used to simulate gene expression distributions. Bottom: histograms comparing transcript per cell distributions from smRNA-FISH in experiments (blue bars, experimental) and simulations (red bars) for Polycomb genes in untreated or IAA-treated conditions. The best-fit PO>P value for both untreated and 4 h IAA-treated conditions are indicated. Source numerical data are available in Source data. Source data
Fig. 4
Fig. 4. PRC1 counteracts binding of early PIC-forming components.
a, An example of individually colour-coded single-molecule tracks acquired at high frame rate (left). These tracks are used for kinetic modelling in SPOT-ON to obtain bound fractions. b, An example frame from stable binding time measurements acquired at low frame rate with stably bound molecules indicated with arrow heads. Stable binding times for the protein of interest (POI) are extracted from bi-exponential fits (dotted lines) from cumulative distributions (solid lines) and corrected for photobleaching using estimates of stable binding of histone H2B-HT (blue). c, A cartoon illustrating stages of PIC assembly and transcription regulation. Protein factors studied by SPT are indicated. d, Dot plots illustrating the bound fractions (top) and stable binding time (bottom) for a panel of transcription regulators in untreated or PRC1-depleted (IAA-treated) conditions. Individually colour-coded dots represent values for individual biological replicates and are connected with grey lines, error bars represent s.d. and horizontal lines show the mean value. A minimum of three biological replicates were measured with approximately 100 cells per replicate for bound fraction analysis and approximately 20 cells for stable binding time measurements per biological replicate. P values were determined by one-sided paired t-tests and are presented whenever data reach statistical significance (P < 0.05). Bound fraction: TBP, P = 0.012903; TAF11, P = 0.01352; MED14, P = 0.032109; stable binding time: TBP, P = 0.010049; TAF1, P = 0.006401; TAF11, P = 0.040219; NC2β, P = 0.024727; TFIIB, P = 0.025326; MED14, P = 0.041231; CDK9, P = 0.023027; NELF-B, P = 0.024577. e, Scatter plot integrating the effects on bound fraction and stable biding times measured in SPT. Dots correspond to the mean fold change (FC) values for individual proteins and the error bars correspond to s.e.m. The data represents at least three biological replicates as indicated in d. Solid grey vertical and horizontal lines correspond to 1 (no change). Source numerical data are available in Source data. Source data
Fig. 5
Fig. 5. cPRC1 complexes do not regulate stable PIC binding nor contribute centrally to Polycomb repression.
a, A cartoon illustrating the composition of ncPRC1 and cPRC1 complexes. b, Cartoon representation of the degron cell line in which cPRC1 complexes can be depleted and TFIID dynamics measured by examining TAF11 by SPT imaging (left). Western blot analysis illustrating depletion of cPRC1 complexes within 2 h of dTAG-13 treatment (right). BRG1 was used as a loading control. The western blot was performed once. c, Dot plots illustrating the bound fraction (left) and stable binding time (right) for HaloTag-fused TAF11 (HT-TAF11) in untreated or cPRC1-depleted (dTAG-13-treated) conditions. Individually colour-coded dots represent values for individual biological replicates (n = 4) and are connected with grey lines, error bars represent s.d. and horizontal lines show the mean value. P values represent one-sided paired t-tests. P = 0.020877 (fraction bound); and P = 0.846956 (stable binding time). A minimum of approximately 100 cells for bound fraction analysis and approximately 20 cells for stable binding time measurements were measured per biological replicate (indicated as colour-coded dots). d, As in b except PCGF2 was tagged with bromoTAG (bTAG). Western blot analysis demonstrates PCGF2-bTAG degradation after 2 h of AGB1 treatment. This experiment was performed once. e, smRNA-FISH analysis of transcript-per-cell distributions for untreated cells, cells with PCGF2-bTAG depleted (AGB1-treated), and cells with RING1B-AID depleted (IAA-treated). Depletions were performed for 4 h and at least 400 cells were measured for each gene in each condition. Source numerical data and unprocessed blots are available in Source data. Source data
Fig. 6
Fig. 6. PRC1 constrains TFIID binding to inhibit gene expression.
a, Heat map illustrating cChIP–seq signal for RINGB (PRC1) (green, left) or endogenously T7-tagged TAF1 (blue, right) in untreated or IAA-treated ES cells across TSSs. The distance in kilobases from left and right of TSSs is shown below each heat map. To visualize changes in T7-TAF1 signal, the log2-transformed fold change in IAA-treated versus untreated (that is, log2FC(IAA/UNT)) value is shown to the right of the T7-TAF1 cChIP–seq signal. To visualize steady-state gene expression levels and increases in gene expression after RING1B-AID depletion, RPKM (reads per kilobase per million mapped reads) values for untreated cells and log2FC(IAA/UNT) values were calculated for each corresponding gene using calibrated nuclear RNA sequencing (cnRNA-seq) data and plotted as heat maps on the right. TSSs were segregated into non-Polycomb (n = 9,899), Polycomb (n = 4,869) and non-CpG islands (n = 5,869) groupings based on the presence of non-methylated CpG island (CGI) and binding of PRC1 and PRC2 at their promoters as previously described. Heat maps are ranked by RING1B signal. Genes examined in live-cell imaging of transcription (red) as well as some classical Polycomb genes (black) are indicated. b, A meta plot (left) illustrating the log2FC(IAA/UNT) of T7-TAF1 cChIP–seq signal at the three classes of TSSs shown in a and a box plot (right) showing log2FC(IAA/UNT) of cChIP signal integrated over ±1 kb from TSSs. The boxes centred on median value show the IQR to represent minimal and maximal values, the centre lines represent the median and whiskers extend by 1.5× IQR or the most extreme point (whichever is closer to the median), whereas notches extend by 1.58× IQR/n1/2, giving a roughly 95% confidence interval for comparing medians. P values were calculated using a two-sided Wilcoxon rank sum test. ***P = 2.2 × 10–16 (non-Polycomb versus non-CGI), ***P = 6.5 × 10–132 (non-Polycomb versus Polycomb) and ***P = 2.2 × 10–16 (Polycomb versus non-CGI). c, Schematic illustrating the combinatorial degron strategy used to examine the contribution of TFIID to de-repression of Polycomb target genes after depletion of PRC1. d, Western blot analysis of the levels of RING1B-AID and dTAG-TAF1 after simultaneous addition of IAA and dTAG-13 over a 2-h time course. SUZ12 is shown as a loading control. Shown are the representative result of at least three experiments. e, A smRNA-FISH image labelling Zic2 (Polycomb target) transcripts in untreated cells or after 4 h of IAA treatment (RING1B depletion) illustrating increased transcript numbers. White dashed lines indicate cell outlines. Scale bar, 10 µm. f, smRNA-FISH analysis of transcript-per-cell distributions for untreated cells, TAF1-depleted (dTAG-13-treated) cells, RING1B-AID-depleted (IAA-treated) cells, and both RING1B- and TAF1-depleted (IAA + dTAG-13-treated) cells. Depletions were performed for 4 h and at least 400 cells were measured for each gene in each condition. Source numerical data and unprocessed blots are available in Source data. Source data
Extended Data Fig. 1
Extended Data Fig. 1. Characterisation of live-cell transcription imaging in ESCs.
(a) Validation that the MS2x128 array is appropriately inserted into the first intron of the corresponding gene. Top: a schematic illustrating the PCR screening strategy. Bottom: PCR results for Zic2, E2f6, and Hspg2. The experiment was repeated twice. (b) Images of intronic RNA-FISH (red) and focalized MCP-GFP signal (green) indicating that MCP-GFP accumulates at sites where intronic RNA sequences for Zic2, E2f6, and Hspg2 are identified. Nuclei are labelled with 4′,6-diamidino-2-phenylindole (DAPI, blue) and outlined with a dashed line. Representative of at least 10 images each. (c) Genomic cChIP-seq snapshots for Zic2, E2f6, Meis1, HoxA7, HoxD locus (Polycomb genes) and Hspg2 (non-Polycomb gene) illustrating signal for RING1B-AID, H2AK119ub1, SUZ12 and H3K27me3. cnRNA-seq signal before and after 4h RING1B-AID depletion is also shown. The data used is from Dobrinic et al.. (d) smRNA-FISH analysis of transcript-per-cell distributions for parental (MCP-GFP expressing) and MS2x128 array-containing cell lines. Source numerical data are available in source data. Source data
Extended Data Fig. 2
Extended Data Fig. 2. Testing heritability of transcription activity of Polycomb-targets across cell divisions.
(a) A strategy to assess the number of transcripts-per-cell for Polycomb genes between monoclonal daughter cells (grey box, left). Right: examples of smRNA-FISH images of 4-cell colonies with all cells having or all cells lacking Zic2 transcripts. This shows that the expression state of Polycomb target genes can be heritably retained across cell divisions. (b) Mean number of Polycomb gene transcripts per colony vs. colony size. Individual dots represent measurements for single monoclonal colonies. The blue dashed line represents the mean number of transcripts-per-cell in all colonies measured. Note, highly- or non-expressing colonies are still found in 4-cell colonies (2 cell divisions) indicating the respective state has been maintained across cell divisions. The data was acquired in two and three biological replicates for E2f6 and Zic2, respectively. Source numerical data and unprocessed blots are available in source data. Source data
Extended Data Fig. 3
Extended Data Fig. 3. Characterisation of live-cell transcription imaging with single-transcript sensitivity and ON-period analysis.
(a) MCP-GFP expression is uniform across the cell population correlated with DNA content (DAPI signal) (n = 1). (b) (Left panel) Measurements of GFP photobleaching (grey datapoints) over a full time-course of live-cell-imaging approximated with an exponential decay (red line) that was used to correct fluorescence intensity in time-course transcription trajectories. (Right panel) Examples of the effect of this correction are presented on the right. (c) To measure the intensity of single pre-mRNAs containing 128 MS2 aptamers, imaging was performed using a higher 490nm excitation intensity. The curve quantifies MCP-GFP intensity (y-axis) in response to varying 490nm excitation levels. The blue dashed lines represent values used for live-cell transcription imaging and for single pre-mRNA intensity quantification (dashed line with arrow-head). This curve informed us of the 490nm intensity that excites GFP at 3x the value used in our live-cell transcription measurements. (d) Histograms of single pre-mRNA intensities recalculated in values corresponding to live-cell transcription measurements for Zic2, E2f6, and Hspg2. The red line represents a Gaussian fit with mean and standard deviation values indicated above. These values allowed us to recalculate fluorescence intensity units in order to attribute transcript numbers based on fluorescence intensity at the transcription site. Data represents single biological replicate. (e) Examples of live-cell transcription trajectories with identified ON-periods indicated in blue or orange depending on whether they were taken into account during RNA Pol II reinitiation rate estimations or not. All ON-periods were taken into account in amplitude and duration analysis. (f) An example of a live-cell transcription trajectory with three ON-periods (in blue) with their amplitudes and RNA PolII reinitiation rates (from linear fits, red dashed lines) indicated. Source numerical data are available in source data. Source data
Extended Data Fig. 4
Extended Data Fig. 4. Stochastic simulations of transcription to obtain transcript-per-cell distributions and estimate transition probability from OFF- to Permissive-states for Polycomb genes.
(a) Density plots of time intervals between ON-periods (indicated as arrows in the cartoon) directly measured from live-cell transcription imaging trajectories for both Polycomb genes Zic2 (top) and E2f6 (bottom) for untreated (UNT) and PRC1-depleted (IAA) conditions. Dashed vertical lines represent mean values. ON-, permissive-, and OFF-periods are indicated in the cartoon in green, purple, and black, respectively. (b) Histograms of number of ON-periods detected per 8h live-cell transcription movie (indicated in the cartoon as blunt-end horizontal line). Dashed vertical lines represent mean values. (c) In order to interpret the detected number of ON-periods per 8h movie and infer the number of ON-periods in a permissive-period, the permissive-periods were simulated with varying mean Poisson-distributed number of ON-periods (λ, x-axis) and ‘sampled’ using a ‘sliding’ 8h window to represent the experimental measurement (blunt-end horizontal line in the cartoon). The sum difference between the resulting distribution and experimental distribution (presented in b) was calculated (y-axis). The red line represents 3rd-degree polynomial fit and its minimum (vertical dashed line) represented the mean number of ON-periods expected to produce most similar distribution of captured ON-periods per 8h measurement window. Plots for Zic2 (top) and E2f6 (bottom) are shown. (d) Histograms of inferred mean number of ON-periods per permissive-period for Zic2 (top) and E2f6 (bottom). (e) Estimates of transcript half-lives for Zic2, E2f6, and Hspg2. Data-points represent normalized mean number of transcripts in untreated (t=0) and after 4h of triptolide (TRP) treatment obtained by smRNA-FISH in three biological replicates. Solid black lines represent exponential fits. Horizontal grey lines represent half of the mean transcript number detected in untreated sample while error bars represent standard deviation. The intersection between black and grey lines indicates transcript half-life. (f) A cartoon illustrating the strategy to simulate transcription of Polycomb genes. (top) At an individual allele level every parameter of transcription necessary to simulate the permissive-state is quantified or inferred: ON-period amplitude (in transcripts), time between ON-periods, and number of ON-periods in a permissive state. (bottom) Cells were assumed to have on average 3 alleles, and were allowed two full cell cycles followed by cell divisions leading to random halving of the transcript numbers. Single cells were simulated leading to transcript accumulation. Once produced, transcripts were attributed a date-of-birth which was used at the end of the simulation to degrade transcripts based on mRNA half-life. This procedure was repeated 500 times to produce simulated single-cell distribution of transcripts-per-cell. (g) The procedure described in (f) was repeated using a range of probabilities of transitioning between OFF- and permissive- states (pO>P) to produce simulated transcript-per-cell distributions that were then compared to smRNA-FISH experimental data and the most similar were identified by the minimum in 3rd degree polynomial fit (red line) indicated as vertical blue line for Zic2 (left) and E2f6 (right) in untreated (UNT) or PRC1-depleted (IAA) conditions. Source numerical data are available in source data. Source data
Extended Data Fig. 5
Extended Data Fig. 5. Extended data to single-particle tracking of transcription regulators.
(a) Western blot analysis of endogenously HALO-tagged factors comparing the signals in wild type and tagged lines. Antibodies and molecular weight markers (in kilodaltons (kDa)) are indicated on the left, wild type (WT) and HALO-Tag (HT) protein bands are indicated on the right with arrows. Micrographs are representative results repeated one to three times each. (b) Microscopy validation of the HALO-Tag expression in lines with endogenously tagged proteins. HALO-Tag-proteins were visualized using TMR-HALO ligand. All proteins localized to the nucleus. Representatives of at least 3 fields of view. Scale bar represents 15 µm and applies to all the images in the panel. (c) Examples of representative biological replicates of histograms of log10(D) calculated from single-particle tracking data acquired at high camera frame rate, obtained for the panel of transcription regulators with (UNT) and without PRC1 (IAA). Black solid lines represent a mixed two-Gaussian fit (to account for immobile and mobile fractions) with indicated value representing immobile portion of molecules. Blue solid line represents histogram density. (d) Examples of 1-CDF plots representing single molecule binding times acquired at low camera frame rate. Average stable binding time is extracted from bi-exponential fits indicated in the plots. Examples of data acquired with (UNT, red line) and without PRC1 (IAA, purple line) together with respective H2B-HT (blue). The latter represents a stable binding control used to correct photobleaching. Source data
Extended Data Fig. 6
Extended Data Fig. 6. Genome-wide occupancy of canonical PRC1 complexes and their role in TFIID binding.
(a) Heat maps illustrating cChIP-seq signal for RINGB (all PRC1 complexes) (green, left), RYBP (ncPRC1, purple, middle), and PHC1 (cPRC1, red, right). TSSs were segregated into non-Polycomb (n = 9899), Polycomb (n = 4869), and non-CpG islands (n = 5869) groupings as indicated and ranked by decreasing RING1B signal. (b) ChIP-qPCR analysis of TAF1 chromatin occupancy at promoters of E2f6, Zic2, HoxD8, Bcor, Hoxb3os (Polycomb genes), as well as Brd2 (non-Polycomb gene, ‘Ref’) prior (UNT, dark blue) and after 4h depletion of PCGF2, a core component of cPRC1 (AGB1, light blue). Ctrl represents ChIP signal at a gene desert region. Error bars represent standard deviation from n = 3 biological replicates throughout the figure. (c) ChIP-qPCR analysis of PCGF2 as in (a), demonstrating its complete depletion from chromatin after 4h of treatment with AGB1. (d) Gene expression analysis of a panel of Polycomb genes using qRT-PCR after 4h depletion of RING1B (all PRC1 complexes, IAA) or PCGF2 (cPRC1 complexes, AGB1). Brd2 was used as a non-Polycomb gene (‘Ref’). Error bars represent standard deviation from n = 3 biological replicates. Source numerical data are available in source data. Source data
Extended Data Fig. 7
Extended Data Fig. 7. Effects of PRC1 on the binding of the components of transcription machinery.
(a) ChIP-qPCR analysis of TAF1, TAF11, and MED14 chromatin occupancy at promoters of E2f6, Zic2, HoxD8, Bcor, Hoxb3os (Polycomb genes), as well as Brd2 (non-Polycomb genes) prior (UNT, blue) and after PRC1 depletion (IAA, orange). Ctrl represents ChIP signal at a gene desert region. RINGB ChIP-qPCR at the target sites demonstrates complete depletion after 4h IAA treatment. Error bars represent standard deviation from n = 3 biological replicates around average values. (b) Density plot representing Log2 fold change (4h IAA/UNT) in T7-TAF1 ChIP signal for all the genes (n = 20,633) within the TSSs (+/− 1kb). (c) Density plot representing Log2 fold change (4h IAA/UNT) in cnRNA-seq signal for all the genes (n = 20,633). Data from Dobrinic et al.. (d) Genomic snapshots for Zic2, E2f6, Meis1, HoxA7, HoxD locus (Polycomb genes), as well as Hspg2 and Brd2 (non-Polycomb genes) shown RING1B and T7-TAF1 before and after 4h of RING1B depletion (IAA). (e) Correlation between changes in expression (Log2 fold change in cnRNA-seq) and changes in T7-TAF1 binding for non-Polycomb genes, Polycomb genes, and genes with no CpG islands (nonCGI genes). R represents two-sided Pearson correlation with exact p-values presented. Source numerical data are available in source data. Source data
Extended Data Fig. 8
Extended Data Fig. 8. Effects of PRC1 depletion on transcription of lowly expressed Polycomb targets are distinct from its activation.
(a) Gene expression analysis of Meis1 after RING1B depletion (4h IAA) and after 72h of retinoic acid treatment (72h RA). Data represents average transcript per cell numbers from single molecule RNA-FISH. Error bars represent standard deviation from n = 3 biological replicates (dots) around the average values. (b) Heatmaps representing live-cell transcription imaging of Meis1 in untreated (UNT), after RING1B depletion (IAA), and upon retinoic acid treatment (72h RA). Rows represent transcription activity trajectories of individual cells (141 in total). Data represent three biological replicates. Source numerical data are available in source data. Source data

References

    1. Haberle, V. & Stark, A. Eukaryotic core promoters and the functional basis of transcription initiation. Nat. Rev. Mol. Cell Biol.19, 621–637 (2018). - PMC - PubMed
    1. Janssen, S. M. & Lorincz, M. C. Interplay between chromatin marks in development and disease. Nat. Rev. Genet.23, 137–153 (2022). - PubMed
    1. Talbert, P. B., Meers, M. P. & Henikoff, S. Old cogs, new tricks: the evolution of gene expression in a chromatin context. Nat. Rev. Genet.20, 283–297 (2019). - PubMed
    1. Kouzarides, T. Chromatin modifications and their function. Cell128, 693–705 (2007). - PubMed
    1. Schuettengruber, B., Bourbon, H. M., Di Croce, L. & Cavalli, G. Genome regulation by polycomb and trithorax: 70 years and counting. Cell171, 34–57 (2017). - PubMed

Publication types

Substances