. 2024 Sep;633(8030):608-614.
doi: 10.1038/s41586-024-07931-x. Epub 2024 Sep 11.

Genetic links between ovarian ageing, cancer risk and de novo mutation rates

Affiliations

Genetic links between ovarian ageing, cancer risk and de novo mutation rates

Stasa Stankovic et al. Nature. 2024 Sep.

Abstract

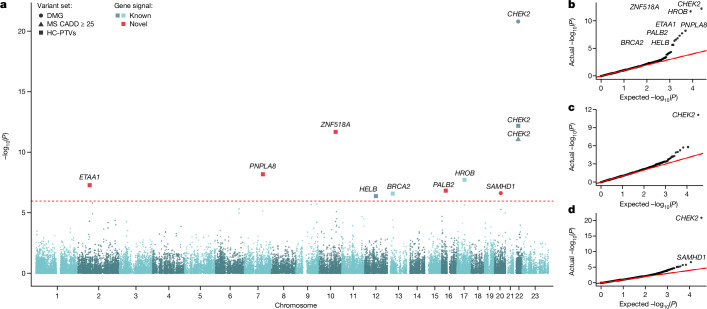
Human genetic studies of common variants have provided substantial insight into the biological mechanisms that govern ovarian ageing1. Here we report analyses of rare protein-coding variants in 106,973 women from the UK Biobank study, implicating genes with effects around five times larger than previously found for common variants (ETAA1, ZNF518A, PNPLA8, PALB2 and SAMHD1). The SAMHD1 association reinforces the link between ovarian ageing and cancer susceptibility1, with damaging germline variants being associated with extended reproductive lifespan and increased all-cause cancer risk in both men and women. Protein-truncating variants in ZNF518A are associated with shorter reproductive lifespan-that is, earlier age at menopause (by 5.61 years) and later age at menarche (by 0.56 years). Finally, using 8,089 sequenced trios from the 100,000 Genomes Project (100kGP), we observe that common genetic variants associated with earlier ovarian ageing associate with an increased rate of maternally derived de novo mutations. Although we were unable to replicate the finding in independent samples from the deCODE study, it is consistent with the expected role of DNA damage response genes in maintaining the genetic integrity of germ cells. This study provides evidence of genetic links between age of menopause and cancer risk.


Conflict of interest statement

J.R.B.P. and E.J.G. are employees of Insmed Innovation UK and hold stock/stock options in Insmed. J.R.B.P. has also received consultancy fees from Hertility Health and WW International and holds research funding from GSK. The other authors declare no competing interests.

Figures

Fig. 1
Fig. 1. Exome-wide associations with ANM.
a, Manhattan plot showing gene burden test results for ANM from BOLT-LMM in 106,973 female participants. Genes passing exome-wide significance (P < 1.08 × 10−6) are indicated, with the shape signifying the variant class tested and colour indicating the novelty. MS, missense. bd, QQ plots of P values from BOLT-LMM against expected P values for high-confidence PTVs: λ = 1.047 (b), CADD ≥ 25 missense variants: λ = 1.050 (c) and damaging variants: λ = 1.050 (d).
Fig. 2
Fig. 2. Forest plot for gene burden associations with ANM.
Exome-wide significant (P < 1.08 × 10−6) genes (filled circles) are displayed; an unfilled circle indicates a nonsignificant association. Points and error bars indicate beta and 95% CI, respectively, for the indicated variant category. Beta values, CIs, minor allele counts (MACs) and P values are derived from BOLT-LMM (values are given in Supplementary Table 2). n = 115,051 individuals with ANM are included in the analysis.
Fig. 3
Fig. 3. Forest plot for ANM WES genes with significant gene burden associations for cancer phenotypes.
Exome-wide significant (P < 1.08 × 10−6) genes are displayed, showing sex-stratified and combined results from BOLT-LMM analysis. Hormone-sensitive cancers only were tested in male and female subjects separately (Methods). The presented masks were selected on the basis of the most significant association per gene and cancer type. Points and bars indicate odds ratio and 95% CI, respectively, for specific genes and their variant categories for each cancer type (values are given in Supplementary Table 10). A filled circle indicates that a result passes a Bonferroni-corrected significance threshold of P < 1.08 × 10−6; an unfilled circle indicates a nonsignificant association. n = 421,064 (228,517 female and 192,547 male participants).
Fig. 4
Fig. 4. Genetic susceptibility to premature ovarian ageing and increased risk for diverse cancer types.
Association between loss of ANM genes identified in this study and risk of 90 site-specific cancers among UK Biobank participants. Summary statistics for cancer associations were obtained using a logistic regression with penalized likelihood estimation that controls for case–control imbalance (Methods). Associations highlighted with text labels passed an exome-wide significance threshold (P < 1.08 × 10−6). The y axis is capped at −log10(P) = 30 for visualization purposes; uncapped summary statistics are presented in Supplementary Table 11. 1°, primary cancer; 2°, secondary cancer; F, female participants; M, male participants; C, both sexes combined.
Extended Data Fig. 1
Extended Data Fig. 1. Exome-wide association results for synonymous variants.
Plotted are per-gene burden results for synonymous variants. The red line indicates the exome-wide significant P value after Bonferroni correction of 1.08*10−6.
Extended Data Fig. 2
Extended Data Fig. 2. Lollipop plots show the variants, clustered for the best performing functional mask in a gene, which went into the gene burden test for ANM using BOLT-LMM.
The arrows pointing upwards represent the variants positively associated with ANM, while the ones pointing downwards show the negatively associated variants. The size of the point indicates the allele count in carriers. Panel 1: Variant level associations for ANM decreasing WES genes. (A) BRCA2 HC PTV mask (genomic size = 84,761 bp, coding sequence = 10,254 bp); (B) ETAA1, HC PTV mask (genomic size = 14,757 bp, coding sequence = 2,778 bp); (C) HROB, HC PTV mask (genomic size = 20,547 bp, coding sequence = 1,938 bp); (D) PALB2, HC PTV mask (genomic size = 38,146 bp, coding sequence = 3,558 bp); (E) PNPLA8, HC PTV mask (genomic size = 55,719 bp, coding sequence = 2,346 bp); and (F) ZNF518A, HC PTV mask (genomic size = 33,463 bp, coding sequence = 4,449 bp). Panel 2: Variant level associations for ANM increasing WES genes. (A) CHEK2, damaging mask (genomic size = 54,078 bp, coding sequence = 1,629 bp); (B) HELB, HC PTV mask (genomic size = 35,707 bp, coding sequence = 3,261 bp); and (C) SAMHD1, damaging mask (genomic size = 61,480 bp, coding sequence = 1,878 bp).
Extended Data Fig. 3
Extended Data Fig. 3. Functional analysis of ZNF518A bound loci.
(a) Histogram of log10-scale distances between ZNF518A and nearest gene transcription start site (TSS). (b) Proportion of ZNF18A peaks falling proximal to TSS (TSS < 2 kb), within gene bodies and in intergenic regions. (c) Boxplots showing total normalised reads per million (RPM) for every peak for categories TSS < 2 kb, gene body and intergenic - ZNF518A peaks have greater signal at proximal to TSS. (d) SLDP association between ANM GWAS variants and ZNF518A peaks, stratified by all peaks, proximal (<2 kb) from a TSS, and distal (>5 kb) from a TSS. The association between ANM variants and ZNF518A peaks appears due to distal ZNF518A peaks (either gene body or intergenic, >5 kb TSS) and not proximal TSS binding. Numerical results are reported in Supplementary Table 7. (e) De novo motif discovery recovers unvalidated JASPAR motif for ZNF518A UN0199.1. Homer enrichment statistics: all sites P = 10−6451 motif in 31.2% of targets (1.15% background); distal sites P = 10−4590 motif in 47.3% of targets (1.81 % background). (f) Proportion of maximal scoring instances of UN0199.1 (sequences that exactly match motif consensus) by ZNF518A peak category. Many distal peaks contain multiple perfect instances of the motif. (g) Boxplots, violin plots and dot plots depicting the relationship between ZNF518A ChIP-seq peak height and number of maximal scoring motifs present in peak. A strong relationship between peak height and number of motif instances can be observed. (h) Heatmaps depicting ZNF518A ChIP-seq, H3K27ac ChIP-seq in hPGCLCs, and chromatin accessibility by ATAC-seq in hPGCLCs. Signal shown over all ZNF518A peaks in RPM + /− 1 kb of ZNF518A peak summit. ZNF518A bound promoters (TSS < 2 kb) are accessible and are marked with H3K27ac, distal regions either in gene bodies or intergenic regions show no H3K27ac or chromatin accessibility, suggestive that ZNF518A represses these regulatory regions. (i,j) Association shown in odds ratios of ChromHMM states over 833 tissues/cell types from Epimap; boxplots with outliers shown, with each boxplot summarising the distribution of associations over all tissues/cell types for a given chromatin state. (i) All ZNF518A peaks; (j) ZNF518A peaks distal from TSS.
Extended Data Fig. 4
Extended Data Fig. 4. ANM gene burden associations with reproductive ageing-related traits of interest in females only.
The coefficients and 95% CIs were female-specific and plotted for the quantitative traits only. The association was tested using BOLT-LMM. Male-specific and sex combined associations could be found in Supplementary Table 10.
Extended Data Fig. 5
Extended Data Fig. 5. Distribution of de novo single nucleotide variants (dnSNVs).
The histogram shows the number of (A) total dnSNVs, includes both phased (maternal + paternal) and unphased DNMs, (B) paternally derived dnSNVs and (C) maternally derived dnSNVs in unrelated probands with European ancestry from the 100,000 Genomes Project. (D–F) show similar distributions in individuals from deCODE.
Extended Data Fig. 6
Extended Data Fig. 6. Expression levels of genes across various stages of female germ cell development.
In the X-axis, genes are ranked according to their average expression at each stage (Y-axis) (A) in human foetal primordial germ cells and (B) in granulosa cells in adult follicles. Genes identified as novel ANM genes in WES analysis are coloured in green and all other genes in the genome are in grey. ZNF518A is depicted in orange for the ease of comparison with other genes (Supplementary Table 17).
Extended Data Fig. 7
Extended Data Fig. 7. mRNA expression of WES genes during foetal stages and folliculogenesis.
Box and whisker plots of mRNA expression of the WES genes at different stages of germ cell development. The plots represent the interquartile range of TPM values, the line at the centre of the box represents the median, error bars indicate the 95% CI and outliers are shown as dots. (A) Sub-clusters from single foetal cells from week 5 to 26 post-fertilisation are on the X-axis with the average TPM expression values log2(TPM + 1) on the Y-axis. (B) Different stages of folliculogenesis in oocytes and granulosa cells are represented on the X-axis with their average expression values log2(FPKM + 1) on the Y-axis (Supplementary Table 18).

References

    1. Ruth, K. S. et al. Genetic insights into biological mechanisms governing human ovarian ageing. Nature596, 393–397 (2021). - PMC - PubMed
    1. Perry, J. R. B., Murray, A., Day, F. R. & Ong, K. K. Molecular insights into the aetiology of female reproductive ageing. Nat. Rev. Endocrinol.11, 725–734 (2015). - PMC - PubMed
    1. Wallace, W. H. B. & Kelsey, T. W. Human ovarian reserve from conception to the menopause. PLoS ONE5, e8772 (2010). - PMC - PubMed
    1. Lambalk, C. B., van Disseldorp, J., de Koning, C. H. & Broekmans, F. J. Testing ovarian reserve to predict age at menopause. Maturitas63, 280–291 (2009). - PubMed
    1. Ward, L. D. et al. Rare coding variants in DNA damage repair genes associated with timing of natural menopause. HGG Adv.3, 100079 (2021). - PMC - PubMed

MeSH terms