

Establishment and validation of a predictive model for spontaneous preterm birth in singleton pregnant women
- PMID: 39261755
- PMCID: PMC11389547
- DOI: 10.1186/s12884-024-06772-w
Establishment and validation of a predictive model for spontaneous preterm birth in singleton pregnant women
Abstract
Introduction: In the current study, we screened for highly sensitive and specific predictors of premature birth, with the aim to establish an sPTB prediction model that is suitable for women in China and easy to operate and popularize, as well as to establish a sPTB prediction scoring system for early, intuitive, and effective assessment of premature birth risk.
Methods: A total of 685 pregnant women with a single pregnancy during the second trimester (16-26 weeks) were divided into premature and non-premature delivery groups based on their delivery outcomes. Clinical and ultrasound information were collected for both groups, and risk factors that could lead to sPTB in pregnant women were screened and analyzed using a cut-off value. A nomogram was developed to establish a prediction model and scoring system for sPTB. In addition, 119 pregnant women who met the inclusion criteria for the modeling cohort were included in the external validation of the model. The accuracy and consistency of the model were evaluated using the area under the receiver operating characteristic (ROC) and C-calibration curves.
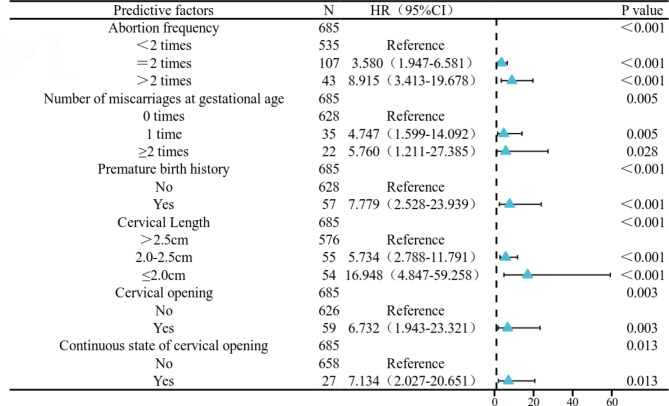
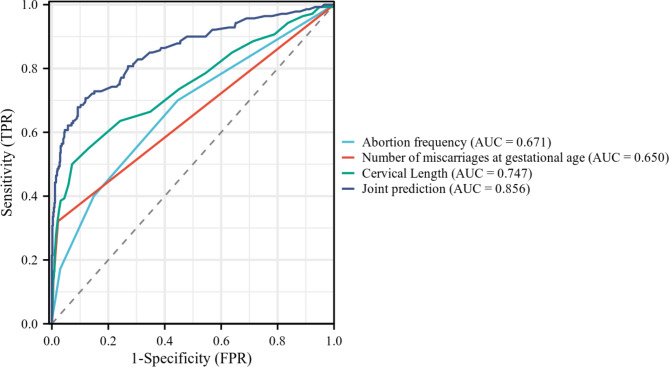
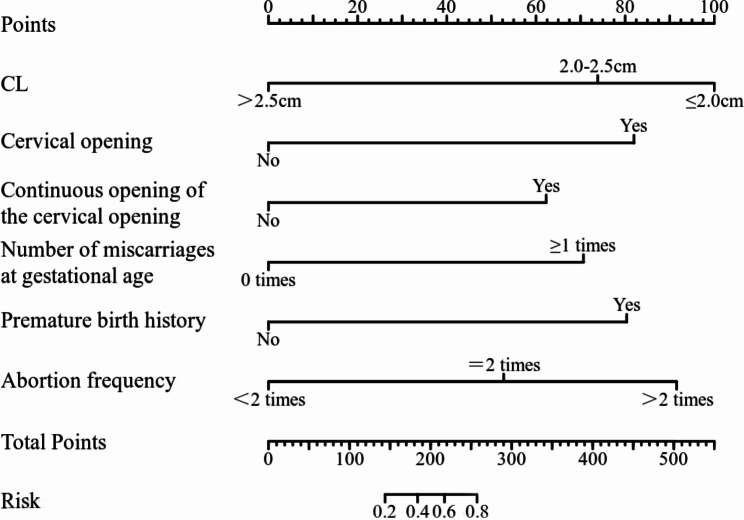
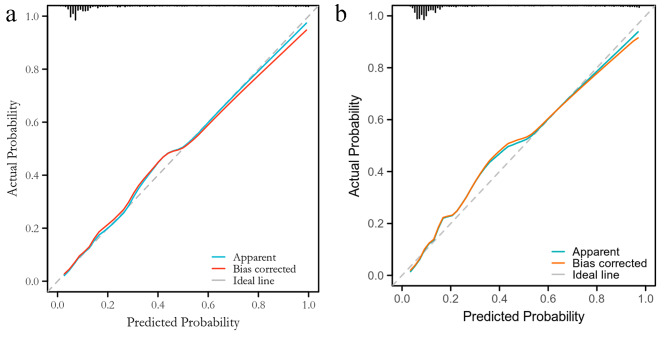
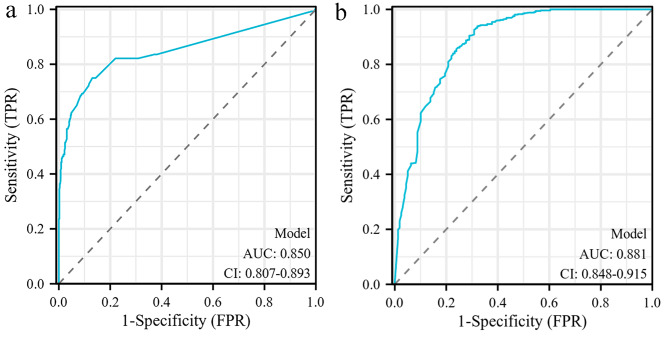
Results: Multivariate logistic regression analysis showed a significant correlation (P < 0.05) between the number of miscarriages in pregnant women, history of miscarriages in the first week of pregnancy, history of preterm birth, CL of pregnant women, open and continuous cervical opening, and the occurrence of sPTB in pregnant women. We drew a nomogram column chart based on the six risk factors mentioned above, obtained a predictive model for sPTB, and established a scoring system to divide premature birth into three risk groups: low, medium, and high. After validating the model, the Hosmer Lemeshow test indicated a good fit (p = 0.997). The modeling queue C calibration curve was close to diagonal (C index = 0.856), confirming that the queue C calibration curve was also close to diagonal (C index = 0.854). The AUCs of the modeling and validation queues were 0.850 and 0.881, respectively.
Conclusion: Our predictive model is consistent with China's national conditions, as well as being intuitive and easy to operate, with wide applicability, thus representing a helpful tool to assist with early detection of sPTB in clinical practice, as well as for clinical management in assessing low, medium, and high risks of sPTB.
Keywords: Prediction model; Predictive factors; Spontaneous premature birth; Ultrasound.
© 2024. The Author(s).
Conflict of interest statement
The authors declare no competing interests.
Figures
Similar articles
-
Prediction model for spontaneous preterm birth less than 32 weeks of gestation in low-risk women with mid-trimester short cervical length: a retrospective cohort study.BMC Pregnancy Childbirth. 2024 Oct 1;24(1):621. doi: 10.1186/s12884-024-06822-3. BMC Pregnancy Childbirth. 2024. PMID: 39354430 Free PMC article.
-
Development and validation of predictive models for QUiPP App v.2: tool for predicting preterm birth in asymptomatic high-risk women.Ultrasound Obstet Gynecol. 2020 Mar;55(3):348-356. doi: 10.1002/uog.20401. Ultrasound Obstet Gynecol. 2020. PMID: 31325332
-
Mid-trimester sonographic cervical consistency index to predict spontaneous preterm birth in a low-risk population.Ultrasound Obstet Gynecol. 2018 May;51(5):629-636. doi: 10.1002/uog.17482. Epub 2018 Apr 10. Ultrasound Obstet Gynecol. 2018. PMID: 28370687
-
Uterocervical angle measurement for preterm birth prediction in singleton pregnant women with no history of preterm birth and normal cervical length: A prospective cohort study.Eur J Obstet Gynecol Reprod Biol. 2020 Sep;252:30-35. doi: 10.1016/j.ejogrb.2020.06.020. Epub 2020 Jun 9. Eur J Obstet Gynecol Reprod Biol. 2020. PMID: 32562939
-
Cervical elastography in predicting spontaneous preterm birth in singleton pregnancy with a short cervix receiving progesterone treatment at 18 to 24 weeks' gestation.J Matern Fetal Neonatal Med. 2024 Dec;37(1):2347954. doi: 10.1080/14767058.2024.2347954. Epub 2024 May 7. J Matern Fetal Neonatal Med. 2024. PMID: 38714523
References
-
- Xuming B. Dong Yue. Recommended guidelines for clinical diagnosis and treatment of premature birth (draft) [J]. Chin J Obstet Gynecol. 2007;42(07):498–500.
-
- Lizhou S. Screening and evaluation of high-risk factors for spontaneous premature birth [J]. J Practical Obstet Gynecol. 2012;28(10):803–5.
Publication types
MeSH terms
LinkOut - more resources
Full Text Sources
Miscellaneous
