. 2024 Sep 11;25(1):850.
doi: 10.1186/s12864-024-10755-8.

Effects of the FHL2 gene on the development of subcutaneous and intramuscular adipocytes in goats

Affiliations

Effects of the FHL2 gene on the development of subcutaneous and intramuscular adipocytes in goats

An Li et al. BMC Genomics. .

Erratum in

Abstract

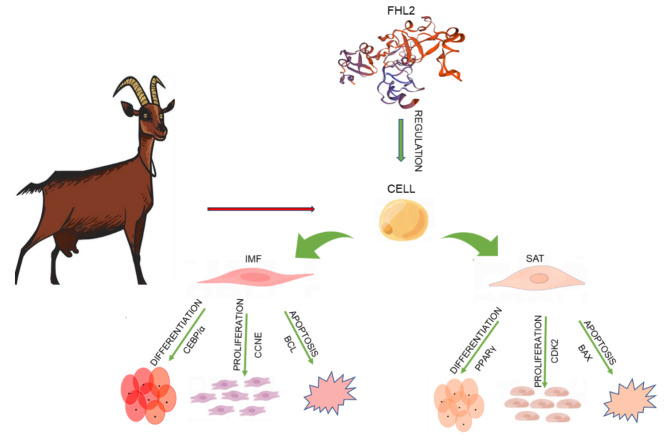
Background: Adipose tissue affects not only the meat quality of domestic animals, but also human health. Adipocyte differentiation is regulated by a series of regulatory genes and cyclins. Four and half-LIM protein (FHL2) is positively correlated with the hypertrophy of adipocytes and can cause symptoms such as obesity and diabetes.

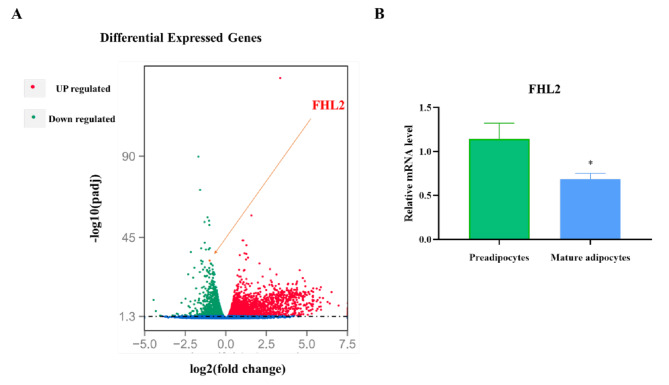
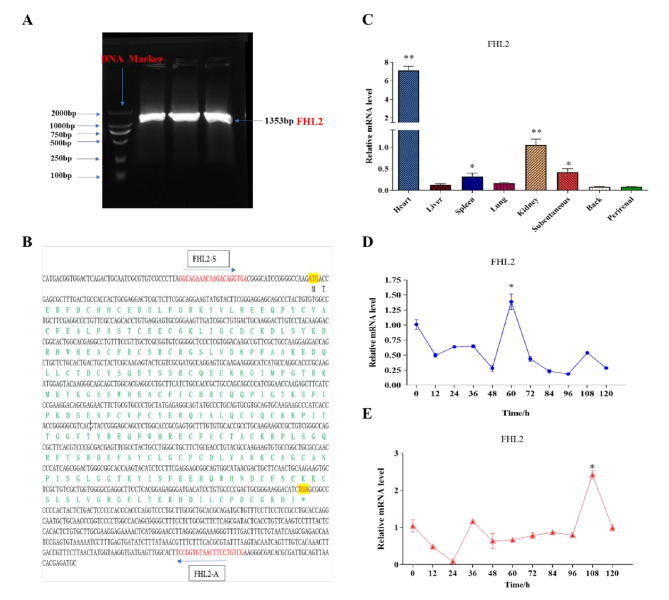
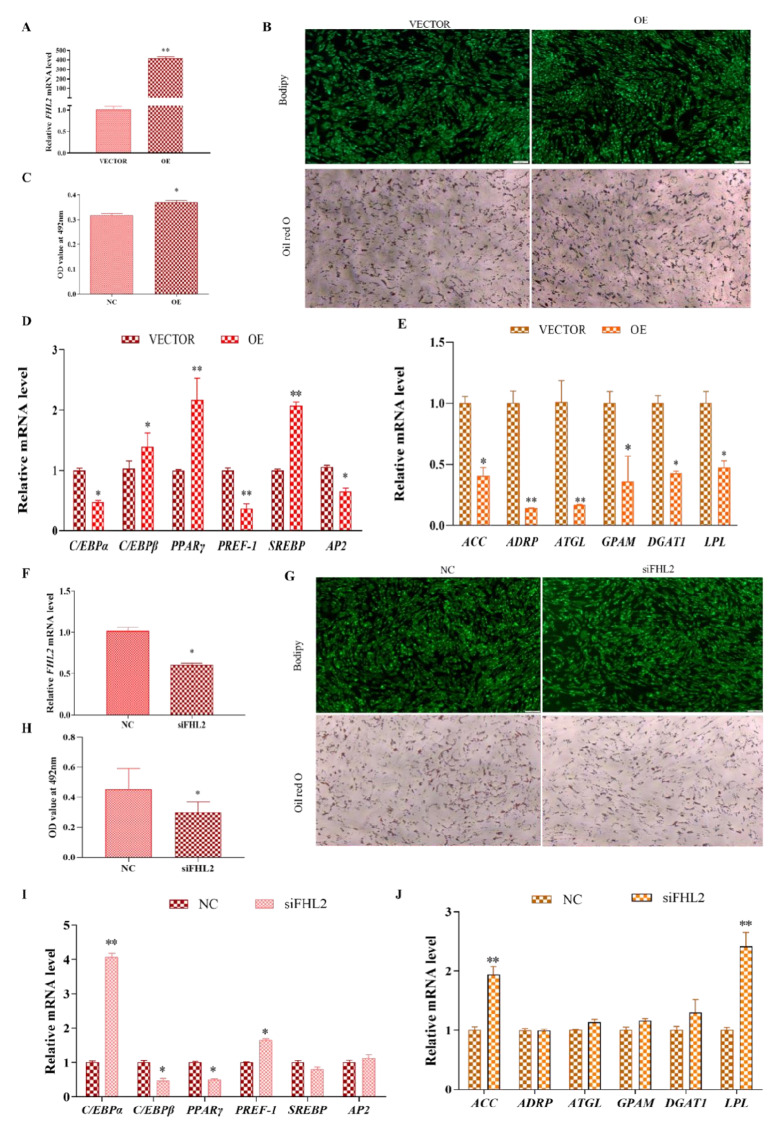
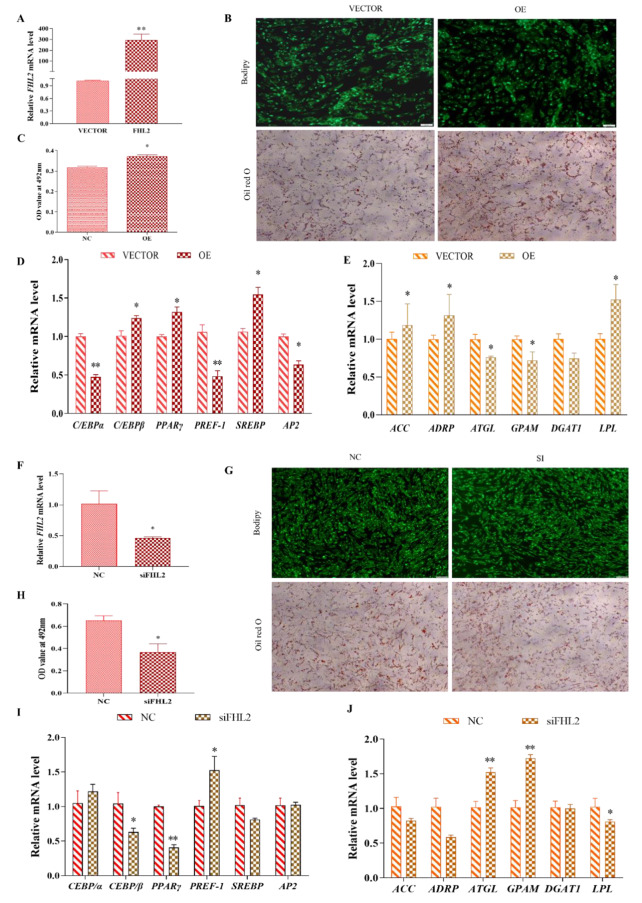
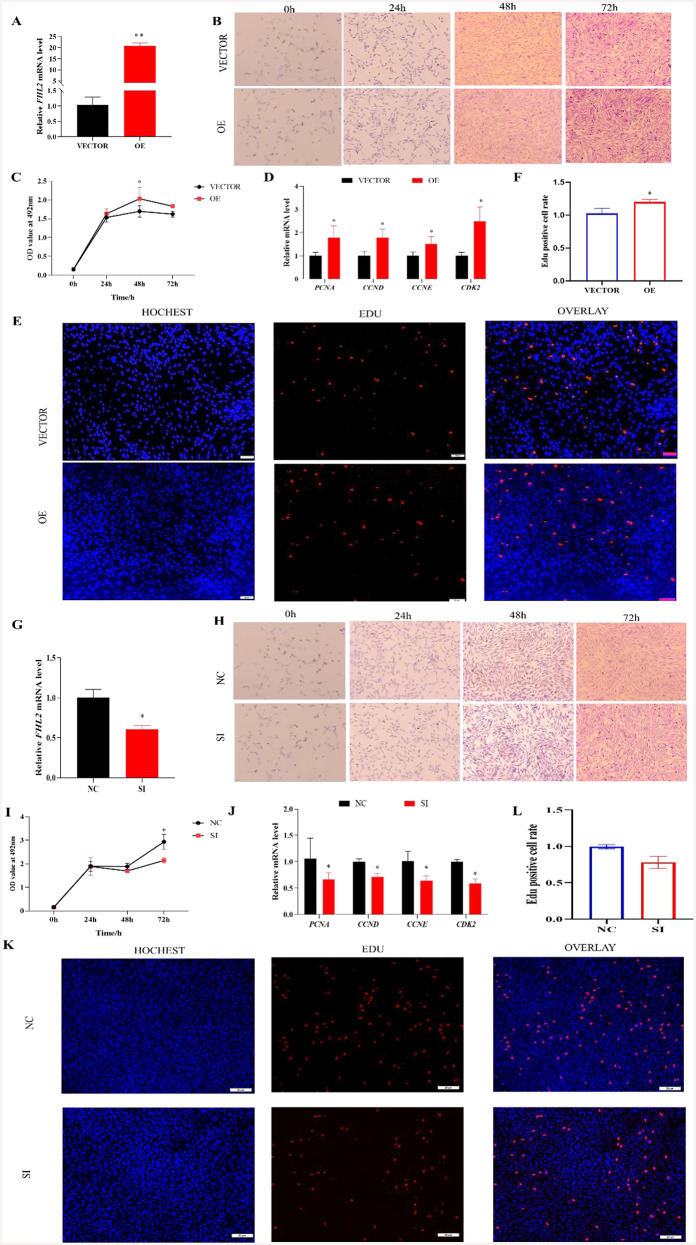
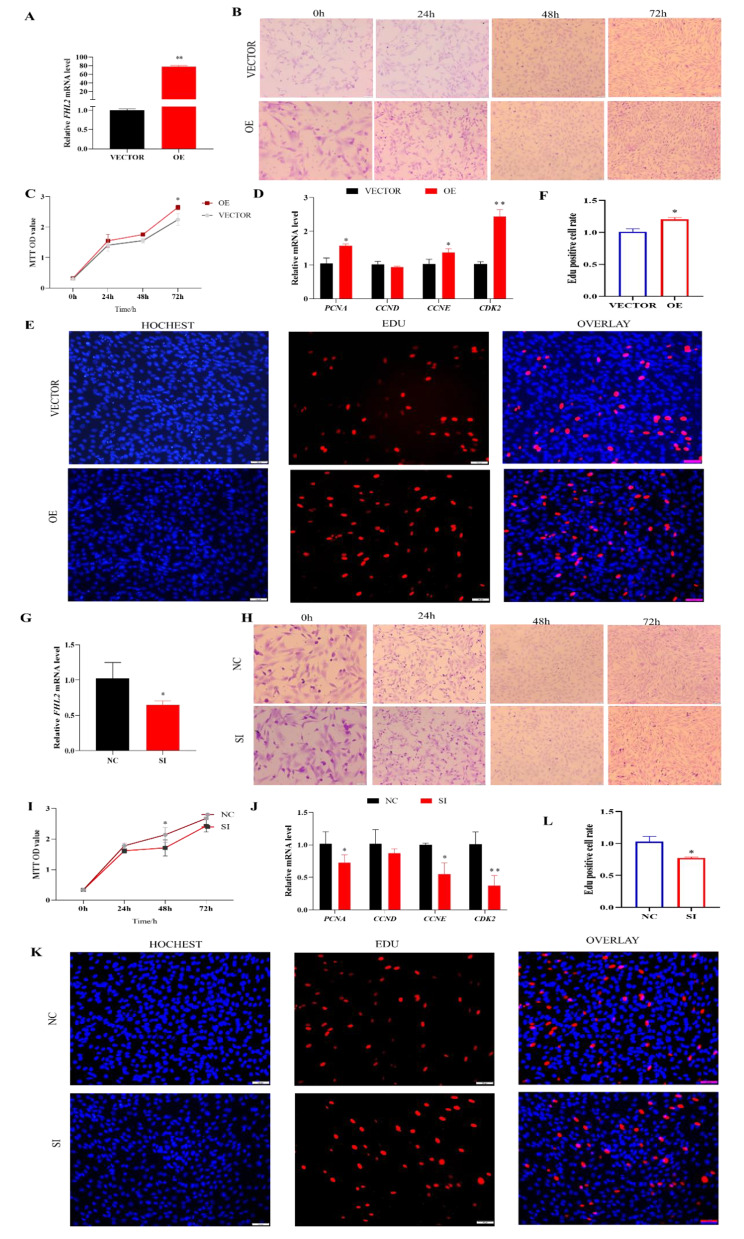
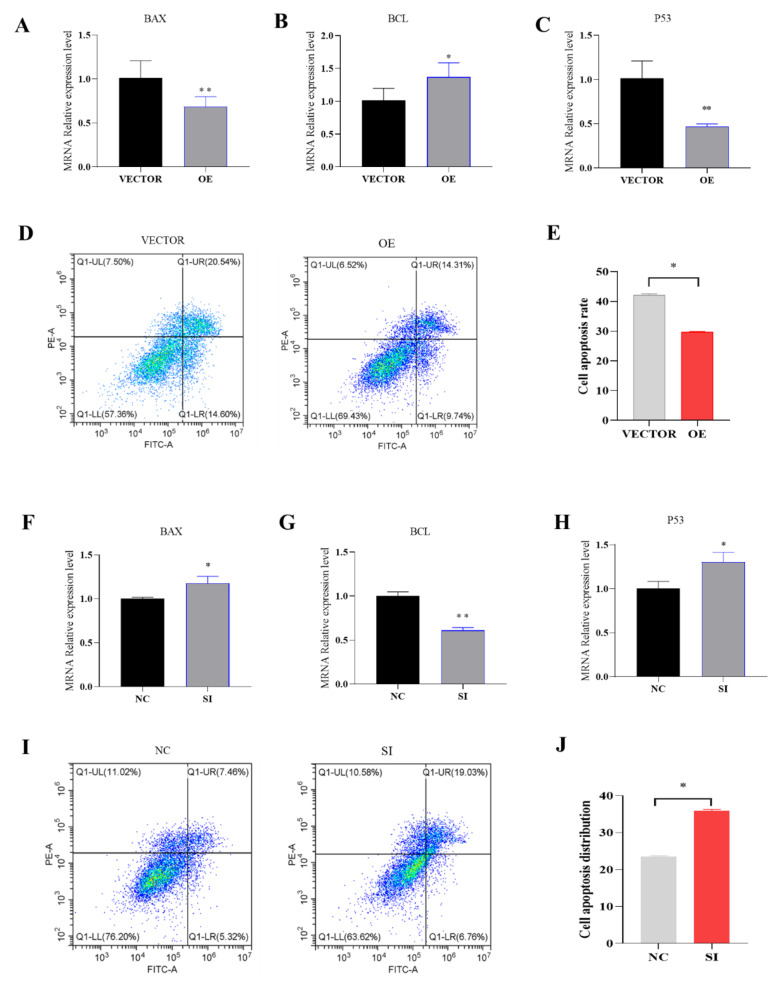
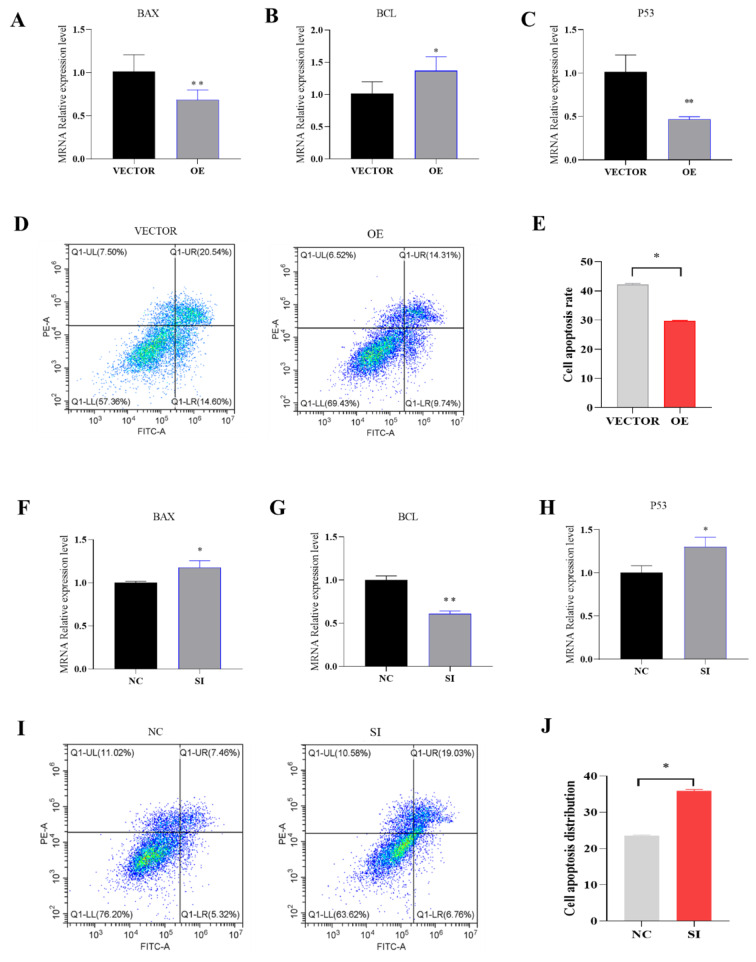
Result: In the transcriptome sequencing analysis of intramuscular adipocytes after three days of differentiation, the differentially expressed gene FHL2 was found. To further explore the biological significance of the differentially expressed gene FHL2, which was downregulated in the mature adipocytes. We revealed the function of FHL2 in adipogenesis through the acquisition and loss of function of FHL2. The results showed that the overexpression of FHL2 significantly increased the expression of adipogenic genes (PPARγ, C/EBPβ) and the differentiation of intramuscular and subcutaneous adipocytes. However, silencing FHL2 significantly inhibited adipocyte differentiation. The overexpression of FHL2 increased the number of adipocytes stained with crystal violet and increased the mRNA expression of proliferation marker genes such as CCNE, PCNA, CCND and CDK2. In addition, it significantly increased the rate of EdU positive cells. In terms of apoptosis, overexpression of FHL2 significantly inhibited the expression of P53 and BAX in both intramuscular and subcutaneous adipocytes, which are involved in cell apoptosis. However, overexpression of FHL2 promoted the expression of BCL, but was rescued by the silencing of FHL2.

Conclusions: In summary, FHL2 may be a positive regulator of intramuscular and subcutaneous adipocyte differentiation and proliferation, and acts as a negative regulator of intramuscular and subcutaneous adipocyte apoptosis. These findings provide a theoretical basis for the subsequent elucidation of FHL2 in adipocytes.

Keywords: FHL2; Adipogenesis; Goat; Intramuscular adipocytes; Subcutaneous adipocytes.


Conflict of interest statement

The authors declare no competing interests.

Figures

Fig. 1
Fig. 1
Transcriptome sequencing comparison of mature adipocytes and preadipocytes. A Volcano plot of DEGs. Volcano plot of DEGs in preadipocytes and mature adipocytes, the screening condition is P < 0.01; B Validation of DEGs by PCR. Validation of differential expression gene using RT-qPCR (n = 5). The RT-qPCR data were analyzed using 2−ΔΔCt method, and ubiquitously expressed transcript (UXT) was used as endogenous control. “*” denotes P < 0.05
Fig. 2
Fig. 2
Goat FHL2 gene sequence analysis. A Amplification of FHL2 gene in goat. DL 2000 DNA marker, FHL2 target strip; B Sequence of nucleotide and derived amino acids Jian Zhou Da-er goat FHL2 cDNA; C The expression of FHL2 gene in different goat tissues. “**” indicates that the difference is extremely significant difference between the data (< 0.01), “*” indicate significant difference (< 0. 05); D The relative expression of FHL2 during the differentiation of subcutaneous adipocytes. E The relative expression of FHL2 during the differentiation of intramuscular adipocytes
Fig. 3
Fig. 3
The over-expression efficiency analysis of FHL2 gene in intramuscular adipocytes. A The over-expression efficiency of FHL2 was detected in mRNA level, n = 5; B Morphological observation of Bodipy staining and Oil Red O staining; C The OD value at 492 nm was detected by Oil Red O staining, n = 8; D Effects of FHL2 overexpression in intramuscular adipocytes on differentiation marker genes; E Effects of FHL2 overexpression in intramuscular adipocytes on triglyceride synthesis marker genes (n = 6). UXT was the internal reference gene to normalize the expression levels; F siFHL2 efficiency of FHL2 was detected in mRNA level, n = 5; G Morphological observation of Bodipy and Oil Red O staining; H The OD value was detected by Oil Red O staining, n = 8. “*” the difference is significant (P < 0.05); I-J Effect of silencing FHL2 on intramuscular adipocyte differentiation marker genes and triglyceride synthases marker genes in the silencing FHL2 and negative control. n = 6, UXT was the internal reference gene to normalize the expression levels. “**” the difference was extremely significant compared with the control group (P < 0.01), “*” the difference was significantly. Data were shown as Means ± SEM
Fig. 4
Fig. 4
The overexpression efficiency analysis of FHL2 gene in subcutaneous adipocytes. A The over-expression efficiency of FHL2 was detected in mRNA level, n = 5; B Morphological observation of Bodipy and Oil Red O staining; C The OD value was detected by Oil Red O staining, n = 8; D Effects of FHL2 overexpression in subcutaneous adipocytes on differentiation marker genes; E Effects of FHL2 overexpression in subcutaneous adipocytes on triglyceride synthesis marker genes; F The efficiency of silencing FHL2 in subcutaneous adipocytes was detected at the mRNA level, n = 5; G Morphological observation of Bodipy and Oil Red O staining; H The OD value was detected by Oil Red O staining, n = 8; I Effects of silence of FHL2 on adipocyte differentiation marker genes in subcutaneous adipocytes (n = 6); J Effects of silencing FHL2 in subcutaneous adipocytes on triglyceride synthesis marker genes. UXT was the internal reference gene to normalize the expression levels. “**” the difference was extremely significant (P < 0.01), “*” the difference was significantly. Data were shown as Means ± SEM
Fig. 5
Fig. 5
FHL2 promoted the proliferation of intramuscular adipocytes. A Analysis of FHL2 overexpression efficiency; B Intramuscular adipocytes were stained using crystal violet staining to determine the effect of FHL2 on adipocytes number after 0, 24, 48, and 72 h and photographed; C Intramuscular adipocytes proliferation was examined by MTT analysis; D RT-qPCR was used to detect the effects of FHL2 on cell cycle genes, PCNA, CCND, CCNE and CDK2; E The proliferation capacity of the goat intramuscular adipocytes was examined by the EdU assay; F This image represents the results obtained by EdU after transfection overexpression FHL2; G Analysis of silent efficiency of FHL2; H The number of intramuscular adipocytes after transfection silencing FHL2 at 0, 24, 48, and 72 h was determined by crystal violet staining; I Intramuscular adipocytes proliferation was examined by MTT analysis; J RT-qPCR was used to detect cell cycle genes, PCNA, CCND, CCNE and CDK2 after 48 h transfection silencing FHL2; K EdU assay was carried out after transfection silencing FHL2 for 48 h; L This image represents the results obtained by EdU after transfection silencing FHL2. “*” denotes P < 0.05, “**” indicates P < 0.01
Fig. 6
Fig. 6
FHL2 promoted the proliferation of subcutaneous adipocytes. AFHL2 overexpression efficiency analysis; B Subcutaneous adipocytes were stained using crystal violet staining to determine the effect of FHL2 on adipocytes number after 0, 24, 48, and 72 h and photographed; C Subcutaneous adipocytes proliferation was examined by MTT analysis; D RT-qPCR was used to detect the effects of FHL2 on cell cycle genes, PCNA, CCND, CCNE and CDK2 after overexpression in subcutaneous adipocytes; E The proliferation capacity of the goat subcutaneous adipocytes was examined by the EdU assay; F This image represents the results obtained by EdU after transfection overexpression FHL2; G Analysis of silent efficiency of FHL2; H The number of subcutaneous adipocytes after transfection silencing FHL2 at 0, 24, 48, and 72 h was determined by crystal violet staining; I Subcutaneous adipocytes proliferation was examined by MTT analysis; J RT-qPCR was used to detect cell cycle genes, PCNA, CCND, CCNE and CDK2 after 48 h transfection silencing FHL2; K EdU assay was carried out after transfection silencing FHL2 for 48 h; L This image represents the results obtained by EdU after transfection silencing FHL2. “*” denotes P < 0.05, “**” indicates P < 0.01
Fig. 7
Fig. 7
FHL2 suppress intramuscular adipocytes apoptosis. A-C RT-qPCR detects the expression of the apoptosis marker genes expression level after FHL2 overexpression; D Intramuscular adipocytes were transfected by FHL2 overexpression and VECTOR, collected, and stained by Annexin V-FITC/PI. Intramuscular adipocytes apoptosis phase distribution was analyzed by flow cytometry; E Intramuscular adipocytes apoptosis index was analyzed between FHL2 overexpression and VECTOR group; F-H RT-qPCR detects the expression of apoptosis relative genes after silencing FHL2; I Intramuscular adipocytes were transfected by silencing FHL2 and NC, collected and stained by Annexin V-FITC/PI. Intramuscular adipocytes apoptosis phase distribution was analyzed by flow cytometry; J Intramuscular adipocytes apoptosis index was analyzed between silencing FHL2 and NC group
Fig. 8
Fig. 8
FHL2 suppress subcutaneous adipocytes apoptosis. A-C RT-qPCR detects the expression of the apoptosis marker genes after silencing FHL2; D Subcutaneous adipocytes were transfected by FHL2 overexpression and VECTOR, collected, and stained by Annexin V-FITC/PI. Subcutaneous adipocytes apoptosis phase distribution was analyzed by flow cytometry; E Subcutaneous adipocytes apoptosis index was analyzed between FHL2 overexpression and VECTOR group; F-H RT-qPCR detects the expression of apoptosis marker genes after silencing FHL2; I Subcutaneous adipocytes were transfected by silencing FHL2 and NC, collected and stained by Annexin V-FITC/PI. Subcutaneous adipocytes apoptosis phase distribution was analyzed by flow cytometry; J Subcutaneous adipocytes apoptosis index was analyzed between silencing FHL2 and NC group
Fig. 9
Fig. 9
Effects of gene FHL2 on the development of subcutaneous and intramuscular adipocytes in goats

References

    1. Ottaviani E, Malagoli D, Franceschi C. The evolution of the adipose tissue: a neglected enigma. Gen Comp Endocrinol. 2011;174(1):1–4. - PubMed
    1. Coelho M, Oliveira T, Fernandes R. Biochemistry of adipose tissue: an endocrine organ. Arch Med Sci. 2013;9(2):191–200. - PMC - PubMed
    1. Halberg N, Wernstedt-Asterholm I, Scherer PE. The adipocyte as an endocrine cell. Endocrinol Metab Clin North Am. 2008;37(3):753–xi. - PMC - PubMed
    1. Liu R, Liu X, Bai X, Xiao C, Dong Y. A study of the regulatory mechanism of the CB1/PPARγ2/PLIN1/HSL pathway for fat metabolism in cattle. Front Genet. 2021;12:631187. - PMC - PubMed
    1. Anderson F, Pannier L, Pethick DW, Gardner GE. Intramuscular fat in lamb muscle and the impact of selection for improved carcass lean meat yield. Animal. 2015;9(6):1081–90. - PubMed

LinkOut - more resources