. 2024 Sep 11;19(1):27.
doi: 10.1186/s13008-024-00131-z.

Overexpression of ZFP69B promotes hepatocellular carcinoma growth by upregulating the expression of TLX1 and TRAPPC9

Affiliations

Overexpression of ZFP69B promotes hepatocellular carcinoma growth by upregulating the expression of TLX1 and TRAPPC9

Wei Xie et al. Cell Div. .

Abstract

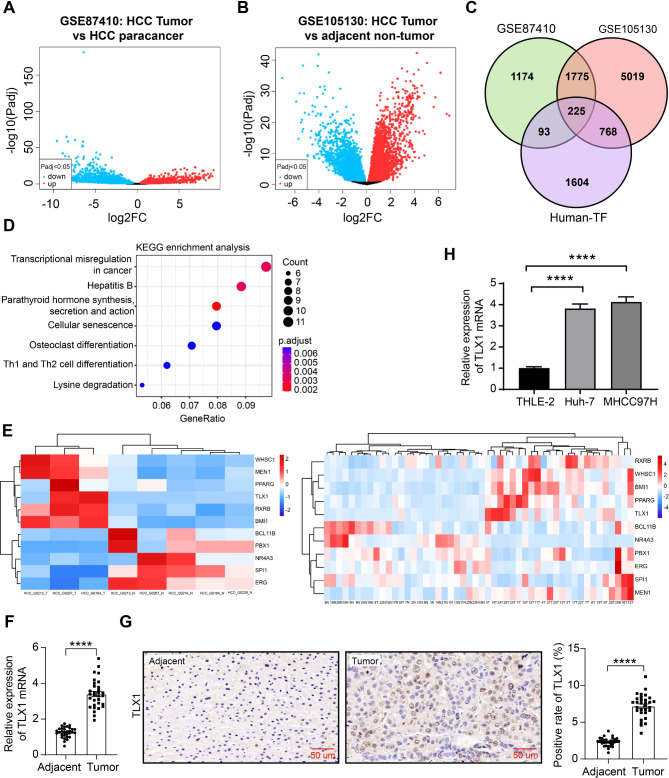
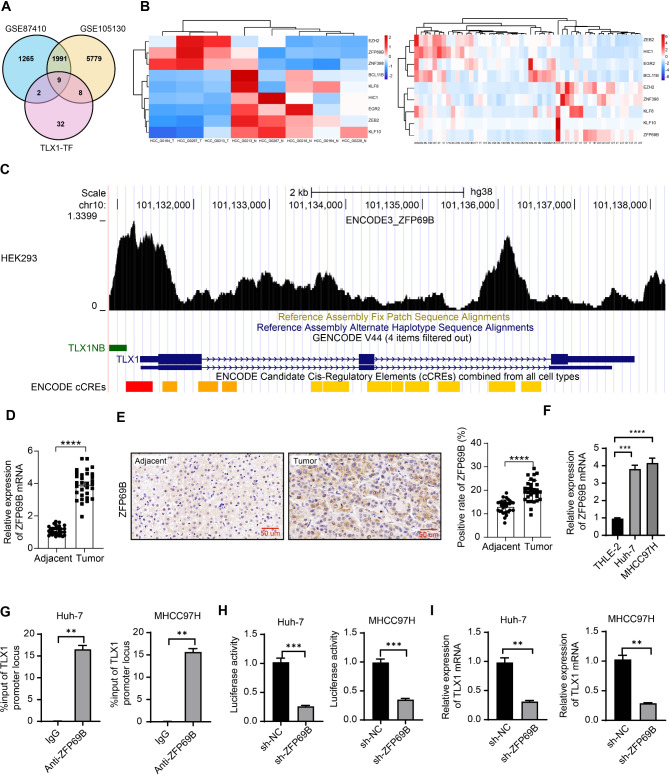
Background: T-cell leukemia homeobox protein 1 (TLX1) has been revealed as a hub transcription factor in leukemia, while its function in hepatocellular carcinoma (HCC) has not been well described. Here, we investigated the regulation and function of TLX1 in HCC.

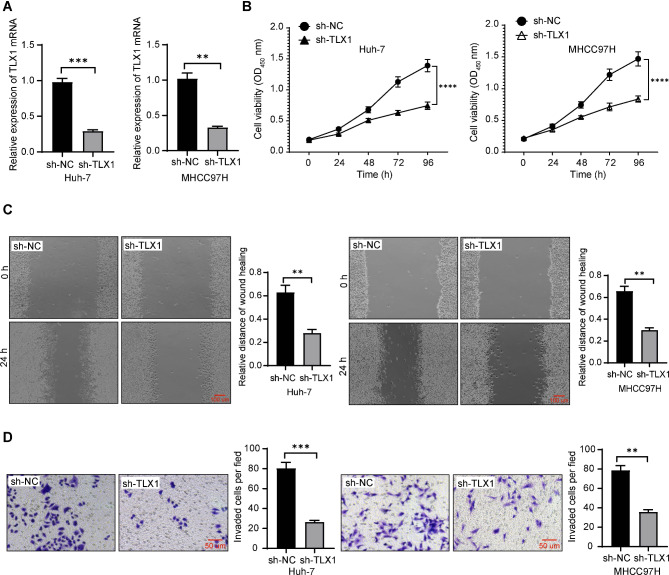
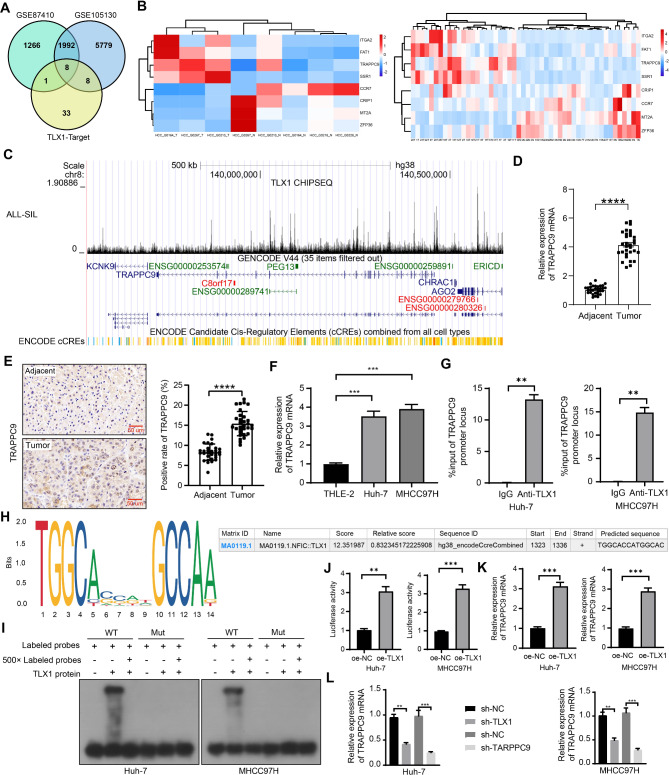
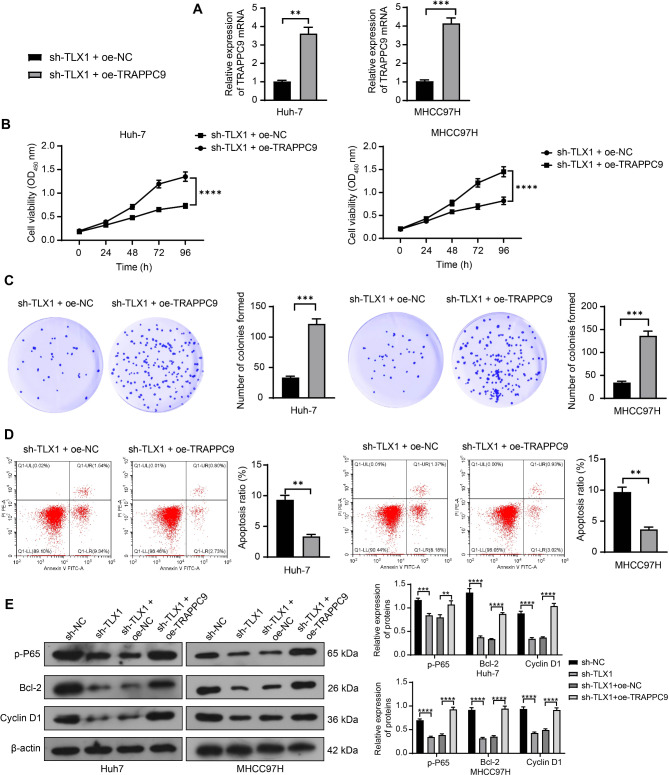
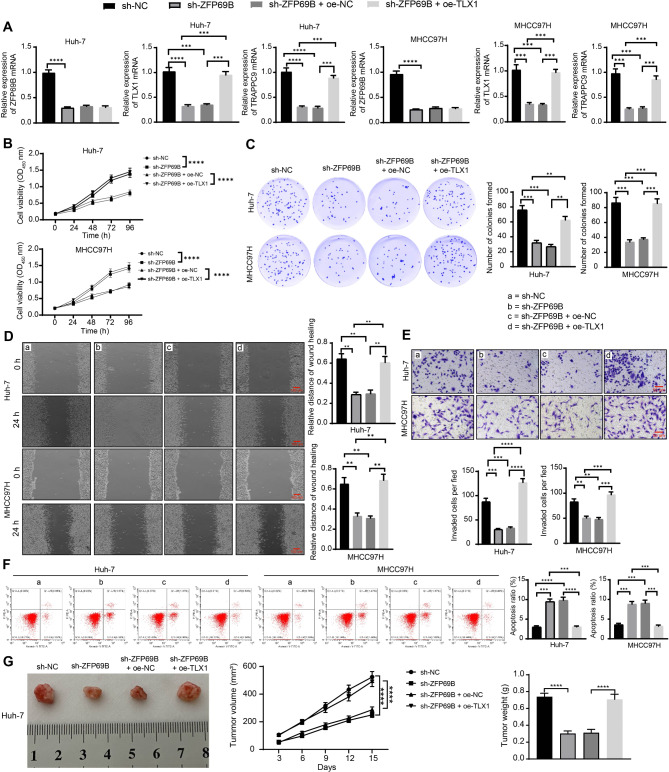
Methods: TLX1 and its possible upstream and downstream molecules in HCC were identified using bioinformatics tools, which were then verified by RT-qPCR assay. CCK-8, wound healing, and Transwell invasion assays were performed to detect the effects of TLX1 knockdown on HCC cells. The interactions between TLX1 and trafficking protein particle complex subunit 9 (TRAPPC9) or Zinc finger protein 69 homolog B (ZFP69B) were further probed by ChIP and luciferase reporter assays. Rescue experiments were finally conducted in vitro and in vivo.

Results: TLX1 was highly expressed in HCC cells, and the knockdown of TLX1 led to reduced malignant biological behavior of HCC cells. TLX1 bound to the promoter region of TRAPPC9, thereby promoting TRAPPC9 expression. Overexpression of TRAPPC9 attenuated the effect of TLX1 reduction on suppressing malignant behavior of HCC cells. ZFP69B was also highly expressed in HCC cells and bound to the promoter region of TLX1 to induce TLX1 expression. Knockdown of ZFP69B inhibited the viability and mobility of HCC cells in vitro and tumor growth in vivo, and overexpression of TLX1 rescued this inhibition.

Conclusion: These findings suggest that ZFP69B promotes the proliferation of HCC cells by directly upregulating the expression of TLX1 and the ensuing TRAPPC9.

Keywords: Hepatocellular carcinoma; TLX1; TRAPPC9; ZFP69B.


Conflict of interest statement

The authors declare no competing interests.

Figures

Fig. 1
Fig. 1
Overexpression of TLX1 is identified in HCC tissues and cell lines. (A) Transcriptome differences between HCC and paracancerous tissues in the GSE87410 dataset. (B) Transcriptome differences between HCC and adjacent non-tumor in the GSE105130 dataset. (C) Intersection of the above two datasets with human transcription factors and transcription cofactors in Jvenn. (D) KEGG pathway enrichment analysis of 225 intersecting genes. (E) Heatmaps of 11 intersecting genes enriched in the Transcriptional misregulation in cancer pathway in the GSE87410 and GSE105130 datasets. (F) mRNA expression of TLX1 in HCC tissues and their adjacent tissues was analyzed using RT-qPCR (n = 31). (G) positive staining of TLX1 in HCC tissues and their adjacent tissues was analyzed using immunohistochemistry (n = 31). (H) TLX1 mRNA expression in THLE-2, Huh-7, and MHCC97H cells was analyzed using RT-qPCR. Data represent the mean ± SEM of at least three independent experiments. ****p < 0.0001. Differences were tested using a paired t-test (F, G) and the one-way ANOVA (H)
Fig. 2
Fig. 2
Knockdown of TLX1 inhibits the biological behavior of Huh-7 and MHCC97H cells. (A) The mRNA expression of TLX1 in Huh-7 and MHCC97H cells infected with sh-NC or sh-TLX1 was analyzed using RT-qPCR. (B) The OD value of Huh-7 and MHCC97H cells was examined using CCK-8 assays. (C) The Huh-7 and MHCC97H cell migration was examined using a wound wound-healing assay. (D) The Huh-7 and MHCC97H cell invasion was examined using Transwell assay. Data represent the mean ± SEM of at least three independent experiments. **p < 0.01, ***p < 0.001, ****p < 0.0001. Differences were tested using an unpaired t-test (A, C, D) and the two-way ANOVA (B)
Fig. 3
Fig. 3
TLX1 activates TRAPPC9 transcription in HCC cells. (A) The intersection of TLX1 downstream targets in hTFtarget and differentially expressed genes in the GSE87410 and GSE105130 datasets. (B) The heatmaps of 8 intersecting targets in the three datasets. (C) The binding relation between TLX1 and the TRAPPC9 promoter was predicted in the UCSC database. (D) Expression of TRAPPC9 mRNA in HCC tissues and their adjacent tissues was analyzed using RT-qPCR (n = 31). (E) positive staining of TRAPPC9 in HCC tissues and their adjacent tissues was analyzed using immunohistochemistry (n = 31). (F) Expression of TRAPPC9 mRNA in THLE-2, Huh-7, and MHCC97H was analyzed using RT-qPCR. (G) Enrichment of the TRAPPC9 promoter in HCC cells with anti-TLX1 antibody or anti-IgG control was analyzed using ChIP. (H) Jaspar database analysis of binding sites between TLX1 and the TRAPPC9 promoter (I) The binding between TLX1 and TRAPPC9 was assessed using EMSA. (J) The binding relation between TRAPPC9 and TLX1 was examined using a luciferase reporter assay. (K) Expression of TRAPPC9 mRNA in Huh-7 and MHCC97H infected with oe-TLX1 was analyzed using RT-qPCR. (L) TRAPPC9 mRNA expression after knockdown of TLX1 or TRAPPC9 in Huh-7 and MHCC97H cells was analyzed using RT-qPCR Data represent the mean ± SEM of at least three independent experiments. **p < 0.01, ***p < 0.001, ****p < 0.0001. Differences were tested using t-tests (D, E, G, J, K) and the one-way ANOVA (F, L)
Fig. 4
Fig. 4
Overexpression of TRAPPC9 overturns the effects of TLX1 knockdown on Huh-7 and MHCC97H cells. (A) Expression of TRAPPC9 mRNA in Huh-7 and MHCC97H in response to sh-TLX1 + oe-NC or sh-TLX1 + oe-TRAPPC9 was analyzed using RT-qPCR. (B) The viability of Huh-7 and MHCC97H cells was examined using CCK-8 assays. (C) The colony formation of Huh-7 and MHCC97H cells was determined using colony formation assays. (DD) The cell apoptosis of Huh-7 and MHCC97H cells was determined using flow cytometry. (E) The protein expression of p-P65, Bcl-2, and Cyclin D1 in Huh-7 and MHCC97H cells was determined using western blot analysis. Data represent the mean ± SEM of at least three independent experiments. **p < 0.01, ***p < 0.001, ****p < 0.0001. Differences were tested using an unpaired t-test (A, C, D) and the two-way ANOVA (B, E)
Fig. 5
Fig. 5
ZFP69B transcriptionally activates TLX1 expression in HCC cells. (A) The intersection of TFs with binding sites in the TLX1 promoter and enhancer regions downloaded on GeneCards and differentially expressed genes in the GSE87410 and GSE105130 datasets. (B) The heatmaps of intersecting TF expression in the GSE87410 and GSE105130 datasets. (C) The ZFP69B binding peaks on the TLX1 promoter were downloaded from the UCSC database. (D) Expression of ZFP69B mRNA in HCC tissues and their adjacent tissues was examined using RT-qPCR (n = 31). (E) positive staining of ZFP69B in HCC tissues and their adjacent tissues was analyzed using immunohistochemistry (n = 31). (F) ZFP69B mRNA in THLE-2, Huh-7, and MHCC97H cells was examined using RT-qPCR. (G) Enrichment of the TLX1 promoter in HCC cells with anti-ZFP69B antibody or anti-IgG control was analyzed using ChIP. (H) The binding relation between ZFP69B and TLX1 was examined using a luciferase reporter assay. (I) TLX1 mRNA in Huh-7 and MHCC97H cells infected with sh-ZFP69B was examined using RT-qPCR. Data represent the mean ± SEM of at least three independent experiments. **p < 0.01, ***p < 0.001, ****p < 0.0001. Differences were tested using a t-test (D, E, G, H, I) and the one-way ANOVA (F)
Fig. 6
Fig. 6
Knockdown of ZFP69B inhibits HCC progression by blocking the TLX1/TRAPPC9 signaling. (A) The mRNA expression of ZFP69B, TLX1, and TRAPPC9 in HCC cells infected with sh-NC, sh-ZFP69B, sh-ZFP69B + oe-NC or sh-ZFP69B + oe-TLX1 was examined using RT-qPCR. (B) The viability of HCC cells was examined using CCK-8 assays. (C) The colony formation of HCC cells was determined using colony formation assays. (D) The migration of HCC cells was examined using a wound wound-healing assay. (E) The invasion of HCC cells was examined using Transwell invasion assays. (F) The cell apoptosis of HCC cells was determined using flow cytometry. (G) The volume and weight of xenografts of tumor-bearing mice. Data represent the mean ± SEM of at least three independent experiments or five biological replicates. **p < 0.01, ***p < 0.001, ****p < 0.0001. Differences were tested using the one-way (A, C, D, E, F) or two-way ANOVA (B, G)

Similar articles

References

    1. Sung H, Ferlay J, Siegel RL, et al. Global Cancer statistics 2020: GLOBOCAN estimates of incidence and Mortality Worldwide for 36 cancers in 185 countries. CA Cancer J Clin. 2021;71(3):209–49. 10.3322/caac.21660 - DOI - PubMed
    1. Ito T, Nguyen MH. Perspectives on the underlying etiology of HCC and its effects on Treatment outcomes. J Hepatocell Carcinoma. 2023;10:413–28. 10.2147/JHC.S347959 - DOI - PMC - PubMed
    1. Vogel A, Meyer T, Sapisochin G, Salem R, Saborowski A. Hepatocellular carcinoma. Lancet. 2022;400(10360):1345–62. 10.1016/S0140-6736(22)01200-4 - DOI - PubMed
    1. Chakraborty E, Sarkar D. Emerging therapies for Hepatocellular Carcinoma (HCC). Cancers (Basel). 2022; 14(11). - PMC - PubMed
    1. Brown ZJ, Tsilimigras DI, Ruff SM, et al. Management of Hepatocellular Carcinoma: a review. JAMA Surg. 2023;158(4):410–20. 10.1001/jamasurg.2022.7989 - DOI - PubMed

LinkOut - more resources