. 2024 Nov 19;123(22):3863-3870.
doi: 10.1016/j.bpj.2024.09.011. Epub 2024 Sep 11.

Unraveling the hydration dynamics of ACC1-13K24 with ATP: From liquid to droplet to amyloid fibril

Affiliations

Unraveling the hydration dynamics of ACC1-13K24 with ATP: From liquid to droplet to amyloid fibril

Sampad Bag et al. Biophys J. .

Abstract

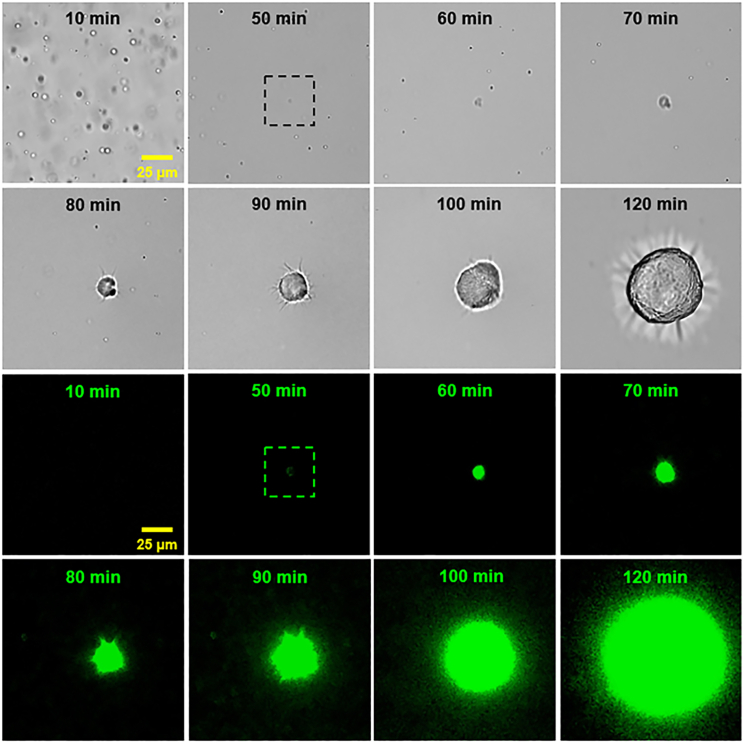
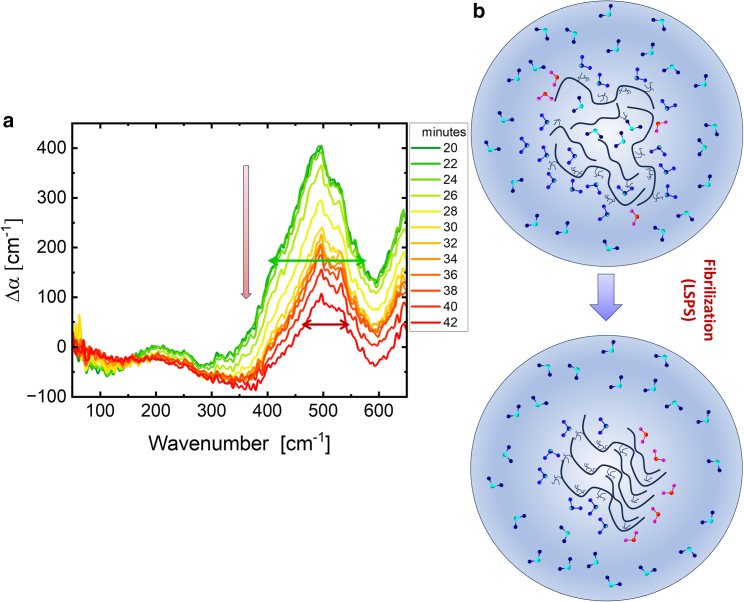
In order to achieve a comprehensive understanding of protein aggregation processes, an exploration of solvation dynamics, a key yet intricate component of biological phenomena, is mandatory. In the present study, we used Fourier transform infrared spectroscopy and terahertz spectroscopy complemented by atomic force microscopy and kinetic experiments utilizing thioflavin T fluorescence to elucidate the changes in solvation dynamics during liquid-liquid phase separation and subsequent amyloid fibril formation, the latter representing a transition from liquid to solid phase separation. These processes are pivotal in the pathology of neurodegenerative disorders such as Alzheimer's and Parkinson's diseases. We focus on the ACC1-13K24-ATP protein complex, which undergoes fibril formation followed by droplet generation. Our investigation reveals the importance of hydration as a driving force in these processes, offering new insights into the molecular mechanisms at play.


Conflict of interest statement

Declaration of interests The authors declare no competing interests.

Figures

Figure 1
Figure 1
ACC1–13K24 peptide forming an amyloid coaggregate with ATP, the formation of which is preceded by LLPS. (a) Kinetics of changes in ThT fluorescence intensity (red and orange trajectories) and optical density (black and gray trajectories) measured for a freshly prepared sample containing ACC1–13K24 peptide and ATP and a control sample containing the peptide but no ATP (1 mg/mL ACC1–13K24, 1 ATP per 3 lysine residues [if used], 20 μM ThT, H2O [pH 6.5]; gentle shaking, 37°C). (b) Sample containing ACC1–13K24 peptide and ATP prepared as in case (a) observed by light microscopy (observations made at room temperature, no shaking) under normal light (top) or ThT fluorescence excitation light (bottom) shortly after mixing the peptide with ATP (left) or for the mature ACC1–13K24-ATP coaggregate (right). (c) FT-IR-ATR spectrum in the range of the amide I and amide II bands measured for the washed, mature ACC1–13K24-ATP coaggregate. (d) Amplitude AFM image of the washed, mature ACC1–13K24-ATP coaggregate. The inset shows height profiles for several selected fibrils, obtained from the corresponding height data.
Figure 2
Figure 2
Transition from ThT-inactive ACC1–13K24-ATP droplets into ThT-active amyloid aggregates, visualized by bright-field optical microscopy. Observations under visible light (top) and ThT fluorescence excitation light (bottom) for an incubated sample containing ACC1–13K24 peptide and ATP (1 mg/mL ACC1–13K24, 1 ATP per 3 lysine residues, 20 μM ThT, H2O [pH 6.5]; no shaking, 37°C). The box with the dotted line (images marked “50 min”) indicates the first appearance of an aggregate, as observed in fluorescence as a bright spot.
Figure 3
Figure 3
Terahertz fingerprint and schematic illustration of the LLPS process of the ACC1–13K24 and ATP mixture: (a) time series of Δα spectra of the ACC1–13K24 (1 mg/mL) combined with an ATP solution (0.71 mg/mL) by subtracting the initial absorption spectra (t = 0). The time series is shown here for the first 20 min with an interval of 2 min where we see the droplet formation. The error is on the order of 1%. Around 100–150 cm−1, we record a decrease in intensity highlighted with a red-shaded area. This is attributed to a loss of more weakly bound cavity-wrap water hydrating the hydrophobic parts of the protein. The peak centered at 500 cm−1 shows an increase in intensity and a broadening in linewidth. The narrow features are attributed to a coupled ATP protein peak. Via coupling of the ATP, protein and hydration water, we observe a considerable line broadening (b). The schematic (not generated from computational simulation) illustrates the formation of droplets from the ATP, protein-solvent mixtures (LLPS). In this depiction, red water molecules signify cavity-wrap hydration water, dark blue denotes bound hydration water, and the bicolor light blue-dark blue molecules indicate bulk water. Upon LLPS, we observe a decrease of the wrap water population and an increase in bound water while the liquid condensate (droplet) is formed.
Figure 4
Figure 4
Series of THz spectra upon liquid-solid phase separation of the ACC1–13K24-ATP mixture: (a) Time series of difference (Δα) spectra of ACC1–13K24 peptide (1 mg/mL) solvated in an ATP solution (0.71 mg/mL). Each spectrum shows the change in absorption at a given time point (t) compared to the initial absorption spectrum of the diluted mixture (t = 0). The error is on the order of 1%. We display here the spectra in the time interval between 20 and 42 min, i.e., when we observe liquid-liquid phase separation (LLPS) and subsequently the formation of fibrils in the droplets. We observe changes for two major absorption features: an increase of the cavity-wrap band around 150 cm−1 and a decrease of the peak centered at 500 cm−1 with a narrowing of its width, representing a decrease in bound hydration water forming hydrogen bonds with the protein. (b) The schematic (not generated from computational simulation) illustrates the transformation of droplets into fibrils, a process referred to as liquid-to-solid phase separation (LSPS). During fibril formation, the proteins form densely packed parallel β sheet structures. This is accompanied by “drying,” i.e., a loss of bound water and the exposure of the less hydrophilic regions of the fibrils to the surrounding water. Consequently, the minimum around 150 cm−1 is no longer visible, and we also observe a decrease in the band centered at 500 cm−1 along with a line narrowing.
Figure 5
Figure 5
Time series of ATR absorption difference spectra of the polylysine protein (1 mg/mL) solvated in an ATP solution (0.71 mg/mL). We plot Δα, i.e., the change in THz absorption after a time delay (t) and the initial absorption spectra (t = 0).
Figure 6
Figure 6
Solvation thermodynamics: the schematic elucidates the mechanisms underlying droplet formation. We propose that the following two thermodynamic driving forces contribute: 1) an increase in entropy from the release of entropically unfavorable cavity-wrap hydration water and 2) an enthalpic gain by the retained bound water upon protein condensation. The evolution from droplet to fibril formation is further facilitated by an entropy increase, resulting from the expulsion of water molecules initially confined in the droplet, and an overcompensation of the enthalpic unfavorable loss of bound water molecules compared to the enthalpic gain by protein-protein interactions, mostly due to interstrand H-bonding.

Similar articles

Cited by

References

    1. Peng P.-H., Hsu K.-W., Wu K.-J. Liquid-liquid phase separation (LLPS) in cellular physiology and tumor biology. Am. J. Cancer Res. 2021;11:3766–3776. - PMC - PubMed
    1. Wang F., Zhang Y. Physiology and pharmacological targeting of phase separation. J. Biomed. Sci. 2024;31:11. - PMC - PubMed
    1. Babinchak W.M., Surewicz W.K. Liquid–liquid phase separation and its mechanistic role in pathological protein aggregation. J. Mol. Biol. 2020;432:1910–1925. - PMC - PubMed
    1. Hayashi Y., Ford L.K., et al. Zhang M. Liquid-liquid phase separation in physiology and pathophysiology of the nervous system. J. Neurosci. 2021;41:834–844. - PMC - PubMed
    1. Berson J.F., Harper D.C., et al. Marks M.S. Pmel17 initiates premelanosome morphogenesis within multivesicular bodies. Mol. Biol. Cell. 2001;12:3451–3464. - PMC - PubMed

Publication types

MeSH terms

LinkOut - more resources