. 2024 Aug 31;13(8):4062-4084.
doi: 10.21037/tcr-24-147. Epub 2024 Aug 26.

Integrative analysis of the role of the DPH gene family in hepatocellular carcinoma and expression validation

Affiliations

Integrative analysis of the role of the DPH gene family in hepatocellular carcinoma and expression validation

Xiaojin Gao et al. Transl Cancer Res. .

Abstract

Background: The diphthamide (DPH) gene family is a group of genes that encode a set of enzymes that specifically modify eukaryotic elongation factor 2 (eEF2). Although previous studies have shown a link between the DPH genes (DPHs) and carcinogenesis, it is still unknown how the DPHs affect hepatocellular carcinoma (HCC). This study aimed to describe the expression, clinical significance, and potential mechanisms of DPHs in HCC.

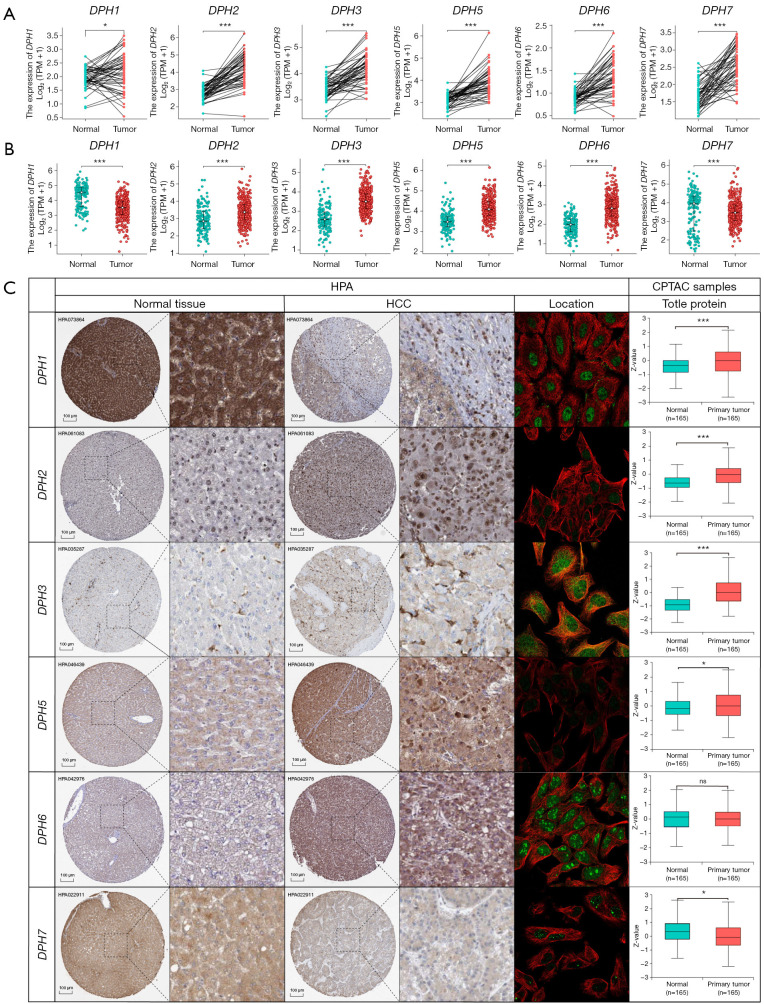
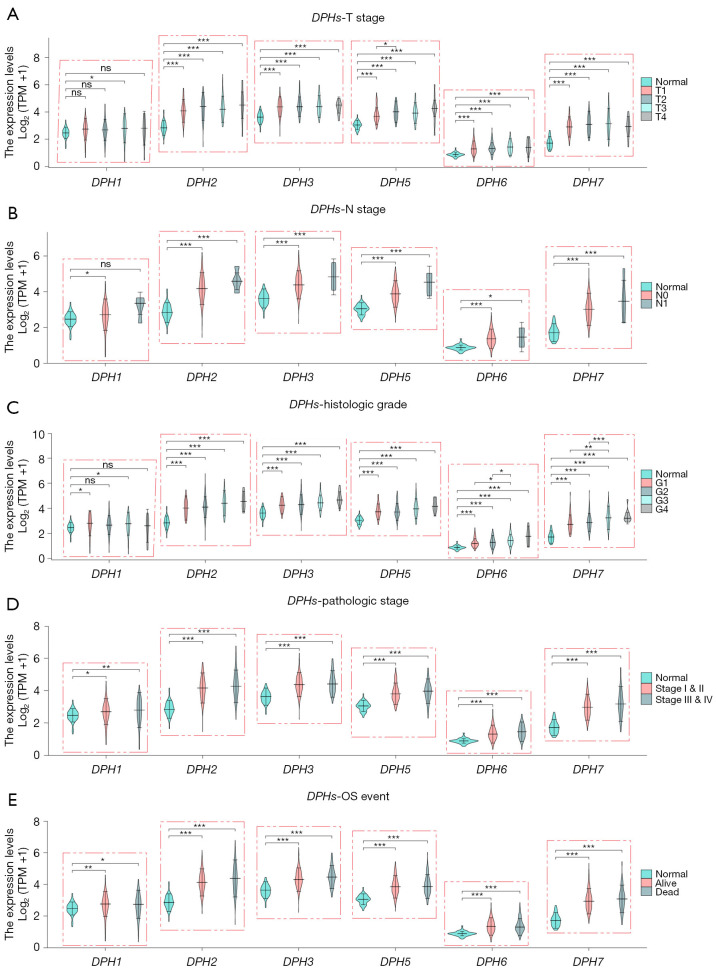
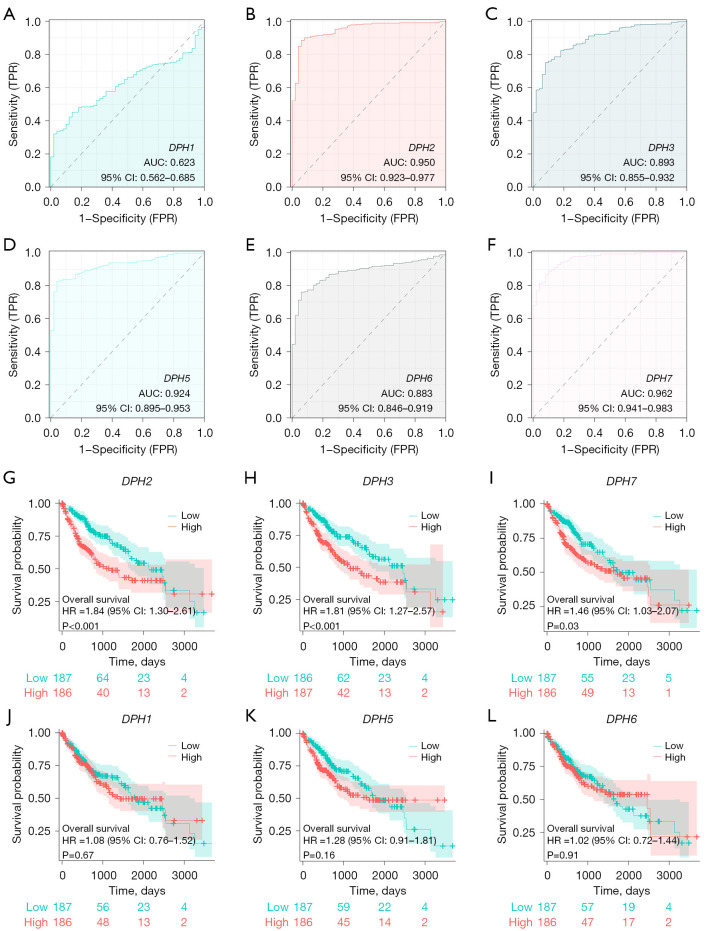
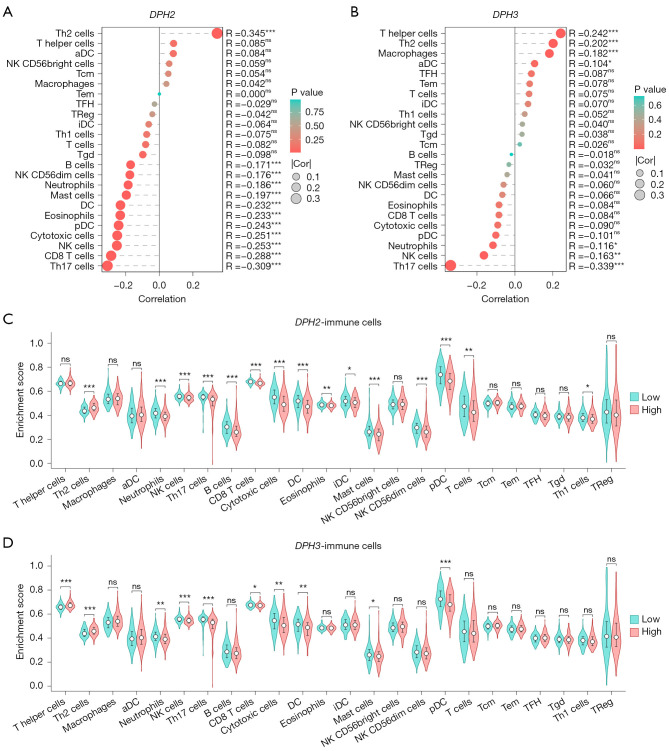
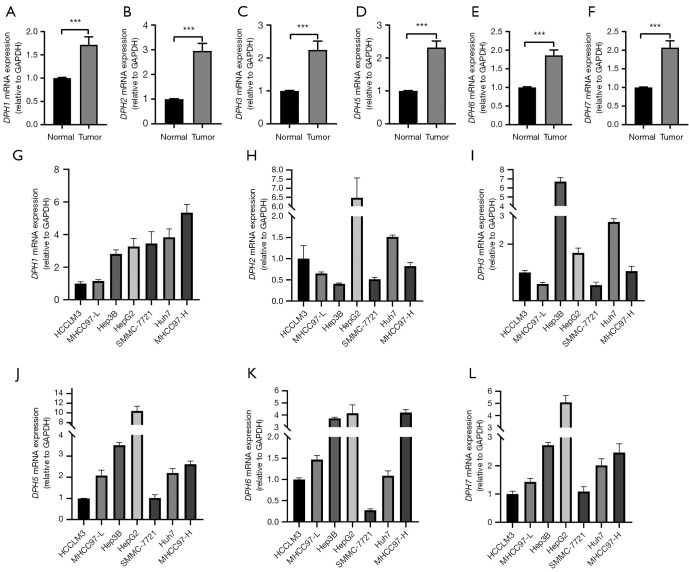
Methods: Real-time quantitative polymerase chain reaction (RT-qPCR), Genotype-Tissue Expression (GTEx), and The Cancer Genome Atlas (TCGA) databases were utilized to research the expression of DPHs in HCC. The relationship between the expression of DPHs and the clinicopathological characteristics of HCC patients was investigated using TCGA data, and their diagnostic value was evaluated using receiver operating characteristic (ROC) curves and their prognostic value was analyzed using Kaplan-Meier curves and univariate and multivariate Cox regression analyses. Potential reasons for the upregulation of DPH2 and DPH3 (DPH2,3) expression in HCC were analyzed using multiple databases. Additionally, this study also explored the potential biological functions of DPH2,3 in HCC via gene sets enrichment analysis (GSEA). Correlation analysis of DPH2,3 expression with immune-related genes and immune checkpoints was performed using Spearman's correlation analysis, and single-sample GSEA was used to assess the distribution of tumor-infiltrating immune cell types.

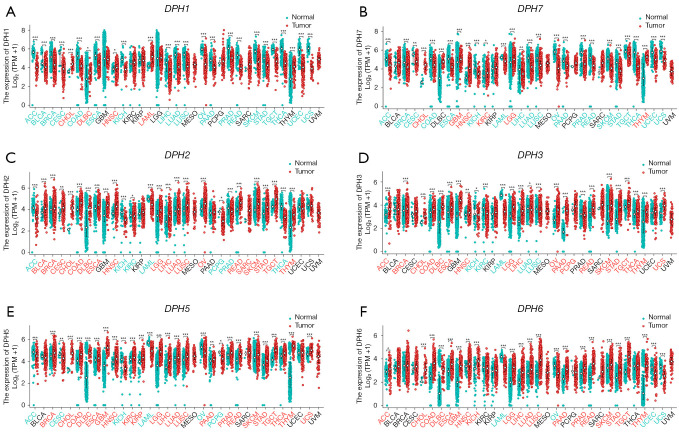
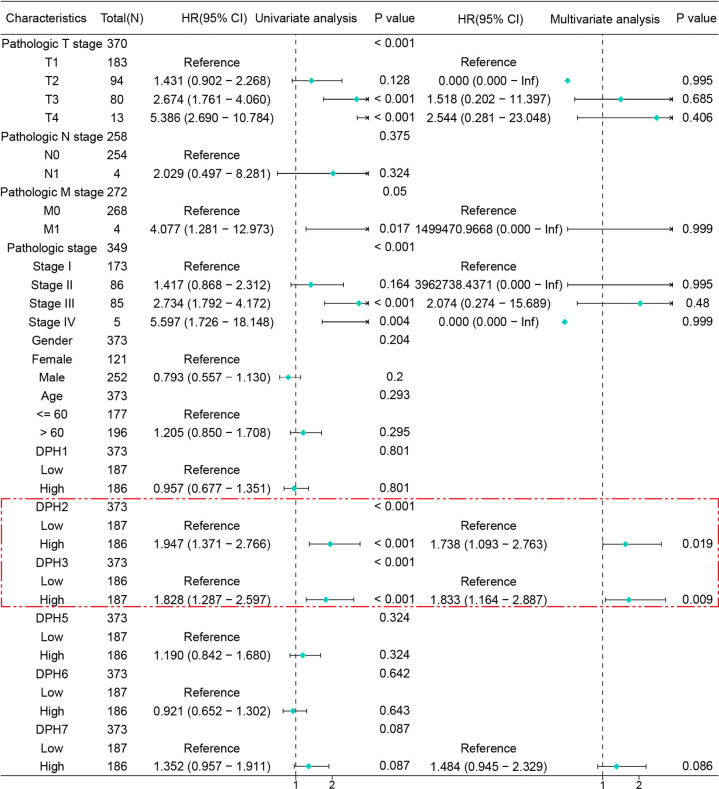
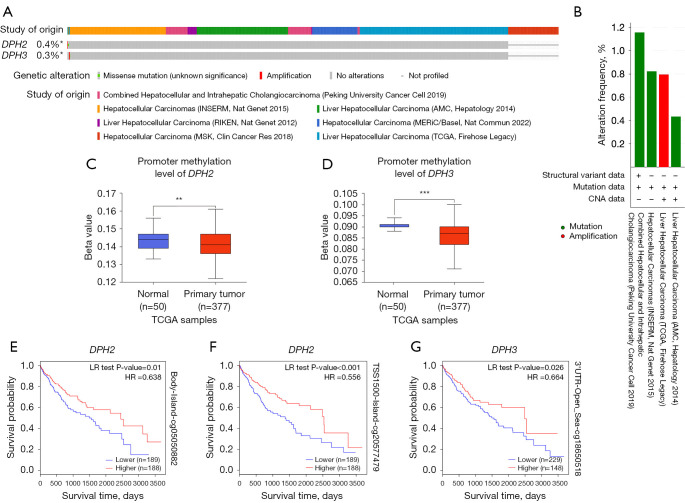
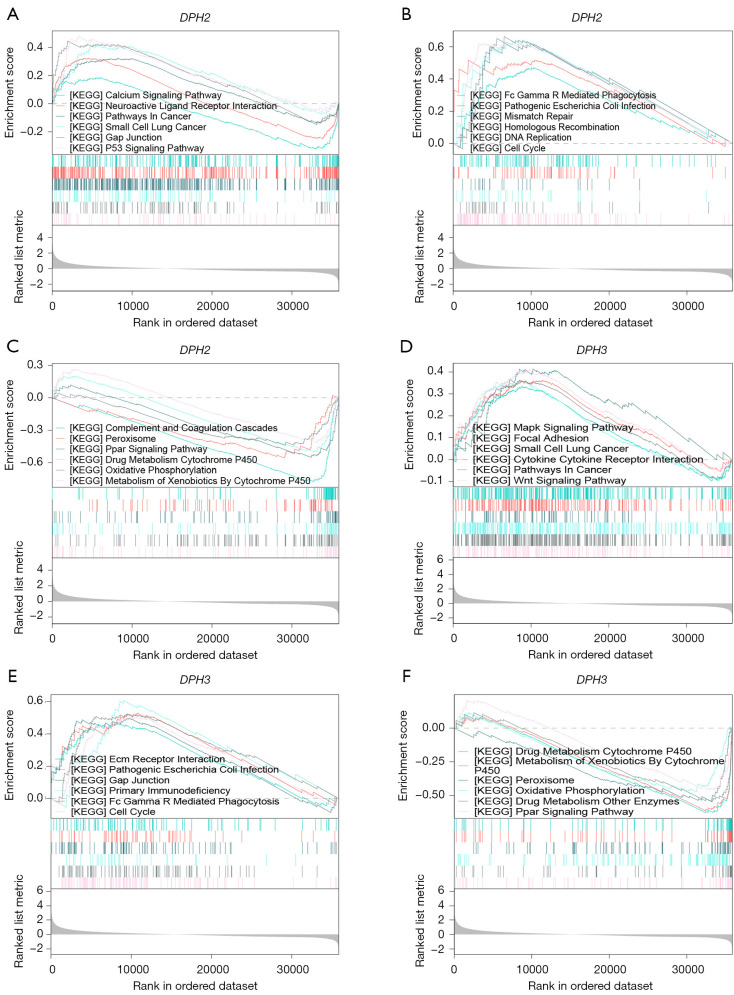
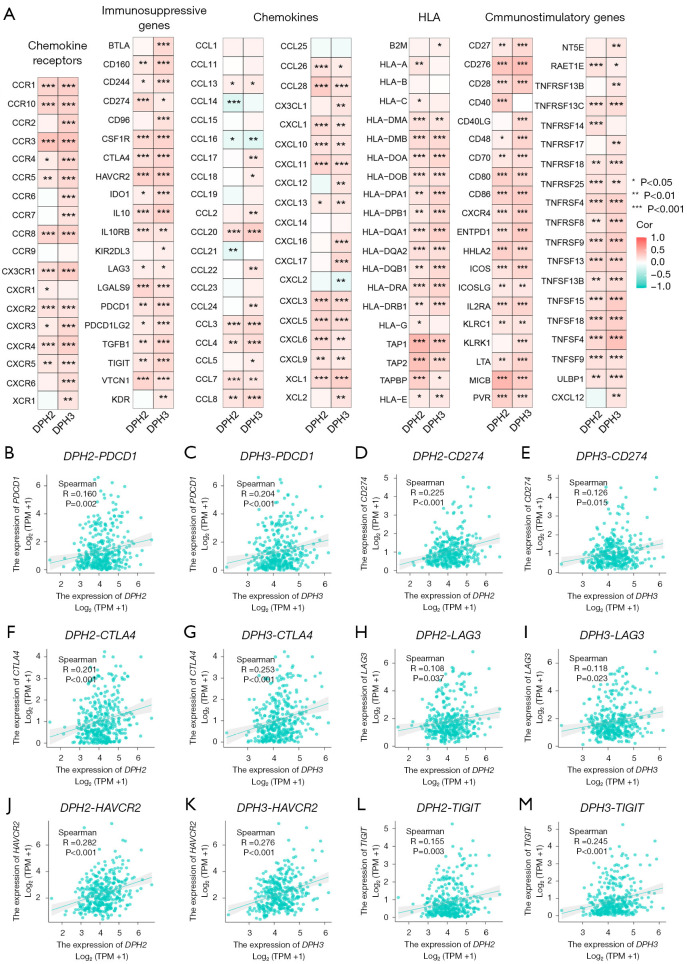
Results: DPH1,7 expression was downregulated in tumor tissues while DPH2,3,5,6 expression was upregulated and showed a similar expression pattern in HCC. The results of the ROC analysis suggested that DPHs had valuable diagnostic properties in HCC. Kaplan-Meier analysis demonstrated that DPH2,3,7 had prognostic predictive value in HCC. Furthermore, univariate and multivariate Cox regression suggested that DPH2,3 was an independent predictive factor for HCC. GSEA analysis revealed that DPH2,3 might be tightly associated with Pathways in cancer, cell cycles, Fc gamma R mediated phagocytosis, etc. Additionally, DPH2,3 expression and numerous immune-related genes showed a positive connection, including chemokines receptor genes, immunosuppressive genes, chemokines genes, human leukocyte antigen (HLA) genes, and immunostimulatory genes. Further analysis of the association between 24 immune infiltrating cells and DPH2,3 revealed the greatest negative correlation between natural killer (NK) cells and Th17 cells, but the greatest positive correlation with Th2 cells.

Conclusions: DPHs significantly influence the development and progression of HCC. DPH2,3 has significant diagnostic and prognostic potential and may be a promising target for immunotherapy.

Keywords: Diphthamide gene family (DPH gene family); hepatocellular carcinoma (HCC); immune cells; immune checkpoints; tumor microenvironment (TME).


Conflict of interest statement

Conflicts of Interest: All authors have completed the ICMJE uniform disclosure form (available at: https://tcr.amegroups.com/article/view/10.21037/tcr-24-147/coif). The authors have no conflicts of interest to declare.

Figures

Figure 1
Figure 1
The expression of DPHs in pan-cancer. (A) DPH1; (B) DPH7; (C) DPH2; (D) DPH3; (E) DPH5; (F) DPH6. *, P<0.05; **, P<0.01; ***, P<0.001. Blue indicates that normal tissue exhibits higher levels of expression than cancerous tissue, whereas red indicates that cancerous tissue exhibits higher levels of expression than normal tissue in the X-axis typeface. DPHs, DPH genes; TPM, transcripts per-million; DPH, diphthamide.
Figure 2
Figure 2
DPHs mRNA and protein expression in HCC. (A,B) Expression of DPHs mRNA in HCC and normal tissues (paired and unpaired); (C) protein expression and immunofluorescence localization data of DPHs in HPA and UALCAN, CPTAC databases (HPA: immunohistochemistry ×40 images are presented). DPH1 (normal tissue: https://www.proteinatlas.org/ENSG00000108963-DPH1/tissue/liver; HCC: https://www.proteinatlas.org/ENSG00000108963-DPH1/pathology/liver+cancer); DPH2 (normal tissue: https://www.proteinatlas.org/ENSG00000132768-DPH2/tissue/liver; HCC: https://www.proteinatlas.org/ENSG00000132768-DPH2/pathology/liver+cancer); DPH3 (normal tissue: https://www.proteinatlas.org/ENSG00000154813-DPH3/tissue/liver; HCC: https://www.proteinatlas.org/ENSG00000154813-DPH3/pathology/liver+cancer); DPH5 (normal tissue: https://www.proteinatlas.org/ENSG00000117543-DPH5/tissue/liver; HCC: https://www.proteinatlas.org/ENSG00000117543-DPH5/pathology/liver+cancer); DPH6 (normal tissue: https://www.proteinatlas.org/ENSG00000134146-DPH6/tissue/liver; HCC: https://www.proteinatlas.org/ENSG00000134146-DPH6/pathology/liver+cancer); DPH7 (normal tissue: https://www.proteinatlas.org/ENSG00000148399-DPH7/tissue/liver; HCC: https://www.proteinatlas.org/ENSG00000148399-DPH7/pathology/liver+cancer). Subcellular location images are presented. DPH1: https://www.proteinatlas.org/ENSG00000108963-DPH1/subcellular; DPH2: https://www.proteinatlas.org/ENSG00000132768-DPH2/subcellular; DPH3: https://www.proteinatlas.org/ENSG00000154813-DPH3/subcellular; DPH5: https://www.proteinatlas.org/ENSG00000117543-DPH5/subcellular; DPH6: https://www.proteinatlas.org/ENSG00000134146-DPH6/subcellular; DPH7: https://www.proteinatlas.org/ENSG00000148399-DPH7/subcellular. ns, P≥0.05; *, P<0.05; ***, P<0.001. DPHs, DPH genes; HCC, hepatocellular carcinoma; HPA, Human Protein Atlas; UALCAN, The University of Alabama Cancer database; CPTAC, Clinical Proteomic Tumor Analysis Consortium; TPM, transcripts per-million; DPH, diphthamide.
Figure 3
Figure 3
Correlation between DPHs expression and clinicopathologic features in HCC. Violin plots of DPHs expression were summarized according to (A) T staging, (B) N staging, (C) histologic grade, (D) pathologic stage, and (E) OS event. ns, P≥0.05; *, P<0.05; **, P<0.01; ***, P<0.001. DPHs, DPH genes; HCC, hepatocellular carcinoma; OS, overall survival; TPM, transcripts per-million; DPH, diphthamide.
Figure 4
Figure 4
Diagnostic and prognostic value of DPHs in HCC. (A-F) ROC analysis indicates that DPHs expression has a good diagnostic value in HCC. (G-L) Kaplan-Meier curves showed the relationship between DPHs expression and OS, and the results indicated that the DPH2,3,7 high expression group had a worse prognosis. DPHs, DPH genes; HCC, hepatocellular carcinoma; ROC, receiver operating characteristic; OS, overall survival; TPR, true positive rate; FPR, false positive rate; AUC, area under curve; CI, confidence interval; HR, hazard ratio; DPH, diphthamide.
Figure 5
Figure 5
Univariate Cox regression analyses showed that DPH2,3 was significantly associated with OS, and multivariate Cox regression analyses showed that DPH2,3 was an independent prognostic factor. OS, overall survival; HR, hazard ratio; CI, confidence interval; DPH, diphthamide.
Figure 6
Figure 6
Analysis of DPH2,3 gene mutation and methylation status suggests that DPH2,3 high expression in HCC may be caused by its demethylation and affects its survival probability. (A,B) DPH2,3 gene mutation data of HCC patients from the cBioPortal database (*, not all samples are profiled). (C) DPH2 (**, P<0.01) and (D) DPH3 (***, P<0.001) methylation data from the TCGA database. Kaplan-Meier survival analysis of (E) DPH2 Body-Island-cg05050882, (F) DPH2 TSS1500-Island-cg20577479, and (G) DPH3 3'UTR-Open_Sea-cg18650518 methylation sites from the MethSurv. HCC, hepatocellular carcinoma; TCGA, the cancer genome atlas; CNA, copy-number alterations; HR, hazard ratio; LR, likelihood ratio; DPH, diphthamide.
Figure 7
Figure 7
Enrichment plots from GSEA. Results of differential enrichment of gene in KEGG pathways with (A-C) DPH2 and (D-F) DPH3. GSEA, gene sets enrichment analysis; KEGG, Kyoto Encyclopedia of Genes and Genomes; DPH, diphthamide.
Figure 8
Figure 8
DPH2,3 is significantly associated with immune-related genes. (A) Correlation of chemokine receptor genes, immunosuppressive genes, chemokine genes, human leukocyte antigen genes, and immunostimulatory genes with DPH2,3. DPH2,3 was positively correlated with (B,C) PD-1 (PDCD1), (D,E) PD-L1 (CD274), (F,G) CTLA-4, (H,I) LAG3, (J,K) HAVCR2 (TIM3) and (L,M) TIGIT. *, P<0.05; **, P<0.01; ***, P<0.001. HLA, human leukocyte antigen; DPH, diphthamide.
Figure 9
Figure 9
DPH2,3 correlates with immune cell infiltration in HCC. Correlation between DPH2 (A) and (B) DPH3 expression and abundance of 24 tumor-infiltrating immune cell types. Enrichment scores of (C) DPH2 and (D) DPH3 high and low expression groups with 24 immune cell types. ns, P≥0.05; *, P<0.05; **, P<0.01; ***, P<0.001. HCC, hepatocellular carcinoma; NK, natural killer; pDC, plasmacytoid dendritic cell; aDC, activated dendritic cell; DPH, diphthamide.
Figure 10
Figure 10
Expression of DPHs mRNA in HCC tissue samples and cell lines. (A-F) RT-qPCR analysis of DPHs mRNA expression in 18 HCC and normal liver tissue pairs. (G-L) RT-qPCR analysis of DPHs mRNA expression in 7 HCC cell lines. ***, P<0.001. DPHs, DPH genes; HCC, hepatocellular carcinoma; RT-qPCR, real-time quantitative polymerase chain reaction; DPH, diphthamide.

Similar articles

Cited by

References

    1. Ganesan P, Kulik LM. Hepatocellular Carcinoma: New Developments. Clin Liver Dis 2023;27:85-102. 10.1016/j.cld.2022.08.004 - DOI - PubMed
    1. Toh MR, Wong EYT, Wong SH, et al. Global Epidemiology and Genetics of Hepatocellular Carcinoma. Gastroenterology 2023;164:766-82. 10.1053/j.gastro.2023.01.033 - DOI - PubMed
    1. Siegel RL, Giaquinto AN, Jemal A. Cancer statistics, 2024. CA Cancer J Clin 2024;74:12-49. Erratum in: CA Cancer J Clin 2024;74:203. 10.3322/caac.21820 - DOI - PubMed
    1. Vogel A, Meyer T, Sapisochin G, et al. Hepatocellular carcinoma. Lancet 2022;400:1345-62. 10.1016/S0140-6736(22)01200-4 - DOI - PubMed
    1. Kulik L, El-Serag HB. Epidemiology and Management of Hepatocellular Carcinoma. Gastroenterology 2019;156:477-491.e1. 10.1053/j.gastro.2018.08.065 - DOI - PMC - PubMed

LinkOut - more resources