. 2024 Aug 31;13(8):3974-3995.
doi: 10.21037/tcr-23-2154. Epub 2024 Aug 12.

Unveiling the role of RARs in stomach adenocarcinoma: clinical implications and prognostic biomarkers

Affiliations

Unveiling the role of RARs in stomach adenocarcinoma: clinical implications and prognostic biomarkers

Hongyue Ren et al. Transl Cancer Res. .

Abstract

Background: Retinoic acid receptors (RARs) family are known to play a significant role in the occurrence and development of tumors. However, the relationship between RARs and stomach adenocarcinoma (STAD) has not yet been clearly identified. The aim of this study is to evaluate the expression profile and clinical value of the RARs family in STAD.

Methods: The expression level, clinical characteristics, prognostic value, immunity-related evaluations, genetic alteration and methylation site of RARs in STAD were explored using a series of online databases including gene expression profiling interactive analysis (GEPIA), tumor immune estimation resource (TIMER), University of Alabama at Birmingham cancer data (UALCAN), Human Protein Atlas (HPA), Kaplan-Meier plotter, gene set cancer analysis (GSCA), cBioPortal, MethSurv, GeneMANIA, LinkedOmics, Metascape, Search tool for the retrieval of interacting genes (STRING), tumor immune single-cell hub (TISCH) and cancer cell line encyclopedia (CCLE).

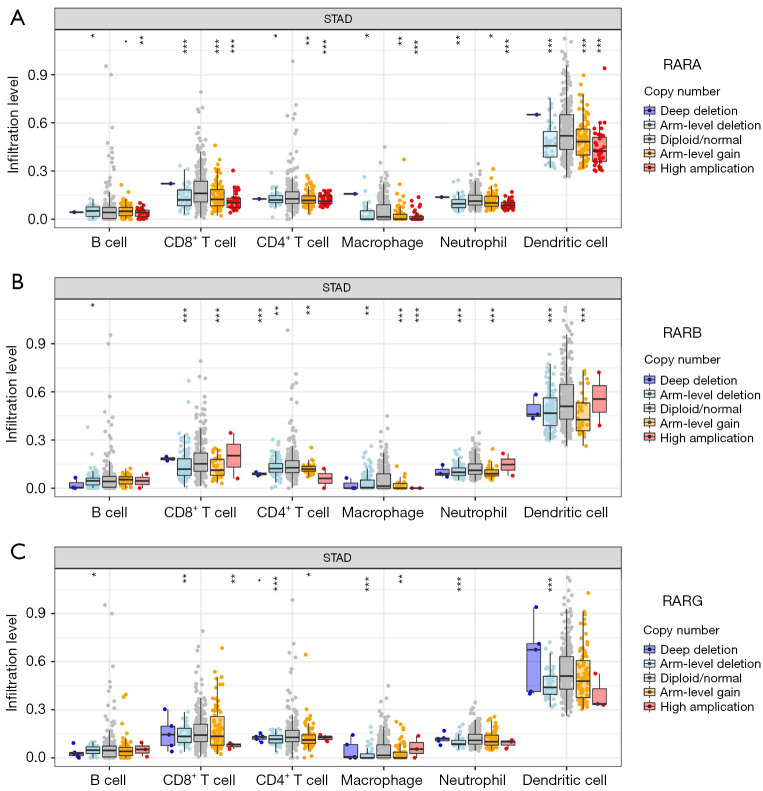
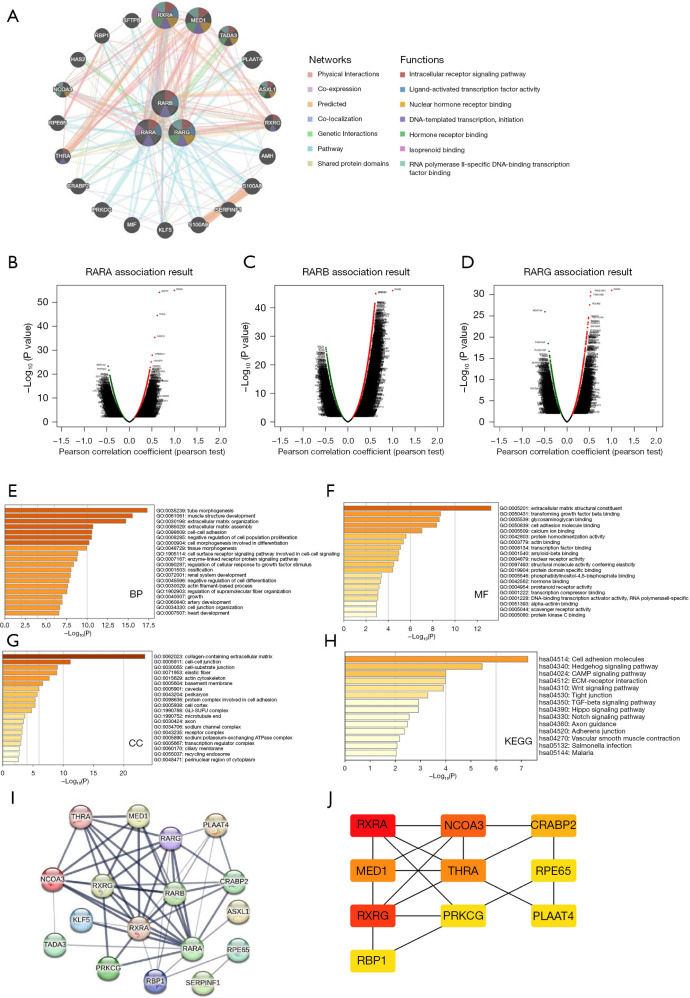
Results: We discovered dramatically increased expression of RARA and decreased expression of RARB in STAD tissues, and many clinical variables were closely related to RARs. Notably, higher expressions of RARA and RARB as well as lower expression of RARG correlated with worse overall survival (OS) for STAD patients. The clinical value of prognostic model indicated that RARs were identified to be potential prognostic biomarkers for STAD patients. Moreover, RARB was closely related to immune cell infiltration, which had effect on the role of RARB in STAD prognosis. And the genetic alteration of RARB was significantly associated with the longer disease-free survival (DFS) of STAD patients. Additionally, some CpG sites of the RARs family were related with the prognosis of STAD patients. Functional enrichment analyses indicated that several pathways in STAD might be pivotal pathways regulated by RARs. At the single-cell level, there was some extent of infiltration of tumor microenvironment-related cells in the RARs expression in STAD.

Conclusions: Our results evaluated the expression profile and clinical values of RARs in patients with STAD, which provided a basis for future in-depth exploration of the specific mechanisms of each member of RARs in STAD.

Keywords: Retinoic acid receptors family members (RARs family members); bioinformatics analysis; prognosis; stomach adenocarcinoma (STAD).


Conflict of interest statement

Conflicts of Interest: All authors have completed the ICMJE uniform disclosure form (available at https://tcr.amegroups.com/article/view/10.21037/tcr-23-2154/coif). The authors have no conflicts of interest to declare.

Figures

Figure 1
Figure 1
Transcriptional and protein levels of RARs in STAD. The mRNA transcription levels of RARs between STAD tissues and normal gastric tissues from GEPIA (A-C) and UALCAN (D-F) databases. T, tumor, N, normal tissue. *, P<0.05. (G,H) The protein levels of RARβ and RARγ in STAD using immunohistochemistry from HPA database. Images available at https://www.proteinatlas.org/ENSG00000077092-RARB/pathology/stomach+cancer#img and https://www.proteinatlas.org/ENSG00000172819-RARG/pathology/stomach+cancer#img (accessed on 22 May 2023). GEPIA, gene expression profiling interactive analysis; HPA, Human Protein Atlas; mRNA, messenger ribonucleic acid; RARs, retinoic acid receptors; STAD, stomach adenocarcinoma; TCGA, The Cancer Genome Atlas; UALCAN, University of Alabama at Birmingham cancer data.
Figure 2
Figure 2
Association between RARs mRNA expressions and STAD prognosis. The correlation between RARs mRNA expressions and STAD prognosis from GEPIA (A-F) and Kaplan-Meier plotter (G-L) databases. CI, confidence interval; GEPIA, gene expression profiling interactive analysis; HR, hazard ratio; mRNA, messenger ribonucleic acid; RARs, retinoic acid receptors; STAD, stomach adenocarcinoma; TPM, transcripts per million.
Figure 3
Figure 3
Prognostic signatures of RARs in STAD patients. (A) The prognostic model for OS of STAD patients including the dotted curve of risk score, survival status of the patients, and heatmap of the expression profiles of RARs. The OS of STAD patients for RARs using Kaplan-Meier survival analysis (B) and time-dependent ROC analysis (C). (D) The prognostic model for DFS of STAD patients. The DFS of STAD patients for RARs using Kaplan-Meier survival analysis (E) and time-dependent ROC analysis (F). AUC, area under the ROC curve; CI, confidence interval; DFS, disease-free survival; HR, hazard ratio; OS, overall survival; RARs, retinoic acid receptors; ROC, receiver operating characteristic; STAD, stomach adenocarcinoma.
Figure 4
Figure 4
Immune cells infiltration of RARs in STAD patients. (A) The correlations of RARs in STAD using the GEPIA database. The relationship between RARs and immune cell infiltration of STAD patients using the GSCA (B) and TIMER (C-E) databases. CD, cluster of differentiation; DC, dendritic cell; FDR, false discovery rate; GSCA, gene set cancer analysis; MAIT, mucosal associated invariant T; NK, natural killer; RARs, retinoic acid receptors; STAD, stomach adenocarcinoma; GEPIA, gene expression profiling interactive analysis; Tfh, follicular helper T cell; Th, helper T cell; TIMER, tumor immune estimation resource; Tr1, type 1 T regulatory cells.
Figure 5
Figure 5
The effect of SCNA for RARs on the infiltration levels of various immune cells. (A-C) The relationship of the SCNA of RARs family and the infiltration levels of six immune cells. *, P<0.05; **, P<0.01; ***, P<0.001. CD, cluster of differentiation; RARs, retinoic acid receptors; SCNA, somatic copy-number alterations; STAD, stomach adenocarcinoma.
Figure 6
Figure 6
Genetic alterations of RARs and their prognostic values of STAD patients using the cBioPortal database. (A,B) Frequency and type of genetic alterations of RARs in STAD. (C-E) The relationship between genetic alterations in RARs and the clinical characteristics of STAD. OS (F-H) and DFS (I-K) analyses of genetically altered and non-altered groups of RARs families in STAD. CNA, copy number alterations; NA, not available; RARs, retinoic acid receptors; STAD, stomach adenocarcinoma; OS, overall survival; DFS, disease-free survival.
Figure 7
Figure 7
RARs methylation sites and their prognostic significances in STAD patients. (A-C) The correlation between RARs and methylation status using UALCAN database. (D-F) Heat map for RARs methylation sites in STAD patients from MethSurv database. RARs, retinoic acid receptors; STAD, stomach adenocarcinoma; UALCAN, University of Alabama at Birmingham cancer data; TCGA, The Cancer Genome Atlas.
Figure 8
Figure 8
The correlations between RARs and STAD related signaling pathways using TCGA database. (A-F) The relationship between RARs and tumor proliferation as well as angiogenesis in STAD. RARs, retinoic acid receptors; STAD, stomach adenocarcinoma; TCGA, The Cancer Genome Atlas; TPM, transcripts per million; CI, confidence interval.
Figure 9
Figure 9
Co-expressed genes, associated enrichment pathways and protein-protein networks of RARs in STAD. (A) The RARs gene interaction network and related functions from GeneMANIA analysis. (B-D) Volcano maps of RARs family members with co-expressed genes in STAD using LinkedOmics. The red, green and black dots indicated up-regulated, down-regulated and non-differentially expressed genes, respectively. (E-H) GO enrichment and KEGG pathway analysis of RARs family members in STAD from Metascape. (I) The PPI networks analysis of RARs in patients with STAD from STRING database. (J) The top 10 hub targets using the CytoScape. BP, biological process; CC, cellular component; GO, Gene Ontology; KEGG, Kyoto Encyclopedia of Genes and Genomes; MF, molecular function; PPI, protein-protein interaction; RARs, retinoic acid receptors; STAD, stomach adenocarcinoma; STRING, search tool for the retrieval of interacting genes.
Figure 10
Figure 10
Single-cell functional analyses of RARs in STAD from TISCH. (A,B) The cell types and their distribution in STAD_GSE134520. (C-F) Distribution of RARs in different cells in STAD_GSE134520. DC, dendritic cell; RARs, retinoic acid receptors; STAD, stomach adenocarcinoma; TISCH, tumor immune single-cell hub.

References

    1. López MJ, Carbajal J, Alfaro AL, et al. Characteristics of gastric cancer around the world. Crit Rev Oncol Hematol 2023;181:103841. 10.1016/j.critrevonc.2022.103841 - DOI - PubMed
    1. Zhou D, Xiong S, Xiong J, et al. Integrated analysis of the microbiome and transcriptome in stomach adenocarcinoma. Open Life Sci 2023;18:20220528. 10.1515/biol-2022-0528 - DOI - PMC - PubMed
    1. Bray F, Laversanne M, Sung H, et al. Global cancer statistics 2022: GLOBOCAN estimates of incidence and mortality worldwide for 36 cancers in 185 countries. CA Cancer J Clin 2024;74:229-63. 10.3322/caac.21834 - DOI - PubMed
    1. Xie W, Yang T, Zuo J, et al. Chinese and Global Burdens of Gastrointestinal Cancers From 1990 to 2019. Front Public Health 2022;10:941284. 10.3389/fpubh.2022.941284 - DOI - PMC - PubMed
    1. Machlowska J, Baj J, Sitarz M, et al. Gastric Cancer: Epidemiology, Risk Factors, Classification, Genomic Characteristics and Treatment Strategies. Int J Mol Sci 2020;21:4012. 10.3390/ijms21114012 - DOI - PMC - PubMed

LinkOut - more resources