. 2024 Jul 31;27(9):110618.
doi: 10.1016/j.isci.2024.110618. eCollection 2024 Sep 20.

A novel pan-proteome array for high-throughput profiling of the humoral response to Treponema pallidum

Affiliations

A novel pan-proteome array for high-throughput profiling of the humoral response to Treponema pallidum

Joseph J Campo et al. iScience. .

Abstract

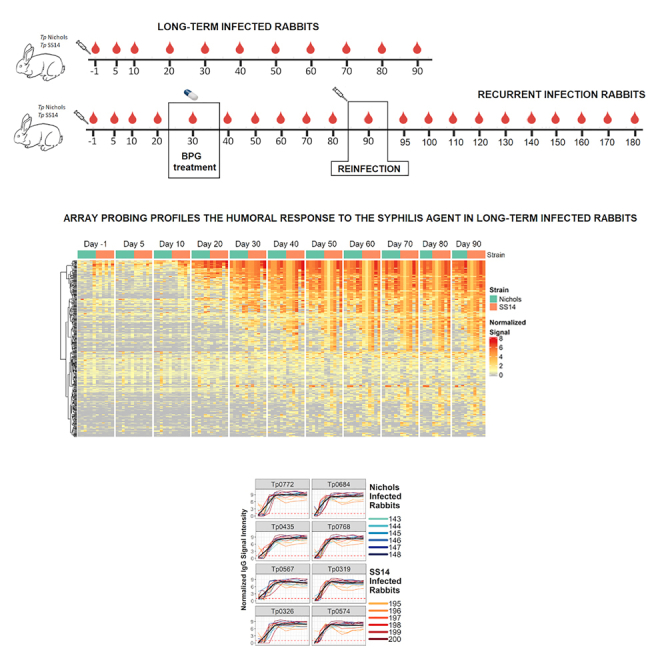
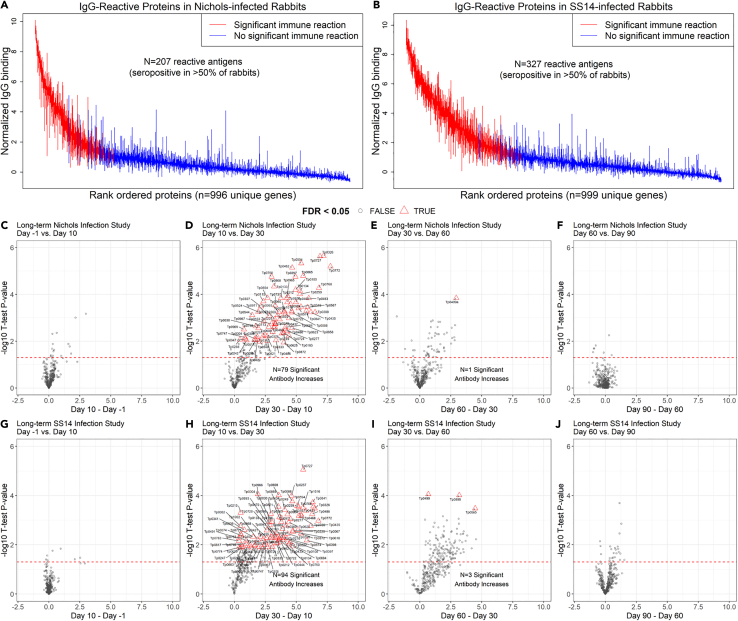
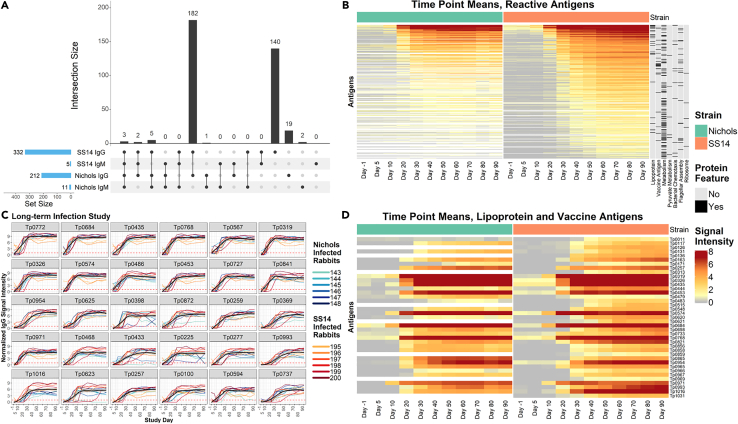
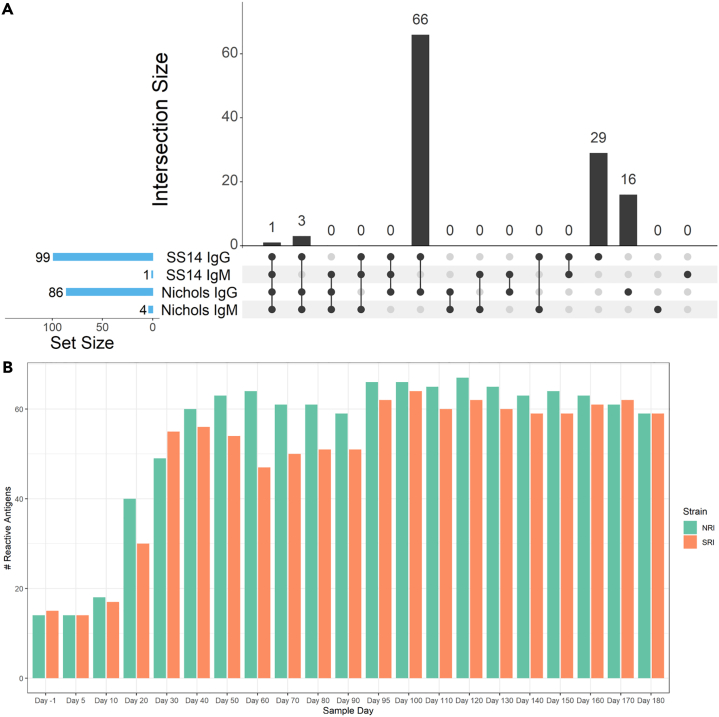
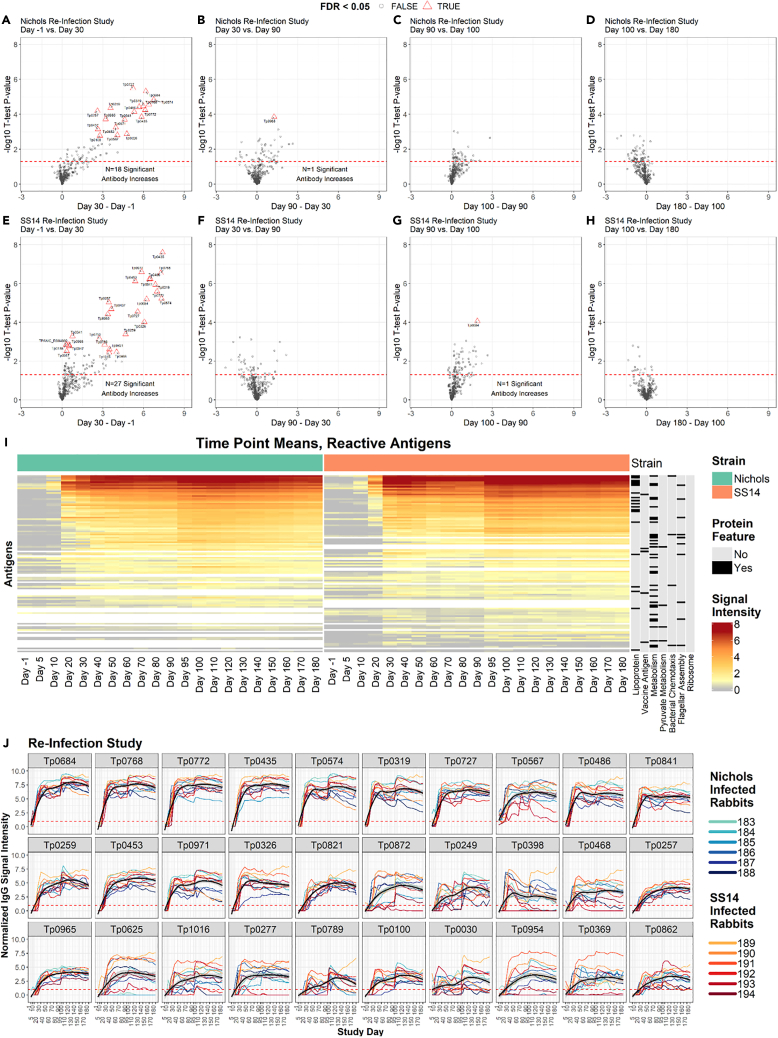
Given the resurgence of syphilis, research endeavors to improve current assays for serological diagnosis and management of this disease are a priority. A proteome-scale platform for high-throughput profiling of the humoral response to Treponema pallidum (T. pallidum) proteins during infection could identify antigens suitable to ameliorate the performance and capabilities of treponemal tests for syphilis. Additionally, because infection-induced immunity is partially protective, profiling the response to T. pallidum outer membrane proteins (OMPs) could help select vaccine candidates. Therefore, we developed a pan-proteome array (PPA) based on the Nichols and SS14 strain complete proteomes and used it to define the immunoglobulin M (IgM) and IgG humoral response to T. pallidum proteins in sera collected longitudinally from long-term infected rabbits and from rabbits that were infected, treated, and re-infected. We identified antigens that could facilitate early diagnosis and immunity to a core set of OMP that could explain protection upon reinfection.

Keywords: Bacteriology; Diagnostics; Immune response; Model organism; Proteomics.


Conflict of interest statement

The authors have no competing interests to disclose.

Figures

None
Graphical abstract
Figure 1
Figure 1
Serological test results for rabbits enrolled in this study (A) VDRL titers for long-term (LT) infected rabbits inoculated with either the Nichols or SS14 strain measured over 90 days post-infection. Vertical dotted line indicates the infection event (experiment day 0). (B) VDRL titers for rabbits in the reinfection (RI) groups inoculated with either the Nichols or SS14 strain and measured over 180 days post-infection. Vertical dotted lines mark the infection, treatment, and reinfection events (experiment day 0, 30, and 90, respectively). For calculating the mean ± SEM, titers were converted to log2 with nonreactive = −1.0; weakly reactive = −0.5; reactive 1:1 = 0, reactive 1:2 = 1, and so forth. Antilogs of mean ± SE of titers are shown in this figure with nonreactive set at y = 0. (C) TPPA titers for long-term (90 days) infected rabbits inoculated with either the Nichols or SS14 strain measured at day 30 and day 90 post-infection. (D) TPPA titers for rabbits in the RI groups inoculated with either the Nichols or SS14 strain measured at day 30 (time of treatment), day 90 (time of reinfection), and 180 post-infection. Data are represented as mean ± SEM. Asterisks identify significant differences following analysis with Student’s t test with significance set at p < 0.05.
Figure 2
Figure 2
IgG reactivity and longitudinal trajectory in long-term (N.LT and S.LT) infected rabbits (A and B) Interquartile range plots showing the maximal normalized IgG binding signal for each rabbit for each T. pallidum protein over the 90-day period of the long-term infection. Each bar represents a protein on the array, and proteins are ordered by the median signal of (A) Nichols-infected (N.LT) rabbits and (B) SS14-infected (S.LT) rabbits. Red bars represent a significantly reactive protein or proteins with seropositive responses in at least four out of six total rabbits in the group. (C–J) Volcano plots showing the difference in normalized IgG binding between time points for each reactive protein on the array (x axis) by the inverse log10p value of paired Student’s t tests. In each plot, the horizontal red dashed line represents an unadjusted p value of 0.05. All values above the red line are below 0.05. After adjustment for the false discovery rate, antibody responses that remained statistically significant were highlighted as red triangles and labeled with the antigen annotated identifier. (C–F) Plots showing sequential time point differences for N.LT animals. (G–J) Plots showing sequential time point differences for S.LT animals. Data are represented as mean ± SEM.
Figure 3
Figure 3
Antigens with significant immune responses at each time point in long-term (N.LT and S.LT) infected rabbits Bar plot showing the count of T. pallidum proteins with significant reactivity or proteins with seropositive responses in at least four out of six total rabbits in each group at each given time point. The grouped orange bars represent Nichols-infected (N.LT) animals, whereas green bars represent long-term SS14-infected (S.LT) animals. Data are represented as mean ± SEM.
Figure 4
Figure 4
IgG binding profiles in N.LT and S.LT rabbits (A) UpSet plot summarizing both the set and set size of antigens recognized by IgG and IgM during experimental infection of rabbits with either the Nichols or SS14 strains of T. pallidum. The UpSet plot is equivalent to a Venn diagram, where each vertical bar represents antibody responses that “intersect” or overlap between two or more categories (i.e., antigens that are reactive in each of the categories specified by the connected dot matrix below the bar graph). The blue horizontal bars represent the total number of reactive antigens in each category. (B) Heatmap showing the mean IgG binding signal intensity for each reactive antigen in either Nichols or SS14-strain-infected rabbits. Columns represent the means of each group of rabbits at each sequential time point, and rows represent T. pallidum proteins sorted by hierarchical clustering. Protein features that were significantly associated with antibody reactivity in stepwise regression models are shown in the black and gray columns to the right of the heatmap. Responses are grouped by Nichols- (green header) and SS14 (orange header)-strain-infected rabbits. (C) Line plots of reactivity to the 30 most reactive antigens in animals infected long-term with the Nichols strain (teal to dark blue lines) and the SS14 strain (orange to dark red lines). In each graph, the black line represents the running mean of all samples at each time point post-infection. (D) Heatmap of the antigens annotated as lipoproteins or OMPs/vaccine candidates (ordered by gene ID) recognized in Nichols-infected animals (left side, green header), and SS14-infected rabbits (right side, orange header) over the 90-day infection period. Data are represented as mean ± SEM.
Figure 5
Figure 5
Comparison of antibody responses (A) Overlap in IgG and IgM antibody responses between N.RI and S.RI rabbit groups. The UpSet plot is equivalent to a Venn diagram, where each vertical bar represents antibody responses that “intersect” or overlap between two or more categories, i.e., antigens that are reactive in each of the categories specified by the connected dot matrix below the bar graph. The blue horizontal bars represent the total number of reactive antigens in each category. (B) Antigens with significant immune responses at each time point in the N.RI and S.RI rabbit groups. The bar plot shows the count of T. pallidum proteins with significant “reactivity” or proteins with seropositive responses in at least four of six rabbits at each given time point. The grouped green bars represent Nichols-infected (N.RI) animals, whereas orange bars represent long-term SS14-infected (S.RI) animals.
Figure 6
Figure 6
IgG reactivity profiles of rabbits that were infected, treated, and then reinfected (A–H) Volcano plots show the difference in normalized IgG binding between time points for each reactive protein on the array (x axis) by the inverse log10p value of paired Student’s t tests. The horizontal red dashed lines represent an unadjusted P-value of 0.05, and all values above the red line are below 0.05. After adjustment for the false discovery rate, antibody responses that remained statistically significant were highlighted as red triangles and labeled with the antigen ID. (A–D) are sequential time point differences for Nichols-infected (N.RI) animals, and (E–H) are for SS14-infected (S.RI) animals. (I) Heatmap showing the mean IgG binding signal intensity for each of the 115 antigens that were reactive in either N.RI or S.RI rabbits. Columns represent the means of each group of rabbits at each sequential time point, and rows represent T. pallidum proteins sorted by hierarchical clustering. Protein features that were significantly associated with antibody reactivity in stepwise regression models are shown in the black and gray columns to the right of the heatmap. Responses are grouped by Nichols- (green header) and SS14 (orange header)-strain-infected rabbits. (J) Line plots showing the longitudinal trajectories of the 30 most reactive antigens by seroprevalence and normalized intensity. Each individual rabbit’s normalized IgG binding signal intensity is plotted as a colored line. Nichols-infected rabbits are teal to dark blue lines, and SS14-infected rabbits are orange to dark red lines. In each graph, the black line represents the running mean of all samples at each time point post-infection. Values are reported in Table S1 (IgG summary statistics).

References

    1. WHO . World Health Organization; 2011. Prevalence and Incidence of Selected Sexually Transmitted Infections Chlamydia trachomatis, Neisseria Gonorrhoeae, Syphilis and Trichomonas vaginalis: Methods and Results Used by WHO to Generate 2005 Estimates.
    1. Gerbase A.C., Rowley J.T., Mertens T.E. Global epidemiology of sexually transmitted diseases. Lancet. 1998;351:S2–S4. - PubMed
    1. CDC . US Department of Health and Human Services: Centers for Disease Control and Prevention; 2024. 2022 Sexually Transmitted Disease Surveillance.
    1. Savage E.J., Marsh K., Duffell S., Ison C.A., Zaman A., Hughes G. Rapid increase in gonorrhoea and syphilis diagnoses in England in 2011. Euro Surveill. 2012;17 - PubMed
    1. Savage E.J., Hughes G., Ison C., Lowndes C.M., European Surveillance of Sexually Transmitted Infections network Syphilis and gonorrhoea in men who have sex with men: a European overview. Euro Surveill. 2009;14 - PubMed

LinkOut - more resources