. 2024 Aug 3;27(9):110661.
doi: 10.1016/j.isci.2024.110661. eCollection 2024 Sep 20.

Divergent iron regulatory states contribute to heterogeneity in breast cancer aggressiveness

Affiliations

Divergent iron regulatory states contribute to heterogeneity in breast cancer aggressiveness

William D Leineweber et al. iScience. .

Abstract

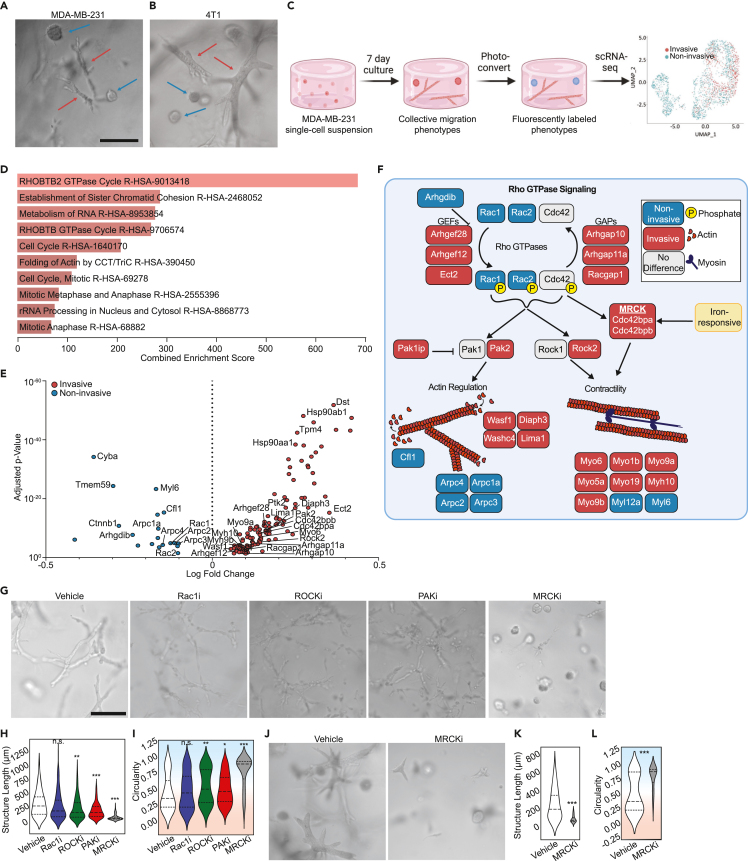
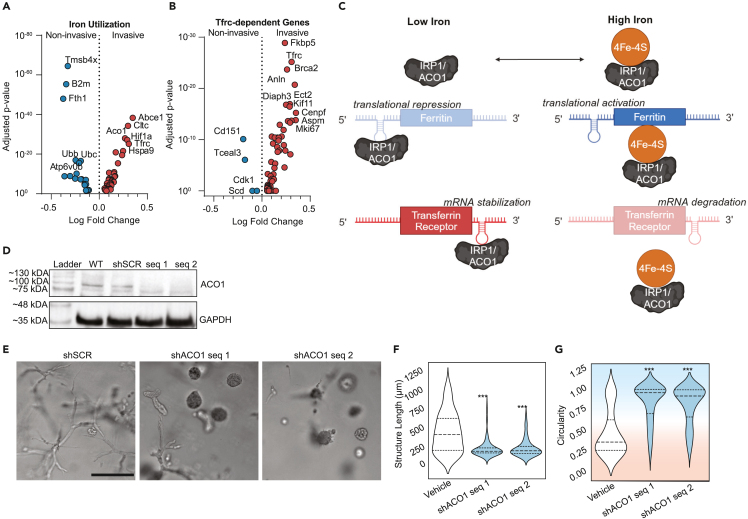
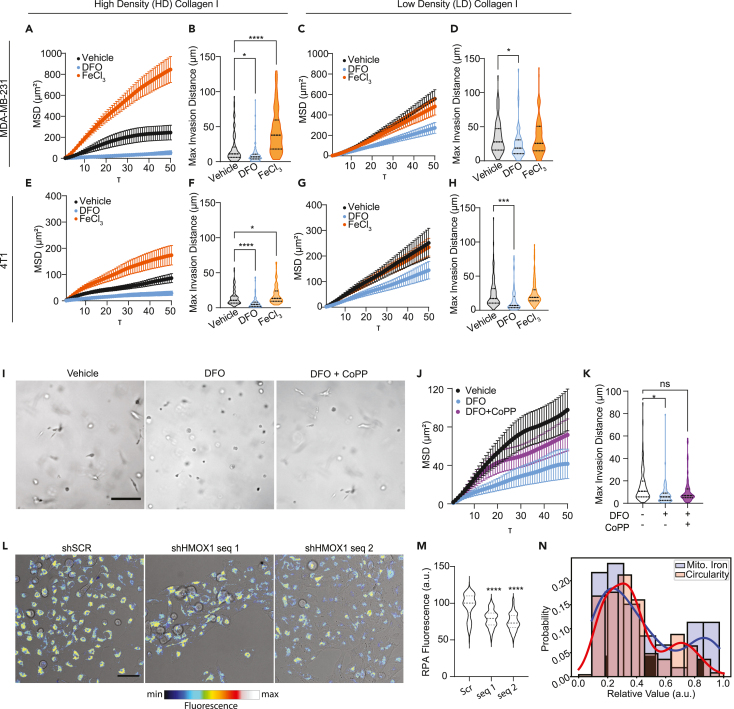
Contact with dense collagen I (Col1) can induce collective invasion of triple negative breast cancer (TNBC) cells and transcriptional signatures linked to poor patient prognosis. However, this response is heterogeneous and not well understood. Using phenotype-guided sequencing analysis of invasive vs. noninvasive subpopulations, we show that these two phenotypes represent opposite sides of the iron response protein 1 (IRP1)-mediated response to cytoplasmic labile iron pool (cLIP) levels. Invasive cells upregulate iron uptake and utilization machinery characteristic of a low cLIP response, which includes contractility regulating genes that drive migration. Non-invasive cells upregulate iron sequestration machinery characteristic of a high cLIP response, which is accompanied by upregulation of actin sequestration genes. These divergent IRP1 responses result from Col1-induced transient expression of heme oxygenase I (HO-1), which cleaves heme and releases iron. These findings lend insight into the emerging theory that heme and iron fluxes regulate TNBC aggressiveness.

Keywords: Cancer; Cell biology; Molecular biology; Molecular physiology.


Conflict of interest statement

S.I.F. is a co-founder, director, equity holder, and scientific advisor of MelioLabs, Inc. The interests of MelioLabs are not related to the contents of this paper.

Figures

None
Graphical abstract
Figure 1
Figure 1
Distinct cytoskeletal programs underlie breast cancer migration heterogeneity, with MRCK serving as a critical regulatory node of collective invasion (A and B) Representative micrographs of (A) MDA-MB-231 and (B) 4T1 collective migration phenotypes that form when single cell suspensions embedded in 6 mg/ml collagen I are cultured for one week. Red arrows point to the invasive phenotype, whereas the blue arrows show the non-invasive spheroidal structures. (C) Schematic of phenotypically supervised single-cell RNA sequencing (PhenoSeq). Photoconversion of cells from invasive and non-invasive collective migration phenotypes enables subsequent sorting and sequencing while retaining knowledge of single cell phenotypes. This labeling enables clustering based on phenotype, which reveals distinct gene expression patterns that algorithm-based unsupervised clustering misses., (D) Pathway enrichment analysis using the Reactome 2022 database of all differentially expressed genes found in the MDA-MB-231 PhenoSeq data. (E) Volcano plot of differential gene expression between cells in the collective non-invasive and invasive phenotypes related to Rho GTPase signaling. (F) Diagram showing Rho GTPase signaling and the downstream effects on actin cytoskeleton regulation and actomyosin contractility. Blue boxes indicate genes upregulated by non-invasive cells, while red boxes indicate genes upregulated by invasive cells. Grey boxes indicate genes that were not differentially regulated between the two phenotypes. The MRCKα-encoding gene Cdc42bpa contains an iron responsive element in the 3′ UTR of the mRNA. (G) Representative micrographs showing how cytoskeletal inhibitors alter the collective migration phenotype of MDAs within Col1 matrices. (H and I) Quantification of the multicellular structures showing length (H) and the circularity (I) of the structures. (J) Representative micrographs of 4T1 multicellular structures after seven days in Col1 matrices with vehicle or MRCK inhibitor treatment. (K and L) Quantification of the phenotypes showing the length (Feret diameter) (K) and circularity (L) of the structures. In violin plots, background coloring is used as a visual aid to show that high circularity values are linked to the noninvasive phenotype (blue background), while the more invasive phenotypes have lower circularity (red background). Scale bars = 200μm. N = 3 biological replicates per treatment group. Statistical significance was determined using Student’s t test or one-way ANOVA followed by Dunnett's post-test compared to the vehicle condition. ∗p < 0.05, ∗∗p < 0.01, ∗∗∗p < 0.001, ∗∗∗∗p < 0.0001. Horizontal lines within the violin plots show the quartiles of the data. See also Figures S1 and S2, Tables S1 and S2.
Figure 2
Figure 2
Divergent iron metabolism responses mediated by ACO1 differentiate non-invasive from invasive phenotypes (A) Volcano plot of differentially expressed genes identified from PhenoSeq that are related to intracellular iron usage. (B) Volcano plot of differentially expressed genes whose expression is known to decrease when Tfrc is knocked down. (C) Schematic of cytoplasmic iron regulation of transcription mediated by IRP1/ACO1. Adapted from Lawen & Lane. (D) Western blot confirming the knockdown in protein expression of IRP1/ACO1 in MDAs following lentiviral transduction with two separate shRNA sequences, as compared to wild type (WT) and shRNA targeting a scramble control sequence (shSCR). (E) Representative micrographs of lentivirally-transduced MDAs after seven days in Col1 matrices. (F and G) Quantification shows the maximum length of structures (Feret diameter) (F) and circularity (G). Background coloring is used as a visual aid to show that high circularity values are linked to the noninvasive phenotype (blue background), while the more invasive phenotypes have lower circularity (red background). Scale bar = 200μm. N = 3 biological replicates per treatment group. Statistical significance was determined using one-way ANOVA followed by a Dunnett post-test comparing each treatment group to the vehicle group. ∗p < 0.05, ∗∗p < 0.01, ∗∗∗p < 0.001, ∗∗∗∗p < 0.0001. Horizontal lines within the violin plots show the quartiles of the data. See also Figure S3 and Table S3.
Figure 3
Figure 3
Iron-associated transcriptional states induced by HD Col1 are evident in patient tumors (A and B) Kaplan Meier plots showing TNBC patient five-year overall survival stratified by high or low mean expression of the top six iron-related genes enriched in the (A) noninvasive or (B) invasive populations. (C and D) Kaplan Meier five-year overall survival plots for (C) all breast cancer patients or (D) TNBC patients stratified by Aco1. (E and F) Breast cancer tumor sections of Patient 1910 and Patient 4193 from the Human Protein Atlas show gene expression patterns matching the (E) divergent metabolism and (F) cytoskeletal regulation programs identified from the collective noninvasive and invasive phenotypes. Protein expression from Patient 1910 is consistent with the invasive phenotype, while Patient 4193 is consistent with the noninvasive phenotype. Staining and pathological analysis of HPA tissue sections is conducted by board-certified pathologists and provided on the Human Protein Atlas website.
Figure 4
Figure 4
Dense collagen I initiates a low-iron response mediated by upregulation of Hmox1 (A) Bulk RNA sequencing of MDA-MB-231 cells embedded in 2.5 mg/ml (LD) or 6 mg/ml (HD) collagen I matrices for 24h reveals differential expression of iron-related genes. Cells in the HD matrices are enriched for genes related to iron import and usage, while those in LD matrices are enriched for genes related to iron sequestration or storage. Genes are ordered by fold change. Color gradient corresponds to Z score of the transcripts per million (TPM) for each gene in the two conditions. Statistical significance between the LD and HD conditions was determined using paired Student’s t tests and only genes with p < 0.05 are shown. N = 3 biological replicates per condition. (B) Schematic of heme oxygenase-1 enzymatic activity and the resulting effects on intracellular iron and heme levels. Adapted from Anderson et al. (C) RT-qPCR analysis of Hmox1 gene expression in HD Col1 matrices shows a peak between 24 and 72h for MDA-MB-231 cells. Treatment with 10μM cobalt protoporphyrin (CoPP) induces Hmox1 expression approximately 25x higher than levels measured 1h after embedding. Hmox1 gene expression normalized to Actb transcript levels. The mean ± SEM is shown. (D and E) Cells treated with CoPP compared to vehicle controls are significantly more motile (D) and invasive (E). N = 3 biological replicates with n = 30 trajectories per replicate. Statistical significance determined by Welch’s t-test, ∗∗p < 0.01. The mean ± SEM is shown in panel D. (F) Knockdown of Hmox1 confirmed by western blot. (G) Representative micrographs of scramble control and Hmox1 knockdown MDA-MB-231 cells with vehicle or CoPP treatment after seven days in HD Col1. Scale bar = 200μm. (H and I) Quantification of the (H) structure lengths and (I) circularity shows that knockdown of Hmox1 results in less collective cell invasion, while CoPP treatment enhances collective invasion only for the scramble control population. Statistical significance was determined by one-way ANOVA followed by Dunnett post-test. ∗∗p < 0.01. (J) Heme levels in MDAs stably expressing shSCR or shHMOX1 treated with vehicle or CoPP. One-way ANOVA shows a significant effect of the knockdown and drug treatment. N ≥ 3 biological replicates for each condition, each with triplicate technical replicates. The black bars show the mean ± SEM. (K) RT-qPCR shows a down-regulation of the MRCK-encoding gene Cdc42bpa in the shHMOX1 cells compared to shSCR control after seven days in HD Col1. The bar plots show the mean ± SEM. N ≥ 3 biological replicates for each condition, each with duplicate technical replicates. The black bars show the mean ± SEM. Statistical significance determined by Student’s t test. ∗∗∗p < 0.001. Horizontal lines within the violin plots show the quartiles of the data.
Figure 5
Figure 5
Iron modulates invasive cell migration in a collagen density-dependent manner (A–D) Mean squared displacement (MSD) and max invasion distances from cell tracking of MDAs in (A-B) HD Col1 and (C-D) LD Col1. (E–H) MSD and max invasion distances from cell tracking of 4T1s in (E and F) HD Col1 and (G and H) LD Col1. Cells were treated with vehicle (0.1% dH20), 10μM DFO, or 200μM FeCl3. N = 3 biological replicates with at least n = 30 cells per replicate. (I) Micrographs of MDAs after 48h culture in HD matrices treated with either DFO or DFO+CoPP show the rescue of cell elongation by CoPP. Scale bar = 200μm. (J and K) MSD and max invasion distance measurements show the partial rescue of invasion by CoPP treatment when cells were challenged with DFO. N = 3 biological replicates with n = 30 trajectories per replicate. (L) Representative micrographs of shSCR and shHMOX1 MDAs treated with CoPP showing brightfield with pseudo-colored RPA fluorescence overlaid. Scale bar = 50μm. (M) RPA fluorescence of CoPP treated cells is significantly lower in shHMOX1 cells compared to the scramble controls, indicating higher levels of mitochondrial labile iron in the shHMOX1 condition. (N) Histogram of RPA fluorescence levels of CoPP treated shSCR cells shows a bimodal distribution of intensities consistent with the proportion of invasive vs. noninvasive multicellular structures that arise in the Hmox1-inducing 3D HD Col1 matrix condition. Statistical significance was determined using one-way ANOVA followed by a Dunnett post-test. ∗p < 0.05, ∗∗p < 0.01, ∗∗∗p < 0.001, ∗∗∗∗p < 0.0001. Horizontal lines within the violin plots show the quartiles of the data. See also Figure S4.
Figure 6
Figure 6
Non-invasive collective migration is more glycolytic while invasive collective migration is more OxPhos-dependent (A–C) Differentially expressed genes related to (A) OxPhos, (B) glycolysis, and (C) TCA cycle. (D) Representative micrographs from stimulated Raman spectroscopy of MDA collective migration in HD Col1. Scale bar = 20μm. (E) Quantification of the ratio of CD:CH shows an increase in the noninvasive structures, indicating higher glycolytic flux. (F) The ratio of NADH/Flavin is significantly lower in the invasive structures, indicating more flux through the TCA and OxPhos pathways. Bar plots show the mean ± SEM. Statistical significance determined by Student’s t test. ∗p < 0.001; ∗∗∗∗p < 0.0001. See also Figure S5 and Table S4.
Figure 7
Figure 7
Collectively invasive cells are more sensitive to OxPhos inhibition than non-invasive cells (A) Representative micrographs of MDAs in HD Col1 treated with 0.1% DMSO vehicle, 1μM complex I inhibitor rotenone, or 1μM glycolytic enzyme ENO1 inhibitor AP-III-a4. Inhibition of complex I abrogated the collective invasion phenotype, while inhibition of ENO1 decreased the proportion of the non-invasive phenotype in both MDAs and 4T1s. Scale bar = 200μm. (B and C) Quantification of the collective migration phenotypes following targeted inhibition of OxPhos or glycolysis, measured by (B) maximum length of structures (Feret diameter) and (C) circularity. N = 3 replicates for each condition. Individual structures for MDAs: n = 70 vehicle, n = 71 ENO1i, n = 64 Complex Ii. 4T1s: n = 56 vehicle, n = 42 ENO1i, n = 36 Complex Ii. Statistical significance was determined using one-way ANOVA followed by a Dunnett post-test comparing each treatment group to the vehicle group. (D) MTS assay results showing relative cell viability in response to drug treatments. The mean ± SEM is plotted. N = 3 biological replicates for each condition. Statistical significance was determined using two-way ANOVA followed by Sídák's multiple comparisons test. (E) Representative H&E histology section of the PA-14-13 patient-derived organoid (PDO) model showing elongated strands of cells reminiscent of collectively invasive cells. Counterstaining for TWIST1 is shown in brown. (F) Representative second-harmonic generation (SHG) image of the dense fibrous collagen architecture of the PDO. (G) Representative micrographs of patient-derived organoid models treated with 0.1% DMSO vehicle, 1μM complex I inhibitor rotenone, or 1μM glycolytic enzyme ENO1 inhibitor AP-III-a4. Scale bar = 100μm. (H–I) Quantification shows the (H) maximum length of structures (Feret diameter) and (I) circularity. Statistical significance was determined using one-way ANOVA followed by a Dunnett post-test comparing each treatment group to the vehicle group. (J) MTS assay results showing relative cell viability in response to drug treatments. The mean ± SEM is plotted. Statistical significance was determined using two-way ANOVA followed by Sídák's multiple comparisons test. N = 3 biological replicates per treatment group. ∗p < 0.05, ∗∗p < 0.01, ∗∗∗p < 0.001, ∗∗∗∗p < 0.0001. Horizontal lines within the violin plots show the quartiles of the data. See also Figure S6.

Update of

References

    1. Dillekås H., Rogers M.S., Straume O. Are 90% of deaths from cancer caused by metastases? Cancer Med. 2019;8:5574–5576. doi: 10.1002/cam4.2474. - DOI - PMC - PubMed
    1. Wells A., Grahovac J., Wheeler S., Ma B., Lauffenburger D. Targeting tumor cell motility as a strategy against invasion and metastasis. Trends Pharmacol. Sci. 2013;34:283–289. doi: 10.1016/j.tips.2013.03.001. - DOI - PMC - PubMed
    1. Palmer T.D., Ashby W.J., Lewis J.D., Zijlstra A. Targeting tumor cell motility to prevent metastasis. Adv. Drug Deliv. Rev. 2011;63:568–581. doi: 10.1016/j.addr.2011.04.008. - DOI - PMC - PubMed
    1. Ganesh K., Massagué J. Targeting metastatic cancer. Nat. Med. 2021;27:34–44. doi: 10.1038/s41591-020-01195-4. - DOI - PMC - PubMed
    1. Patel S.A., Rodrigues P., Wesolowski L., Vanharanta S. Genomic control of metastasis. Br. J. Cancer. 2021;124:3–12. doi: 10.1038/s41416-020-01127-6. - DOI - PMC - PubMed

LinkOut - more resources