. 2024 Aug 2;27(9):110628.
doi: 10.1016/j.isci.2024.110628. eCollection 2024 Sep 20.

Causal discovery reveals complex patterns of drought-induced displacement

Affiliations

Causal discovery reveals complex patterns of drought-induced displacement

Jose María Tárraga et al. iScience. .

Abstract

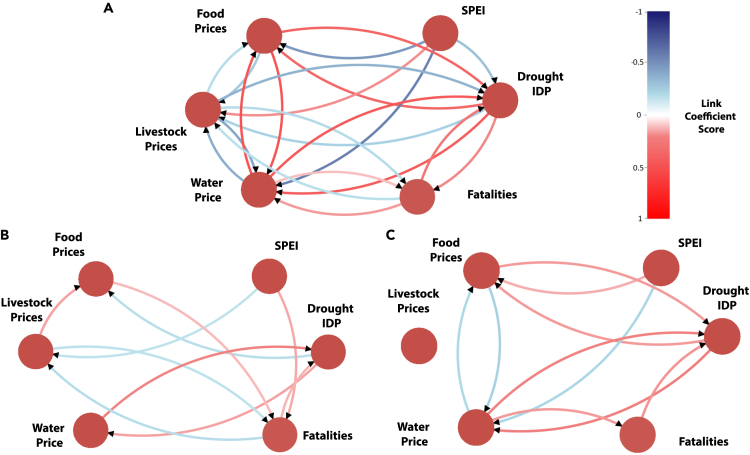
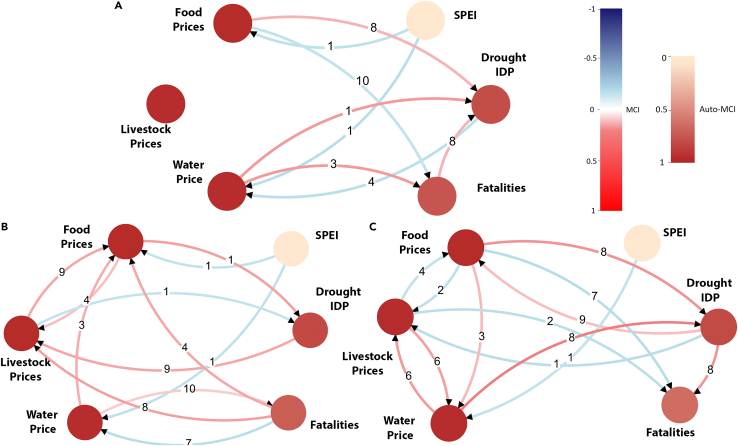
The increasing frequency and severity of droughts present a significant risk to vulnerable regions of the globe, potentially leading to substantial human displacement in extreme situations. Drought-induced displacement is a complex and multifaceted issue that can perpetuate cycles of poverty, exacerbate food and water scarcity, and reinforce socio-economic inequalities. However, our understanding of human mobility in drought scenarios is currently limited, inhibiting accurate predictions and effective policy responses. Drought-induced displacement is driven by numerous factors and identifying its key drivers, causal-effect lags, and consequential effects is often challenging, typically relying on mechanistic models and qualitative assumptions. This paper presents a novel, data-driven methodology, grounded in causal discovery, to retrieve the drivers of drought-induced displacement within Somalia from 2016 to 2023. Our model exposes the intertwined vulnerabilities and the leading times that connect drought impacts, water and food security systems along with episodes of violent conflict, emphasizing that causal mechanisms change across districts. These findings pave the way for the development of algorithms with the ability to learn from human mobility data, enhancing anticipatory action, policy formulation, and humanitarian aid.

Keywords: climatology; geography; global change; human geography.


Conflict of interest statement

The authors declare that they have no known competing financial interests or personal relationships that could have appeared to influence the work reported in this paper.

Figures

None
Graphical abstract
Figure 1
Figure 1
Overview of the methodology proposed to understand drought internal displacement through causal discovery Total number and percentage of new displacements attributed to Somalia’s droughts and conflicts during 2016–2023 (A). Weekly timeseries data are collected in three of the selected Somalia districts included in the study (Baidoa, Diinsoor, and Kurtunwarey) accounting for drought impacts (SPEI), socioeconomic (food, livestock, and water prices), and conflict drivers (fatalities) (B). From the preprocessed time series, we derive causal graphs per district with the PCMCI method (C).
Figure 2
Figure 2
Harmonized and preprocessed time series for the three selected districts (A) Baidoa, (B) Diinsoor, (C) Kurtunwarey. An association between drought IDP waves, SPEI impacts, and market price shocks can be seen at a glance during the drought event periods for the different districts. However, different dynamics are observed as different onset and IDP magnitudes are observed across time.
Figure 3
Figure 3
Graphs representing relationships between the drivers of drought displacement in the Baidoa district obtained through different statistical tests for a p value <0.05 The graph in (A) is obtained using partial correlation. The graph in (B) is Granger causality. Finally, the graph in (C) is built using PCMCI controlling for autocorrelation, and presenting a superior causal link detection power. (1) Arrows in the diagram point in the direction of the links between variables, (2) the color of the arrows indicates the effect correlation (a red arrow of food prices pointing displacement means that a rise in food prices causes a rise in displacement) (3) The intensity of the color indicates the score for the statistical test (the partial Pearson correlation coefficient for partial correlation (A) and MCI in Granger causality (B) and in PCMCI (C) which translates into the strength of the detected causal link.
Figure 4
Figure 4
Derived causal graphs for several districts in Somalia Derived causal graph using PCMCI for (A) Baidoa, (B) Diinsoor, (C) Kurtunwarey districts in Somalia at α=0.05 and τmax=10 weeks. The causal graphs provide insight into the relationships between the drivers of drought displacement for each district. (1) Arrows in the diagram point in the direction of causal links between variables, (2) numbers indicate the most important time-lag (highest dependence score) in which variables are affecting each other, (3) the color of the arrows indicates the causal effect correlation (a red arrow of food prices pointing displacement means that a rise in food prices causes a rise in displacement) (4) the intensity of the color indicates the MCI score which translates into the strength of the causal link. (5) Node color indicates auto-MCI which is a measure of causal auto-correlation. For visualization purposes here we show the most relevant time-lag (refer to Figure S3) for additional time-lags. The experiments show that the inflation of food prices drive displacement in all districts. However, we find different relationships depending on the district. For example, the rise in water prices is found to be causally relevant in Baidoa and Kurtunwarey districts but not in Diinsoor. In addition, the decrease in livestock prices drives drought displacement in Diinsoor but not in Baidoa or Kurtunwarey. Furthermore, we found a direct link between conflict and drought displacement only in the Baidoa district.

References

    1. IDMC . Global Report on Internal Displacement. 2022. https://www.internal-displacement.org/publications/2022-global-report-on...
    1. United Nations High Commissioner for Refugees (UNCHR) Climate change is the defining crisis of our time and it particularly impacts the displaced. 2020. https://www.unhcr.org/uk/news/stories/climate-change-defining-crisis-our...
    1. United Nations Network on Migration . Migration and Global Environmental Change: Future Challenges and Opportunities. 2011. https://migrationnetwork.un.org/resources/migration-and-global-environme...
    1. Clement V., Rigaud K.K., de Sherbibin A., Jones B., Adamo S., Schewe J., Sadiq N. Shabahat E.Groundswell Part 2 : Acting on Internal Climate Migration. World Bank; 2021. http://hdl.handle.net/10986/36248
    1. Desai B., Bresch D.N., Cazabat C., Hochrainer-Stigler S., Mechler R., Ponserre S., Schewe J. Addressing the human cost in a changing climate. Science. 2021;372:1284–1287. - PubMed

LinkOut - more resources