. 2024 Aug 3;27(9):110626.
doi: 10.1016/j.isci.2024.110626. eCollection 2024 Sep 20.

Effect of intrapartum azithromycin on gut microbiota development in early childhood: A post hoc analysis of a double-blind randomized trial

Affiliations

Effect of intrapartum azithromycin on gut microbiota development in early childhood: A post hoc analysis of a double-blind randomized trial

Bakary Sanyang et al. iScience. .

Abstract

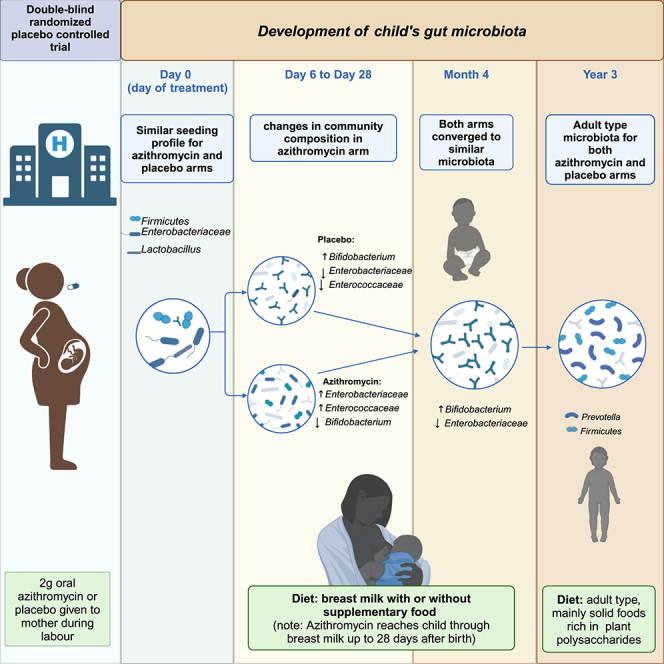
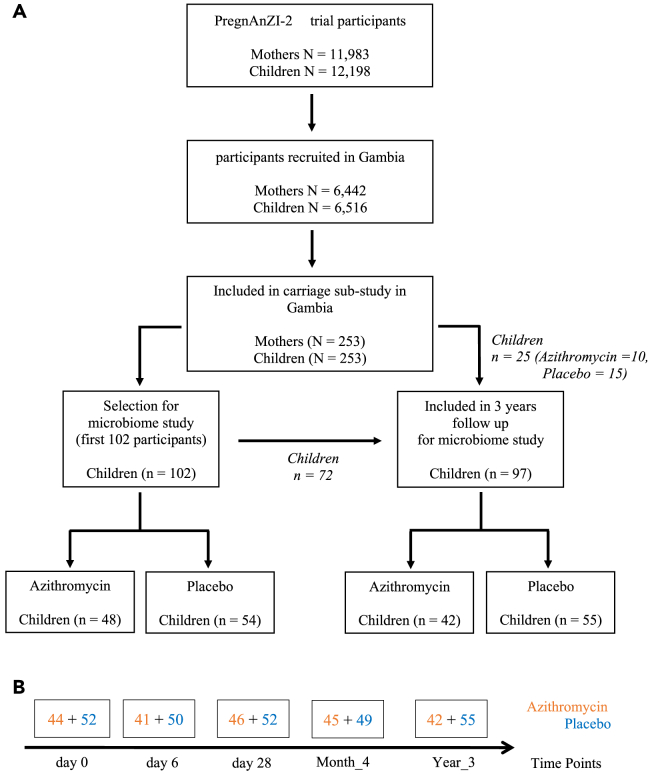
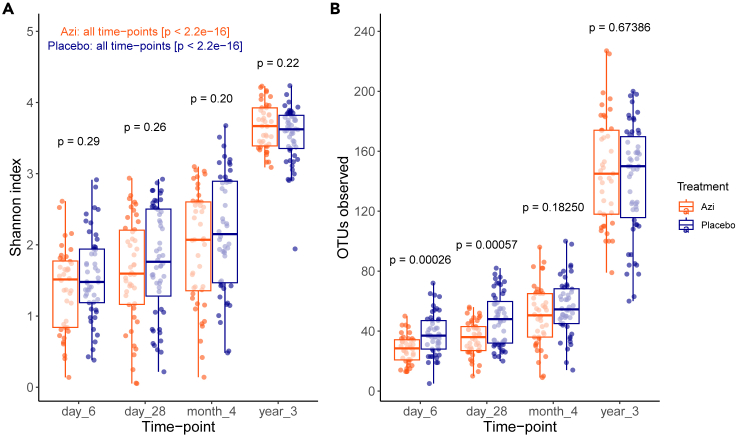
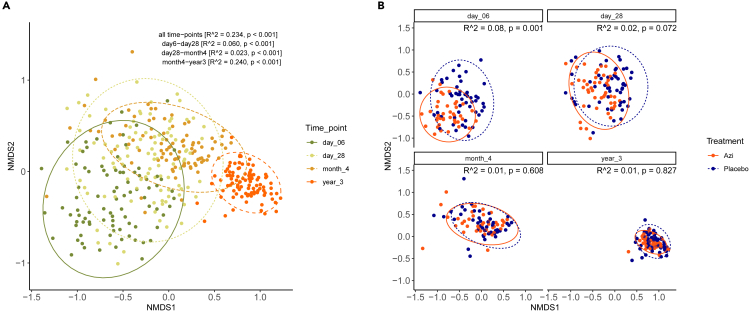
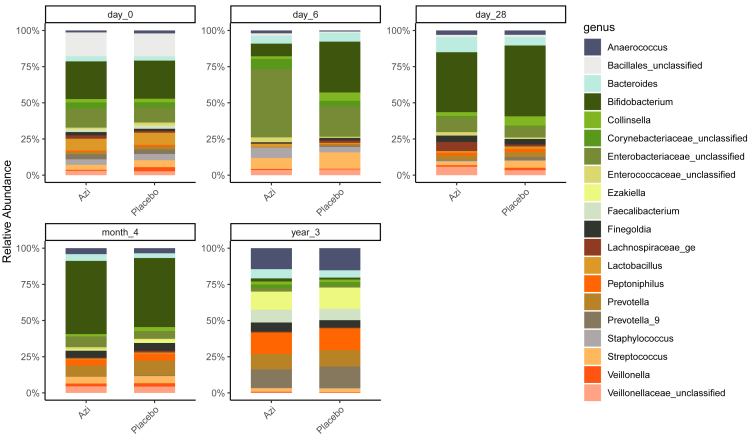
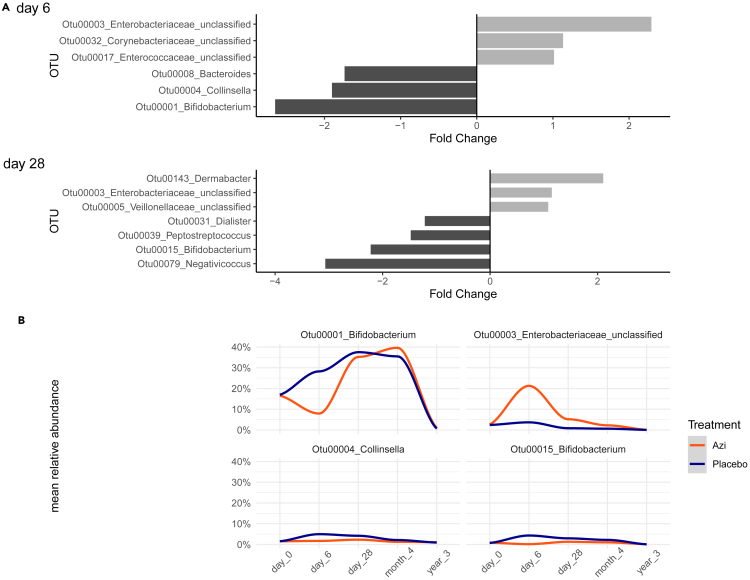
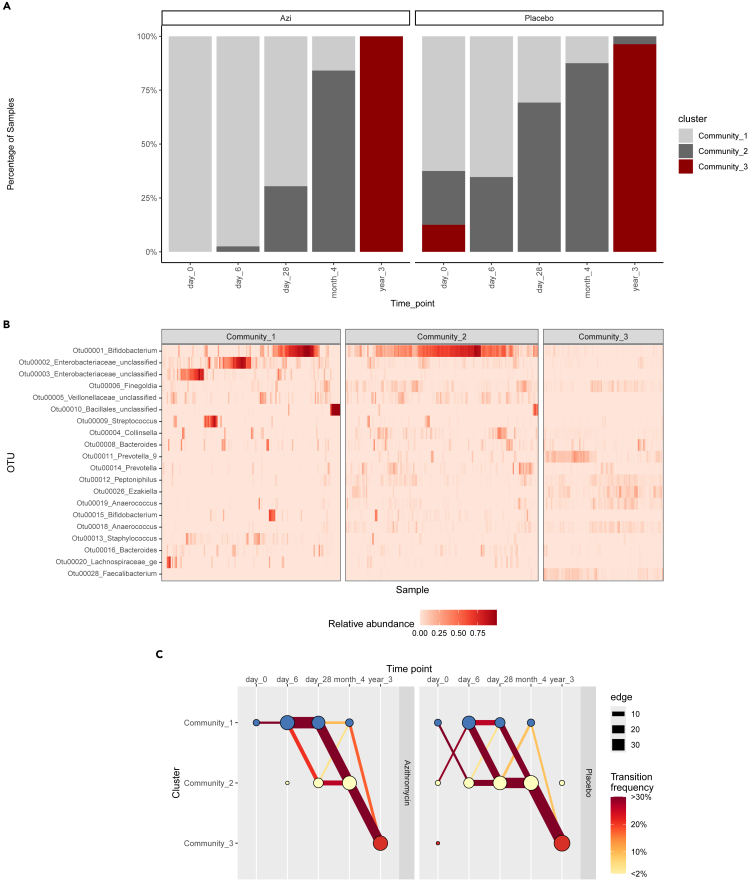
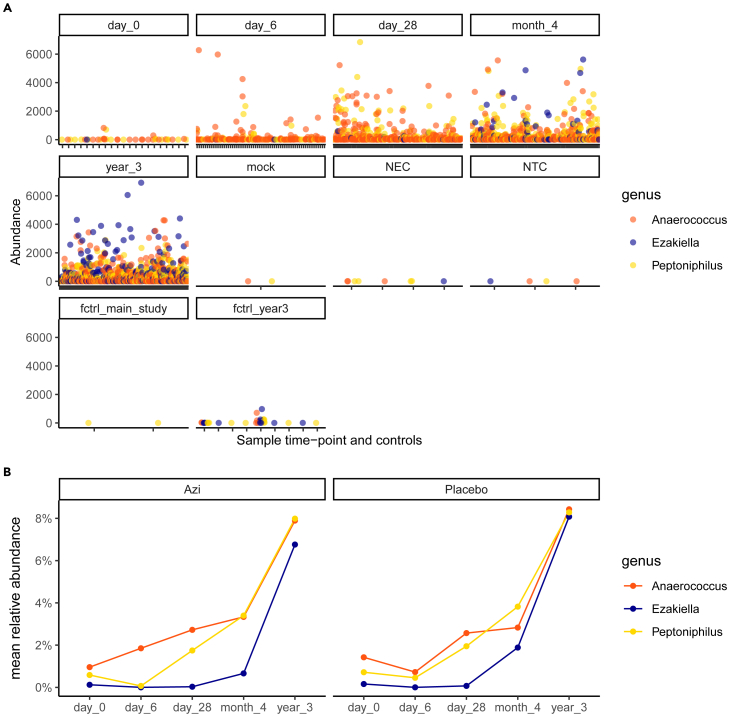
Intrapartum azithromycin prophylaxis has shown the potential to reduce maternal infections but showed no effect on neonatal sepsis and mortality. Antibiotic exposure early in life may affect gut microbiota development, leading to undesired consequences. Therefore, we here assessed the impact of 2 g oral intrapartum azithromycin on gut microbiota development from birth to the age of 3 years, by 16S-rRNA gene profiling of rectal samples from 127 healthy Gambian infants selected from a double-blind randomized placebo-controlled clinical trial (PregnAnZI-2). Microbiota trajectories showed, over the first month of life, a slower community transition and increase of Enterobacteriaceae (p = 0.001) and Enterococcaceae (p = 0.064) and a decrease of Bifidobacterium (p < 0.001) in the azithromycin compared to the placebo arm. Intrapartum azithromycin alters gut microbiota development and increases proinflammatory bacteria in the first month of life, which may have undesirable effects on the child.

Keywords: Health sciences; Medical microbiology; Medical specialty; Medicine; Microbiome; Pharmacology.


Conflict of interest statement

All the authors declare no conflict of interest.

Figures

None
Graphical abstract
Figure 1
Figure 1
A summary of the selection process (A) Selection of samples for microbiome study. (B) Distribution of samples included in microbiota analysis between trial arms at each time point.
Figure 2
Figure 2
Shannon diversity and OTU richness observed over time (A) Shannon diversity between trial arms at each time point and within each trial arm over time. In both trial arms, alpha diversity increased significantly with age (Kruskal-Wallis test). There was no difference between arms at any time point (Wilcoxon test). Details of statistical comparisons between trial arms are shown in Table 4. (B) OTU richness between trial arms at each time point. OTU richness was lower in the azithromycin arm at days 6 and 28 but there was no difference between arms at subsequent time points (Wilcoxon test). Details on statistical comparison of OTU richness between trial arms can be found in Table S2. For both (A) and (B), the boxes show the median, lower, and upper quartiles (middle 50% values), whereas the whiskers show the lower and upper 25% values excluding outliers.
Figure 3
Figure 3
Non-metric multidimensional scaling plots (NMDS) showing overall community composition (beta diversity) calculated by Bray-Curtis dissimilarity index (A) Overall community composition compared by age by PERMANOVA. (B) Overall community composition compared between trial arms at each time point by PERMANOVA. The effect of azithromycin on overall community composition was largest at day 6.
Figure 4
Figure 4
Bacterial genus profiles showing the mean relative abundances of the top 20 genera in either arm of the trial, grouped by time point
Figure 5
Figure 5
OTU differential abundance between trial arms (A) OTUs that had significantly different representation between trial arms at days 6 and 28. A positive fold change indicates increased abundance in azithromycin arm, and a negative fold change indicates decreased abundance in the azithromycin arm. The length of the bar indicates the magnitude of fold change. Statistical details are shown in Table 6. (B) Time trend of relative abundance of the top four differentially abundant OTUs between trial arms.
Figure 6
Figure 6
Microbiota community types (clusters) and development trajectory (A) Microbiota community types based on highest abundant taxa generated by Dirichlet Multinomial Mixtures model and their frequencies between trial arms at each time point. (B) Heatmap generated by hierarchical clustering showing relative abundance of the top 20 OTUs across the three community types. (C) Microbiota trajectories showing progression of individuals through the three community types over time in either trial arm. The size of the edges indicates number of individuals, and the color indicates frequency of transitions.
Figure 7
Figure 7
A summary of count and relative abundance of the genera Anaerococcus, Ezakiella, and Peptoniphilus (A) Abundance of the three genera in true samples stratified by time point (age) and in controls stratified by control type. For each genus, each data point shows the abundance in an individual sample or control. For each genus in a sample, only counts ≥3 are shown. (B) Relative abundance of each genus over time stratified by trial arm. Both arms show increasing abundance of all three genera with age.

Similar articles

Cited by

References

    1. Africa’s Advances in Maternal, Infant Mortality Face Setbacks: WHO Report. WHO; 2022. https://www.afro.who.int/news/africas-advances-maternal-infant-mortality... Regional Office for Africa.
    1. World Health Organization . Who; 2022. Newborn Mortality; pp. 56–59.
    1. Sharrow D., Hug L., You D., Alkema L., Black R., Cousens S., Croft T., Gaigbe-Togbe V., Gerland P., Guillot M., et al. Global, regional, and national trends in under-5 mortality between 1990 and 2019 with scenario-based projections until 2030: a systematic analysis by the UN Inter-agency Group for Child Mortality Estimation. Lancet Glob. Health. 2022;10:e195–e206. doi: 10.1016/S2214-109X(21)00515-5. - DOI - PMC - PubMed
    1. Musarandega R., Nyakura M., Machekano R., Pattinson R., Munjanja S.P. Causes of maternal mortality in Sub-Saharan Africa: A systematic review of studies published from 2015 to 2020. J. Glob. Health. 2021;11 doi: 10.7189/JOGH.11.04048. - DOI - PMC - PubMed
    1. Hug L., Alexander M., You D., Alkema L., UN Inter-agency Group for Child Mortality Estimation National, regional, and global levels and trends in neonatal mortality between 1990 and 2017, with scenario-based projections to 2030: a systematic analysis. Lancet Glob. Health. 2019;7:e710–e720. doi: 10.1016/S2214-109X(19)30163-9. - DOI - PMC - PubMed

LinkOut - more resources