. 2024 Jun 26;11(8):nwae223.
doi: 10.1093/nsr/nwae223. eCollection 2024 Aug.

Slowdown in China's methane emission growth

Affiliations

Slowdown in China's methane emission growth

Min Zhao et al. Natl Sci Rev. .

Abstract

The unprecedented surge in global methane levels has raised global concerns in recent years, casting a spotlight on China as a pivotal emitter. China has taken several actions to curb the methane emissions, but their effects remain unclear. Here, we developed the Global ObservatioN-based system for monitoring Greenhouse GAses for methane (GONGGA-CH4) and assimilate GOSAT XCH4 observations to assess changes in China's methane emissions. We find the average rate of increase in China's methane emissions (0.1 ± 0.3 Tg CH4 yr-2) during 2016-2021 slowed down compared to the preceding years (2011-2015) (0.9 ± 0.5 Tg CH4 yr-2), in contrast to the concurrent acceleration of global methane emissions. As a result, the contribution of China to global methane emissions dropped significantly. Notably, the slowdown of China's methane emission is mainly attributable to a reduction in biogenic emissions from wetlands and agriculture, associated with the drying trend in South China and the transition from double-season to single-season rice cropping, while fossil fuel emissions are still increasing. Our results suggest that GONGGA-CH4 provides the opportunity for independent assessment of China's methane emissions from an atmospheric perspective, providing insights into the implementation of methane-related policies that align with its ambitious climate objectives.

Keywords: China; Global ObservatioN-based system for monitoring Greenhouse GAses for methane; data assimilation; greenhouse gases; methane emissions.


Figures

Figure 1.
Figure 1.
China's annual methane emissions and their global contribution. (a) China's methane emissions from 2011 to 2021 and the trend in 2011–2016 (Phase I with white background) and 2016–2021 (Phase II with grey background). Stars, squares, circles, and dots represent the different results with various prior emissions and ensemble mean. Light-blue shaded area represents the range of Global Carbon Project (GCP) inversions; (b) global methane emissions from 2011 to 2021 and the trend in 2011–2021; (c) proportion of China’s methane emissions to the global total from 2011 to 2021.
Figure 2.
Figure 2.
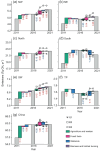
Changes in China's methane emissions for different regions and sectors. The methane emission changes over (a) Northwest (NW), (b) Northeast (NE), (c) North, (d) South, (e) Southwest (SW), (f) Tibetan Plateau (TP), and (g) China. Green, red, blue, and purple bars represent Agriculture and waste, Fossil fuels, Wetlands, and Biomass and Biofuel Burning. Each graph represents the accumulative changes in different sectors of methane emissions for 2011–2016 and 2016–2021. The asterisk, circle, and square represent the results of the three experiments.
Figure 3.
Figure 3.
Drivers influencing changes in China's methane emissions. (a) Fossil fuels sector: annual anomaly in coal production (109 tons yr−1) and gas production (1011 m3 yr−1) from 2011–2021 from National Statistics Bureau, along with fossil fuel methane emissions (Tg CH4 yr−1) in GONGGA-CH4. (b) Wetland sector: box plot depicting annual anomaly of wetland emissions (Tg CH4 yr−1) in WetCHARTs dataset (2011–2019) and line chart depicting wetland emissions (Tg CH4 yr−1) of GONGGA-CH4 (2011–2021) over South China. (c) Rice cultivation sector: annual anomaly of early rice, middle and one-season late rice, two-season late rice, and total rice methane emissions (Tg CH4 yr−1) for the period 2011–2021, based on the Bottom-Up method (in SI text).

References

    1. Tollefson J. Scientists raise alarm over ‘dangerously fast’ growth in atmospheric methane. Nature 2022. doi: 10.1038/d41586-022-00312-2. 10.1038/d41586-022-00312-2 - DOI - PubMed
    1. Canadell JG, Monteiro PMS, Costa MH. Global Carbon and Other Biogeochemical Cycles and Feedbacks. In: IPCC AR6 WGI 2021.
    1. Crippa M, Solazzo E, Huang G et al. High resolution temporal profiles in the Emissions database for global atmospheric research. Sci Data 2020; 7: 121. 10.1038/s41597-020-0462-2 - DOI - PMC - PubMed
    1. Ferretti DF, Miller JB, White JWC et al. Unexpected changes to the global methane budget over the past 2000 years. Science 2005; 309: 1714–7. 10.1126/science.1115193 - DOI - PubMed
    1. Ghosh A, Patra PK, Ishijima K et al. Variations in global methane sources and sinks during 1910–2010. Atmos Chem Phys 2015; 15: 2595–612. 10.5194/acp-15-2595-2015 - DOI