

Comparison and classification of photovoltaic system architectures for limiting the impact of the partial shading phenomenon
- PMID: 39263101
- PMCID: PMC11388733
- DOI: 10.1016/j.heliyon.2024.e36670
Comparison and classification of photovoltaic system architectures for limiting the impact of the partial shading phenomenon
Abstract
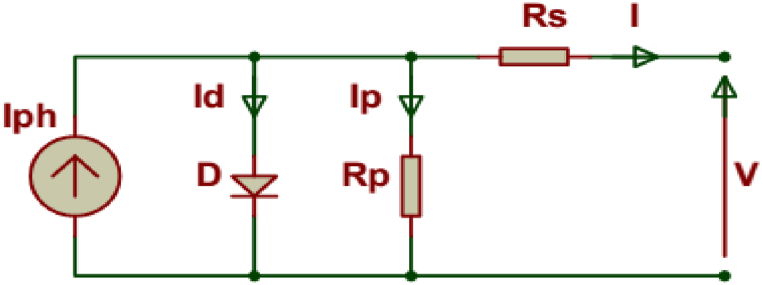
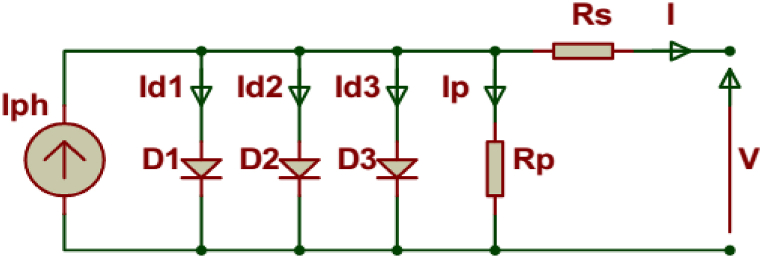
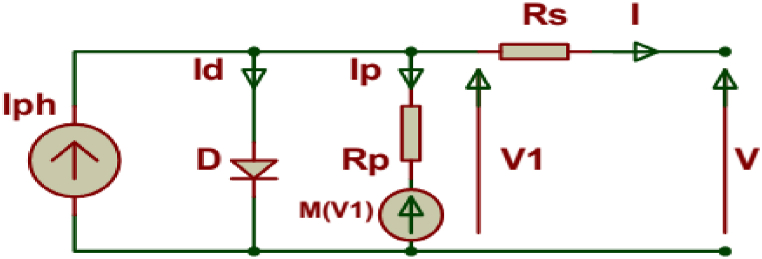
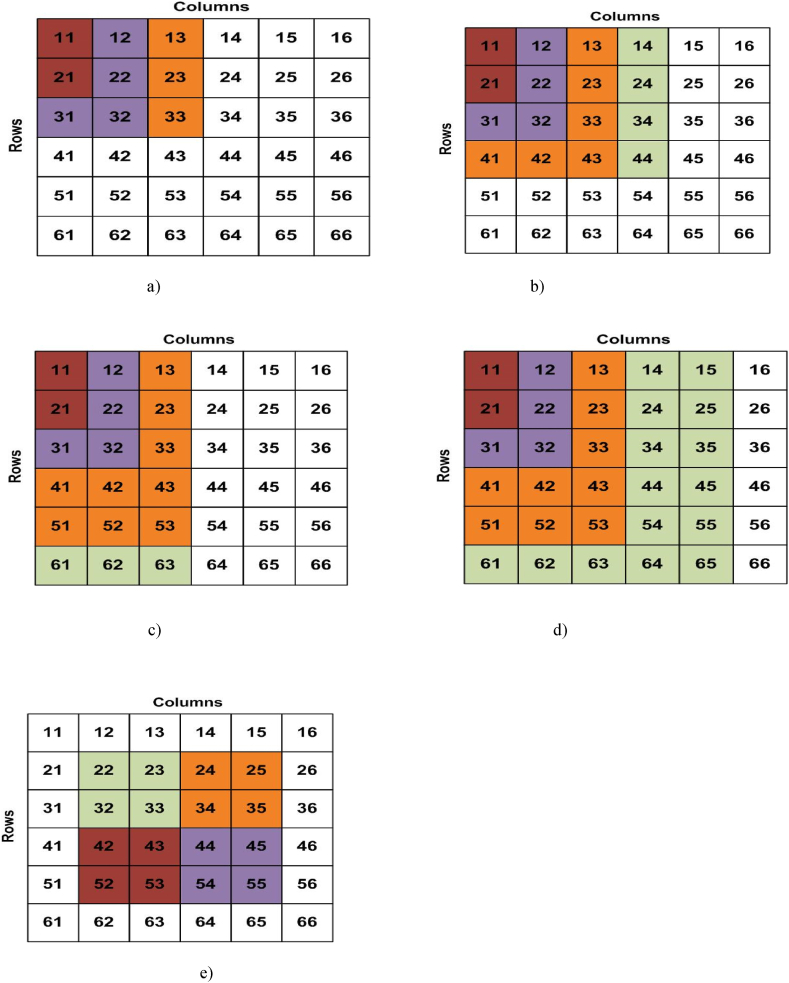
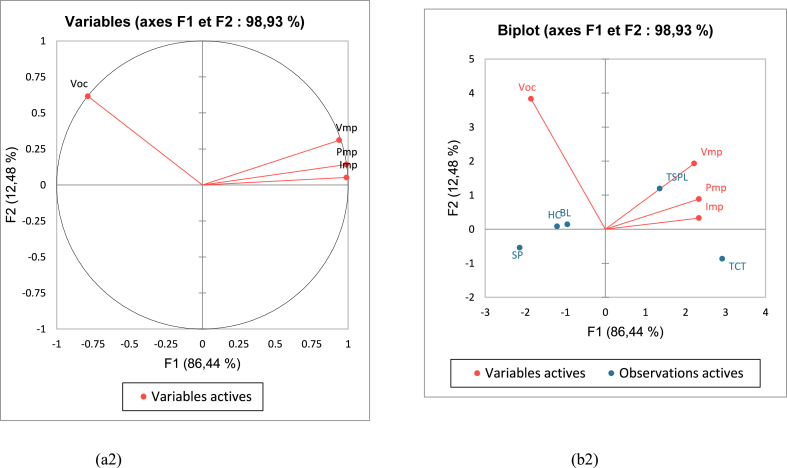
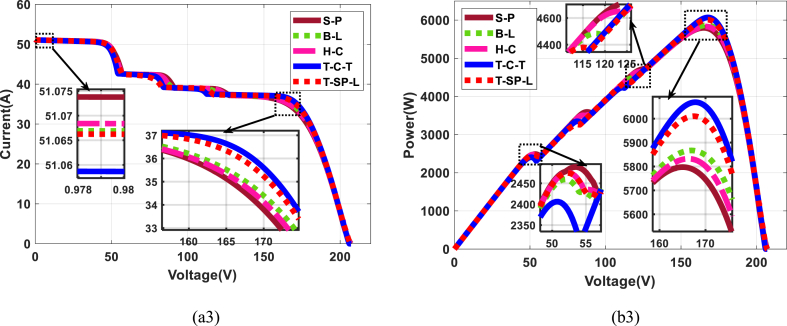
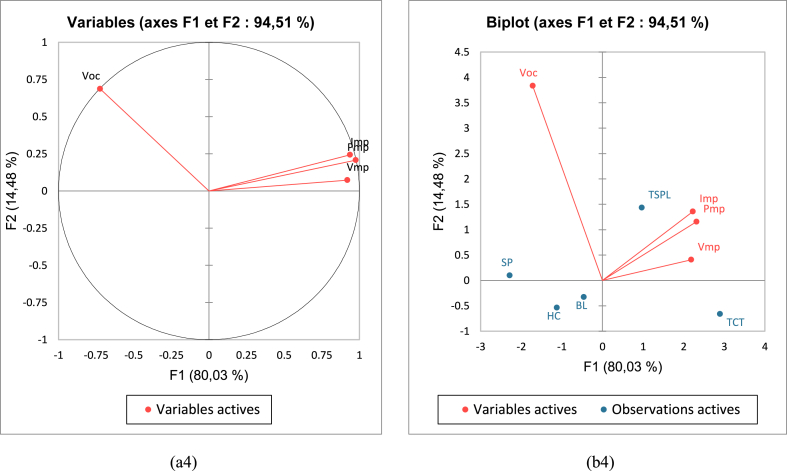
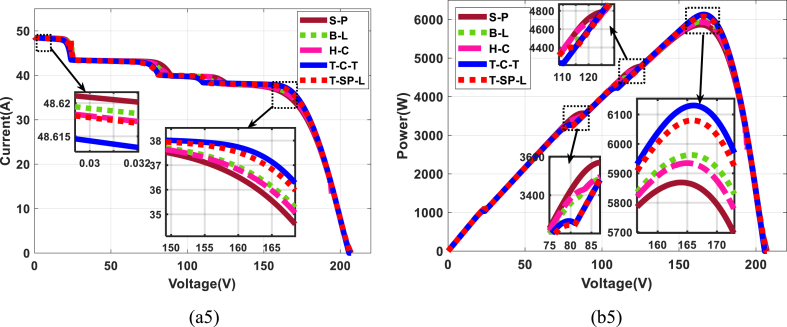
This article proposes a comparison and classification of PV system architectures with the aim of limiting the impact of the partial shading phenomenon which remains one of the most harmful defects during the production of electrical energy with significant consequences on output power, current and voltage. the methodological approach used consists of analyzing in depth the main most recent architectures developed in the current literature with their advantages and disadvantages; then define five partial shading scenarios for different irradiance levels (1000W/m2; 900W/m2; 700W/m2; 500W/m2; 300W/m2), which will then be immediately applied to five other proposed architectures: SP (serial-parallel), BL (Bridge-Link); HC (Honey Comb); TCT (Total-Cross-Tied); TSPL (Triple Series Parallel Ladder); the values obtained at the output with each of its architectures will be used for an in-depth descriptive analysis with PCA (principal component analysis) in statistics but to carry out a comparative analysis between the architectures. All with a Matlab Simulink 2022.b software environment. The results obtained offer a strong positive correlation for TCP and TSPL architectures with better weight compared to other architectures. All in accordance with the IEEE-519-2022 standard. This work is therefore positioned as a contribution to the optimization of the performance of electrical energy production through the use of PV systems which today represent widely used alternatives in the renewable energy register.
Keywords: ACP; Comparison and classifications; Modeling; PV system topologies; Partial shading.
© 2024 Published by Elsevier Ltd.
Conflict of interest statement
The authors declare that they have no known competing financial interests or personal relationships that could have appeared to influence the work reported in this paper.
Figures


References
-
- Vunnam S., VanithaSri M., et al. RamaKoteswaraRao A. Performance analysis of mono crystalline, poly crystalline and thin film material based 6 × 6 T-C-T PV array under different partial shading situations. Optik. déc. 2021;248 doi: 10.1016/j.ijleo.2021.168055. - DOI
-
- Pandian P., David P.W., Murugesan P., Murugesan P. Performance analysis of novel solar PV array configurations with reduced tie interconnection to extract maximum power under partial shading. Electric power components nand Systems. 2023:1–25. doi: 10.1080/15325008.2023.2280115. - DOI
-
- Hariharasudhan T., Prince Winston D., Palpandian M., Pravin M. A comparative analysis of polycrystalline and bifacial photovoltaic module under various partial shading condition. Energy Convers. Manag. 2022;270 doi: 10.1016/j.enconman.2022.116223. ISSN 0196-8904. - DOI
-
- Sugumar S., Prince Winston D., Pravin M. A novel on-time partial shading detection technique for electrical reconfiguration in solar PV system. Sol. Energy. 2021;225:1009–1025. doi: 10.1016/j.solener.2021.07.069. ISSN 0038-092X. - DOI
LinkOut - more resources
Full Text Sources
