. 2024 Sep 11;11(9):240765.
doi: 10.1098/rsos.240765. eCollection 2024 Sep.

Brain shapes of large-bodied, flightless ratites (Aves: Palaeognathae) emerge through distinct developmental allometries

Affiliations

Brain shapes of large-bodied, flightless ratites (Aves: Palaeognathae) emerge through distinct developmental allometries

Meghan R Forcellati et al. R Soc Open Sci. .

Abstract

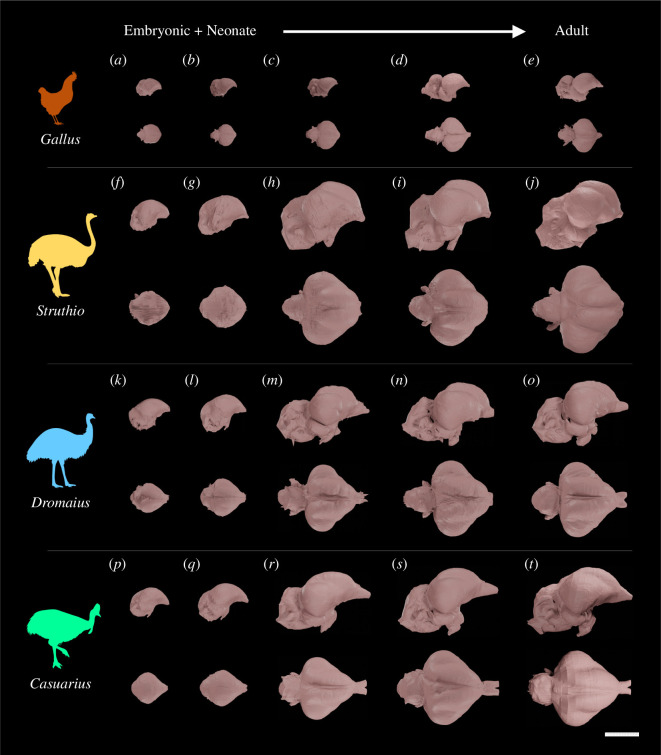
Comparative neuroanatomical studies have long debated the role of development in the evolution of novel and disparate brain morphologies. Historically, these studies have emphasized whether evolutionary shifts along conserved or distinct developmental allometric trends cause changes in brain morphologies. However, the degree to which interspecific differences between variably sized taxa originate through modifying developmental allometry remains largely untested. Taxa with disparate brain shapes and sizes thus allow for investigation into how developmental trends contribute to neuroanatomical diversification. Here, we examine a developmental series of large-bodied ratite birds (approx. 60-140 kg). We use three-dimensional geometric morphometrics on cephalic endocasts of common ostriches, emus and southern cassowaries and compare their developmental trajectories with those of the more modestly sized domestic chicken, previously shown to be in the same allometric grade as ratites. The results suggest that ratites and chickens exhibit disparate endocranial shapes not simply accounted for by their size differences. When shape and age are examined, chickens partly exhibit more accelerated and mature brain shapes than ratites of similar size and age. Taken together, our study indicates that disparate brain shapes between these differently sized taxa have emerged from the evolution of distinct developmental allometries, rather than simply following conserved scaling trends.

Keywords: Palaeognathae; allometry; endocasts; geometric morphometrics; micro-CT imaging; ontogeny.


Conflict of interest statement

We declare we have no competing interests.

Figures

Exemplar endocasts of (a–e) G gallus, (f–j) S. camelus, (k–o) D. novaehollandiae and (p–t) C. casuarius sampled for this study in rightlateral (above) and dorsal (below) views.
Figure 1.
Exemplar endocasts of (a–e) G. gallus, (fj) S. camelus, (ko) D. novaehollandiae and (pt) C. casuarius sampled for this study in right lateral (above) and dorsal (below) views. Ontogenetic sequences are ordered from most immature (left) to most mature (right) for the following specimens: (a) TLG GG015 (immature, 1 day); (b) AWRC Gg014 (immature, 1 week); (c) AWRC Gg017 (immature, 6 weeks); (d) TLG GG017 (immature, 8 weeks); (e) AWRC Gg020 (adult); (f) TLG SC094 (embryonic, approx. HH39); (g) TLG SC032 (immature, 1 day); (h) TLG SC030 (immature, 11 months); (i) TLG SC083 (adult, approx. 4.0–5.0 years); (j) TLG SC080 (adult, approx. 19.5–21.5 years); (k) TLG E139 (embryonic, approx. HH40); (l) TLG E093 (immature, 5 days); (m) TLG E115 (immature, 12 months); (n) TLG E114 (adult, greater than or equal to 3.0 years); (o) TLG E167 (adult, approx.y 14.8–16.8 years); (p) TLG C030 (embryonic, approx. HH41); (q) TLG C024 (immature, 9 days); (r) TLGC031 (immature, 14 months); (s) TLG C069 (adult, 6.2 years); (t) MOO 8031 (adult, 35.7 years). Scale bar = 2 cm.
Landmark scheme used in this study shown on the endocranial reconstruction of Dromaius novaehollandiae (TLG E054).
Figure 2.
Landmark scheme used in this study shown on the endocranial reconstruction of D. novaehollandiae (TLG E054). Red, blue and green points represent fixed, curve and surface landmarks, respectively, in (a) right oblique (c) lateral, (d) dorsal and (e) ventral views. (b) is a right lateral two-dimensional schematic diagram illustrating the main neuroanatomical region divisions being defined for this study. cer. cerebrum; cer.bl., cerebellum, o.b., olfactory bulb, br.st., brainstem, op.l., optic lobe. Figure is not to scale.
Plots of endocast centroid size against (a) days post-hatching, (b) log-transformed days post-hatching, (c) ) total (post-hatching age plus incubation age) and (d) ) log-transformed total age between ratites and G. gallus throughout ontogeny.
Figure 3.
Plots of endocast centroid size against (a) days post-hatching, (c) log-transformed days post-hatching, (b) total (post-hatching age plus incubation age) and (d) log-transformed total age between ratites and G. gallus throughout ontogeny. Note that ratites (C. casuarius, D. novaehollandiae and S. camelus) encompass endocranial volumes larger than that of G. gallus sampled for this study. Common ostriches (S. camelus) have the largest adult brains but otherwise generally overlap in size with the other ratites during ontogeny.
Morphospace of endocast shapes in (a) G. gallus and ratites; (b) within ratites (C. casuarius, D. novaehollandiae, S. camelus). Non-parametric MANOVA shows G.
Figure 4.
Morphospace of endocast shapes in (a) G. gallus and ratites; (b) within ratites (C. casuarius, D. novaehollandiae and S. camelus). Non-parametric MANOVA shows G. gallus and ratites significantly differ in endocast shapes (n = 60; R2 = 0.189; p < 0.001). Non-parametric MANOVA shows within ratites, S. camelus significantly differs in endocast shape from D. novaehollandiae and C. casuarius (n =46; R2 = 0.120; p < 0.001). In contrast, D. novaehollandiae and C. casuarius were found with non-parametric MANOVA to lack significant differences in shape (n = 32; R2 = 0.043; p = 0.217). Inset images depict extreme shapes along PC1 and PC2 in lateral view. The oldest and youngest specimens of each group, with approximate ages labelled, are indicated with arrows.
Plots of PC1 of residuals (RSC1) from the common allometric component (CAC) of endocast shapeagainst log-transformed log-centroid size for (A) G. gallus and ratites and (B) only ratites
Figure 5.
Plots of PC1 of residuals (RSC1) from the common allometric component (CAC) of endocast shape against log-transformed log-centroid size for (a) G. gallus and ratites and (c) only ratites (C. casuarius, D. novaehollandiae, S. camelus), and against log-transformed total age for (b) G. gallus and ratites and (d) only ratites. Grey bands represent 95% confidence intervals for each taxon.
Plots of regression score against log-transformed log-centroid size
Figure 6.
Plots of regression score against log-transformed log-centroid size for (a) domestic chickens (G. gallus) and ratites (C. casuarius, D. novaehollandiae and S. camelus), with the predicted minimum and maximum shapes along the regression embedded in the figure, (c) only ratites, with the predicted minimum and maximum shapes along the regression and the shape changes between D. novaehollandiae + C. casuarius and S. camelus embedded in the figure, log centroid size and against log total age for (b) G. gallus and ratites, and (d) only ratites. The inset figures in (c) overlying the regression line represent the predicted minimum and maximum shapes along the pooled regression line of D. novaehollandiae and C. casuarius, while those below reflect the same but for the ostrich regression line. The boxed inset image shows the shape difference between the predicted shape of the largest C. casuarius + D. novaehollandiae along their pooled regression line (grey spheres) and the predicted shape of largest ostrich along its own regression line (end of black lines).

Similar articles

Cited by

References

    1. Finlay BL, Darlington RB. 1995. Linked regularities in the development and evolution of mammalian brains. Science 268, 1578–1584. (10.1126/science.7777856) - DOI - PubMed
    1. Striedter GF. 2004. Brain evolution. In The human nervous system (eds Paxinos G, Mai JK), pp. 3–21, 2nd edn. London, UK: Elsevier. (10.1016/B978-012547626-3/50002-8) - DOI
    1. Rilling JK. 2006. Human and nonhuman primate brains: are they allometrically scaled versions of the same design? Evol. Anthropol. 15, 65–77. (10.1002/evan.20095) - DOI
    1. Passingham RE, Smaers JB. 2014. Is the prefrontal cortex especially enlarged in the human brain allometric relations and remapping factors. Brain Behav. Evol. 84, 156–166. (10.1159/000365183) - DOI - PubMed
    1. Barton RA, Harvey PH. 2000. Mosaic evolution of brain structure in mammals. Nature 405, 1055–1058. (10.1038/35016580) - DOI - PubMed

LinkOut - more resources