. 2024 Aug 31;14(4):547-562.
doi: 10.21037/cdt-24-83. Epub 2024 Aug 8.

Machine learning prediction of no reflow in patients with ST-segment elevation myocardial infarction undergoing primary percutaneous coronary intervention

Affiliations

Machine learning prediction of no reflow in patients with ST-segment elevation myocardial infarction undergoing primary percutaneous coronary intervention

Lin Wang et al. Cardiovasc Diagn Ther. .

Abstract

Background: No-reflow (NRF) phenomenon is a significant challenge in patients with ST-segment elevation myocardial infarction (STEMI) undergoing primary percutaneous coronary intervention (pPCI). Accurate prediction of NRF may help improve clinical outcomes of patients. This retrospective study aimed at creating an optimal model based on machine learning (ML) to predict NRF in these patients, with the additional objective of guiding pre- and intra-operative decision-making to reduce NRF incidence.

Methods: Data were collected from 321 STEMI patients undergoing pPCI between January 2022 and May 2023, with the dataset being randomly divided into training and internal validation sets in a 7:3 ratio. Selected features included pre- and intra-operative demographic data, laboratory parameters, electrocardiogram, comorbidities, patients' clinical status, coronary angiographic data, and intraoperative interventions. Post comprehensive feature cleaning and engineering, three logistic regression (LR) models [LR-classic, LR-random forest (LR-RF), and LR-eXtreme Gradient Boosting (LR-XGB)], a RF model and an eXtreme Gradient Boosting (XGBoost) model were developed within the training set, followed by performance evaluation on the internal validation sets.

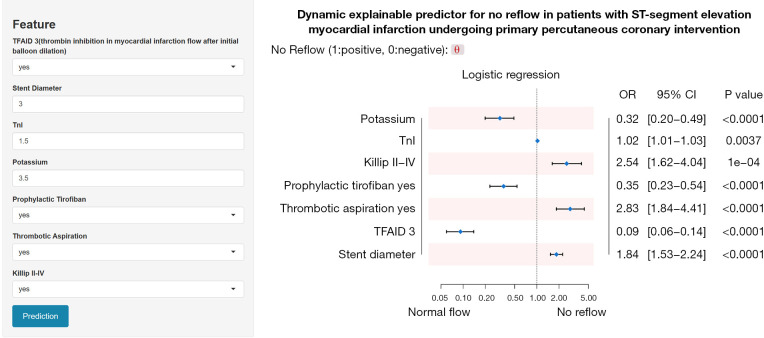
Results: Among the 261 patients who met the inclusion criteria, 212 were allocated to the normal flow group and 49 to the NRF group. The training group consisted of 183 patients, while the internal validation group included 78 patients. The LR-XGB model, with an area under the curve (AUC) of 0.829 [95% confidence interval (CI): 0.779-0.880], was selected as the representative model for logistic regression analyses. The LR model had an AUC slightly lower than XGBoost model (AUC 0.835, 95% CI: 0.781-0.889) but significantly higher than RF model (AUC 0.731, 95% CI: 0.660-0.802). Internal validation underscored the unique advantages of each model, with the LR model demonstrating the highest clinical net benefit at relevant thresholds, as determined by decision curve analysis. The LR model encompassed seven meaningful features, and notably, thrombolysis in myocardial infarction flow after initial balloon dilation (TFAID) was the most impactful predictor in all models. A web-based application based on the LR model, hosting these predictive models, is available at https://l7173o-wang-lyn.shinyapps.io/shiny-1/.

Conclusions: A LR model was successfully developed through ML to forecast NRF phenomena in STEMI patients undergoing pPCI. A web-based application derived from the LR model facilitates clinical implementation.

Keywords: Machine learning (ML); ST-segment elevation myocardial infarction (STEMI); no-reflow (NRF); primary percutaneous coronary intervention (pPCI).


Conflict of interest statement

Conflicts of Interest: All authors have completed the ICMJE uniform disclosure form (available at https://cdt.amegroups.com/article/view/10.21037/cdt-24-83/coif). The authors have no conflicts of interest to declare.

Figures

Figure 1
Figure 1
Flowchart outlining patient’s enrollment and study design. STEMI, ST-segment elevation myocardial infarction; PCI, percutaneous coronary intervention; XGBoost, eXtreme Gradient Boosting; ROC-AUC, area under the receiver operating characteristic curve.
Figure 2
Figure 2
The heatmap displaying Pearson’s correlation coefficients between variables. Red indicated positive correlation, blue signified negative correlation, and color intensity reflected strength. The scale ranged from −1 (strong negative) to +1 (strong positive). The upper triangle of the heatmap used colored circles to visually represent the strength and direction of the correlations. The lower triangle showed the exact numerical values of the correlation coefficients, with different levels of transparency indicating the strength of the correlation. Diagonal values were 1, implying a perfect correlation of each variable with itself.
Figure 3
Figure 3
Comprehensive visualization of feature engineering process. (A) The coefficient profiles of all variables using the LASSO. The optimal lambda was selected by ten-fold cross-validation, indicated by the vertical dotted line, with one standard error of the minimum criteria. (B) Illustration on the selection of appropriate parameters. Each line represented the trajectory of a variable’s coefficient as the penalty increased (log lambda). Twenty-five variables with nonzero coefficients were selected based on the optimal lambda. (C) The ranked importance of variables retained after a classic logistic regression analysis combined with forward and backward selection. Red bars represented variables associated with no-reflow, and blue bars represented those associated with normal flow. (D) The frequency of the nine most important variables during RFE with a RF algorithm. Each bar denoted the number of times a variable was selected across multiple iterations of the RFE process. (E) The average SHAP values for all variables, indicating their importance in the predictive model. The top ten features, as determined by the RFE learning curve, were highlighted in the inset at the bottom right. Higher SHAP values indicated greater importance of the feature in the model. LASSO, least absolute shrinkage and selection operator; RFE, recursive feature elimination; SHAP, SHapley Additive exPlanations; RF, random forest.
Figure 4
Figure 4
Predictive performance of ML models in the internal validation set. (A) Juxtaposition of the AUCs with 95% CI for a suite of models, encompassing the LRclassic, LR-RF, LR-XGB, RF and XGBoost models. (B) A consolidated performance synopsis, encompassing a spectrum of evaluative metrics such as AUC, accuracy, sensitivity (also known as recall), specificity, Gmeans, F-score, and the Kappa coefficient. This bar graph provided a comparative analysis of the models’ effectiveness across different evaluation criteria. (C) DCA for the optimized LR, RF, and XGBoost models. The X-axis delineated the risk threshold as a pivotal point, beyond which patients were predicted to potentially experience no-reflow. The utility of the models was accentuated when their respective DCA trajectories surpassed the ‘Treat None’ and ‘Treat All’ reference lines, affirming their clinical value. (D) Calibration curve of the optimized LR model in predicting the risk of no-reflow. The plot compared the predicted probabilities against the observed outcomes, with the ideal line representing perfect calibration. The calibration of the model was assessed using 1,000 bootstrap repetitions, with mean absolute error and mean squared error reported. LR, logistic regression; RF, random forest; XGBoost, eXtreme Gradient Boosting; DCA, decision curve analysis; AUC, area under the curve; CI, confidence interval; LRclassic, logistic regression model based on traditional variable selection methods; LR-RF, logistic regression model based on variable selection using random forest recursive feature elimination method; LR-XGB, logistic regression model based on variable selection using XGBoost recursive feature elimination method; ML, machine learning.
Figure 5
Figure 5
Exhibition of core features across distinct predictive models. (A) Optimized logistic regression forest plot showcasing feature ORs with corresponding 95% CIs and P values. The plot illustrated the strength and direction of each feature’s association with the no-reflow phenomenon. (B) Feature importance ranking using the random forest algorithm. Importance scores were based on the mean decrease Gini index, indicating the contribution of each feature to the model’s predictive power. Features with higher importance scores were more influential in predicting no-reflow. (C) SHAP summary plot from an XGBoost algorithm. Features were sorted by the sum of SHAP values across all samples in the training cohort. The plot displayed the distribution of each feature’s influence on the model output, with colors representing feature values (from low to high). SHAP values indicated the impact of each feature on the prediction, with higher values reflecting a greater effect on the model’s decisions. *, TnI indicates that TnI was log-transformed and standardized. TFAID, thrombolysis in myocardial infarction flow after initial balloon dilation; UA, uric acid; Neu, neutrophil; TnI, troponin I; Pro_tirofiban, Prophylactic tirofiban; OR, odds ratio; CI, confidence interval; SHAP, SHapley Additive exPlanations; XGBoost, eXtreme Gradient Boosting.
Figure 6
Figure 6
The screenshot of online calculator. This calculator consisted of three main sections. The left section allowed the input of numerical values or selection of categories for features included in the optimal model from this study. Upon clicking the blue button at the bottom left, the area below the title displayed the predicted outcome. The forest plot interpreted the OR for each feature concerning the outcome event. TnI, troponin I; OR, odds ratio; CI, confidence interval.

Similar articles

References

    1. Byrne RA, Rossello X, Coughlan JJ, et al. 2023 ESC Guidelines for the management of acute coronary syndromes. Eur Heart J 2023;44:3720-826. 10.1093/eurheartj/ehad191 - DOI - PubMed
    1. Chandrashekhar Y, Alexander T, Mullasari A, et al. Resource and Infrastructure-Appropriate Management of ST-Segment Elevation Myocardial Infarction in Low- and Middle-Income Countries. Circulation 2020;141:2004-25. 10.1161/CIRCULATIONAHA.119.041297 - DOI - PubMed
    1. d'Entremont MA, Alazzoni A, Dzavik V, et al. No-reflow after primary percutaneous coronary intervention in patients with ST-elevation myocardial infarction: an angiographic core laboratory analysis of the TOTAL Trial. EuroIntervention 2023;19:e394-401. 10.4244/EIJ-D-23-00112 - DOI - PMC - PubMed
    1. Rezkalla SH, Stankowski RV, Hanna J, et al. Management of No-Reflow Phenomenon in the Catheterization Laboratory. JACC Cardiovasc Interv 2017;10:215-23. 10.1016/j.jcin.2016.11.059 - DOI - PubMed
    1. Celik T, Balta S, Ozturk C, et al. Predictors of No-Reflow Phenomenon in Young Patients With Acute ST-Segment Elevation Myocardial Infarction Undergoing Primary Percutaneous Coronary Intervention. Angiology 2016;67:683-9. 10.1177/0003319715605977 - DOI - PubMed

LinkOut - more resources