. 2024 Jul 20;4(6):100582.
doi: 10.1016/j.xops.2024.100582. eCollection 2024 Nov-Dec.

Comparison of Microperimetry and Static Perimetry for Evaluating Macular Function and Progression in Retinitis Pigmentosa

Affiliations

Comparison of Microperimetry and Static Perimetry for Evaluating Macular Function and Progression in Retinitis Pigmentosa

Masatoshi Fukushima et al. Ophthalmol Sci. .

Abstract

Purpose: To compare the usefulness of microperimetry and static automated perimetry in patients with retinitis pigmentosa (RP), using macular anatomical metrics as a reference.

Design: Prospective observational study.

Participants: Forty-eight eyes of 48 patients with RP in Kyushu University Hospital who underwent microperimetry-3 (MP-3) and Humphrey Field Analyzer (HFA) 10-2 testing ≥3 times during ≥2 years were included.

Methods: Macular anatomy (ellipsoid zone [EZ] length) was assessed by OCT, and macular function was assessed by MP-3 (mean retinal sensitivity at radii 2°, 4°, and 8°) and HFA10-2 program (mean retinal sensitivity at radii 2°, 4°, and 8°). Correlations between functional and anatomical parameters were analyzed cross sectionally at baseline and longitudinally by comparing the rate of progression.

Main outcome measures: Correlation coefficients between anatomical and functional metrics.

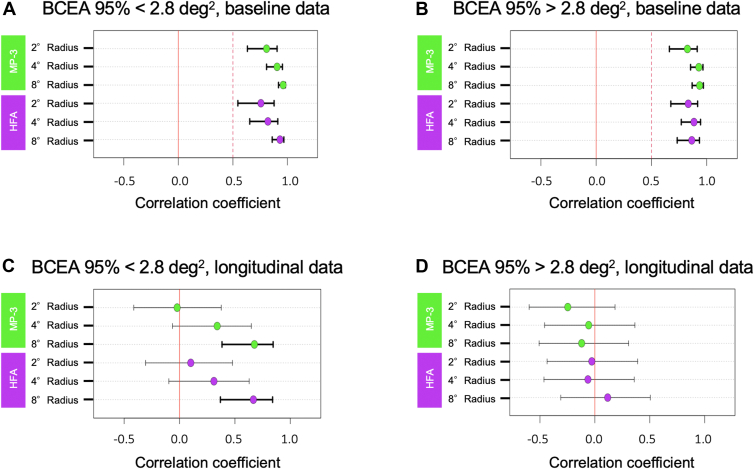
Results: The mean age at baseline was 50.1 ± 12.3 years, and the mean follow-up period was 2.8 ± 0.7 years. At baseline, EZ length was significantly correlated with MP-3 mean retinal sensitivity at radii 2°, 4°, and 8° (Spearman's ρ = 0.65, 0.84, 0.89; all P < 0.005) and HFA10-2 mean retinal sensitivity at radii 2°, 4°, and 8° (Spearman's ρ = 0.61, 0.73, 0.78; all P < 0.005). Longitudinal analysis showed that the slope of EZ length (-88.92 μm/year) was significantly correlated with the slope of MP-3 retinal sensitivity at 8° radius (-0.62 decibels [dB]/year; Spearman's ρ = 0.31, P=0.03) and the slope of HFA retinal sensitivity at 8° radius (-0.60 dB/year; Spearman's ρ = 0.43, P < 0.005).

Conclusions: Both MP-3 and HFA values were cross sectionally well-correlated with EZ length in patients with patients; however, these associations became weaker in the longitudinal analysis. This highlights the need for researchers to explore additional or more sensitive parameters to better monitor RP progression.

Financial disclosures: Proprietary or commercial disclosure may be found in the Footnotes and Disclosures at the end of this article.

Keywords: Disease progression; Microperimetry; OCT; Retinitis pigmentosa; Static perimetry.


Figures

Figure 1
Figure 1
Methods used to evaluate the macular function with MP-3 and HFA and the macular structure with OCT. A, In MP-3 data analysis, retinal sensitivity loci was divided into the area of 2° radius (central 4 points), 4° radius (central 16 points), and 8° radius (central 40 points). B, In HFA data analysis, retinal sensitivity loci was divided into the area of 2° radius (central 4 points), 4° radius (central 12 points), and 8° radius (central 52 points). C, The EZ length in OCT image was measured as indicated by the orange arrow. EZ = ellipsoid zone; HFA = Humphrey Field Analyzer; MP-3 = microperimetry-3.
Figure 2
Figure 2
Relationships between EZ length and retinal functional parameters in cross-sectional baseline RP patient data. Scatter plots show the associations of EZ length with the mean retinal sensitivity of MP-3 at the radius 2° (A), 4° (B), and 8° (C), and the mean retinal sensitivity of HFA at the radius 2° (D), 4° (E), and 8° (F). Green dots indicate MP-3 data, and purple dots indicate HFA data. dB = decibels; EZ = ellipsoid zone; HFA = Humphrey Field Analyzer; MP-3 = microperimetry-3; RP = retinitis pigmentosa.
Figure 3
Figure 3
Correlation coefficients at the radii of 2°, 4°, and 8° in cross-sectional baseline data. Green and purple dots show correlation coefficients between EZ length and retinal sensitivities measured by MP-3 or HFA at the radii of 2°, 4°, and 8°. Bars show 95% confidence interval bounds for each correlation coefficient. All retinal sensitivities with either MP-3 or HFA were significantly correlated with EZ length. The correlation coefficients were analyzed by Spearman’s rank correlation test. EZ = ellipsoid zone; HFA = Humphrey Field Analyzer; MP-3 = microperimetry-3.
Figure 6
Figure 6
Relationships between the regression coefficients of EZ length and those of retinal functional parameters in the longitudinal RP patient data. Scatter plots show the associations of EZ length slope with the mean retinal sensitivity slope of MP-3 at the radius 2° (A), 4° (B), and 8° (C), and the mean retinal sensitivity of HFA at the radius 2° (D), 4° (E), and 8° (F). Green dots indicate MP-3 data, and purple dots indicate HFA data. dB = decibels; EZ = ellipsoid zone; HFA = Humphrey Field Analyzer; MP-3 = microperimetry-3; RP = retinitis pigmentosa.
Figure 7
Figure 7
Correlation coefficients at the radii of 2°, 4°, and 8° in longitudinal data. Green and purple dots show correlation coefficients between the slopes of EZ length and retinal sensitivities measured by MP-3 or HFA at the radii of 2°, 4°, and 8°. Bars show 95% confidence interval bounds for each correlation coefficient. The slopes of retinal sensitivities at the radius of 8° with either MP-3 or HFA were significantly correlated with those of EZ length. The correlation coefficients were analyzed by Spearman’s rank correlation test. EZ = ellipsoid zone; HFA = Humphrey Field Analyzer; MP-3 = microperimetry-3.
Figure 8
Figure 8
Subgroup analysis of correlation coefficients by fixation stability. Green and purple dots show correlation coefficients between EZ length and retinal sensitivities measured by MP-3 or HFA at the radii of 2°, 4°, and 8° in cross-sectional baseline data (A and B) or in longitudinal data (C and D) in the better fixation stability (BCEA 95% < 2.8 deg2) group (A and C) or in worse fixation stability (BCEA 95% >2.8 deg2) group (B and D). Bars show 95% confidence interval bounds for each correlation coefficient. The correlation coefficients were analyzed by Spearman’s rank correlation test. BCEA = bivariate contour ellipse area; EZ = ellipsoid zone; HFA = Humphrey Field Analyzer; MP-3 = microperimetry-3.

References

    1. Hartong D.T., Berson E.L., Dryja T.P. Retinitis pigmentosa. Lancet. 2006;368:1795–1809. - PubMed
    1. Cehajic-Kapetanovic J., Xue K., Martinez-Fernandez de la Camara C., et al. Initial results from a first-in-human gene therapy trial on X-linked retinitis pigmentosa caused by mutations in RPGR. Nat Med. 2020;26:354–359. - PMC - PubMed
    1. von Krusenstiern L., Liu J., Liao E., et al. Changes in retinal sensitivity associated with cotoretigene toliparvovec in X-linked retinitis pigmentosa with RPGR gene variations. JAMA Ophthalmol. 2023;141:275. - PMC - PubMed
    1. Comander J., Weigel DiFranco C., Green Sanderson K., et al. Natural history of retinitis pigmentosa based on genotype, vitamin A/E supplementation, and an electroretinogram biomarker. JCI Insight. 2023;8 - PMC - PubMed
    1. Nakazawa M., Suzuki Y., Ito T., et al. Long-term effects of nilvadipine against progression of the central visual field defect in retinitis pigmentosa: an extended study. BioMed Res Int. 2013;2013:585729. - PMC - PubMed