. 2024 Aug 22:75:102796.
doi: 10.1016/j.eclinm.2024.102796. eCollection 2024 Sep.

Point-based risk score for the risk stratification and prediction of hepatocellular carcinoma: a population-based random survival forest modeling study

Affiliations

Point-based risk score for the risk stratification and prediction of hepatocellular carcinoma: a population-based random survival forest modeling study

Zhenqiu Liu et al. EClinicalMedicine. .

Abstract

Background: The precise associations between common clinical biomarkers and hepatocellular carcinoma (HCC) risk remain unclear but hold valuable insights for HCC risk stratification and prediction.

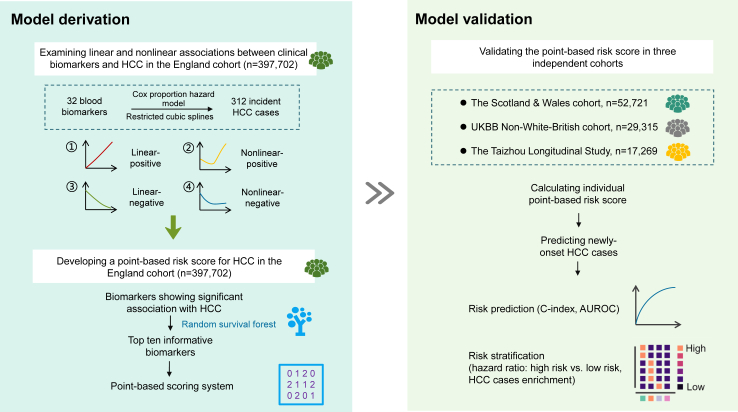
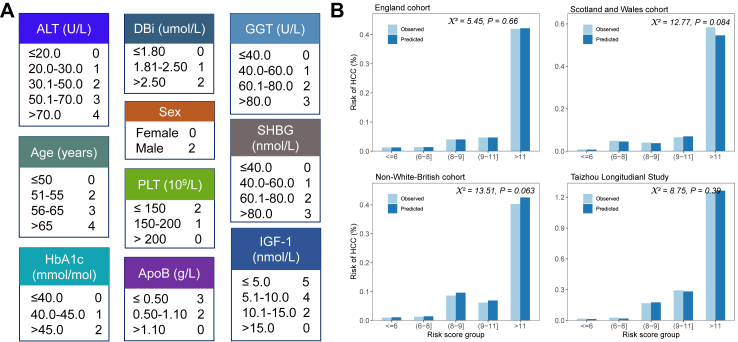
Methods: We examined the linear and nonlinear associations between the baseline levels of 32 circulating biomarkers and HCC risk in the England cohort of UK Biobank (UKBB) (n = 397,702). The participants were enrolled between 2006 and 2010 and followed up to 31st October 2022. The primary outcome is incident HCC cases. We then employed random survival forests (RSF) to select the top ten most informative biomarkers, considering their association with HCC, and developed a point-based risk score to predict HCC. The performance of the risk score was evaluated in three validation sets including UKBB Scotland and Wales cohort (n = 52,721), UKBB non-White-British cohort (n = 29,315), and the Taizhou Longitudinal Study in China (n = 17,269).

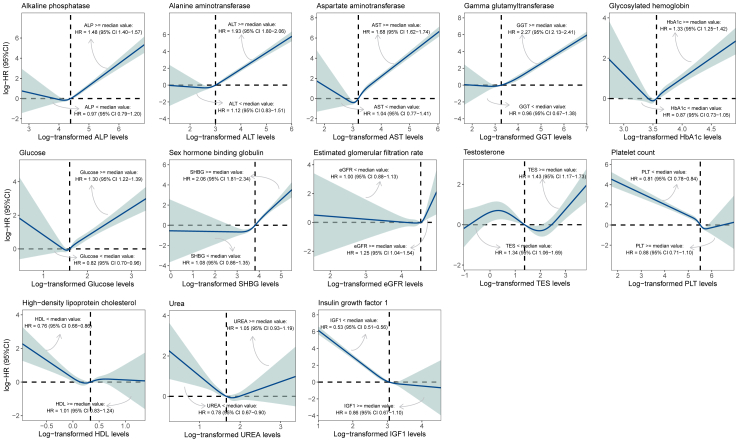
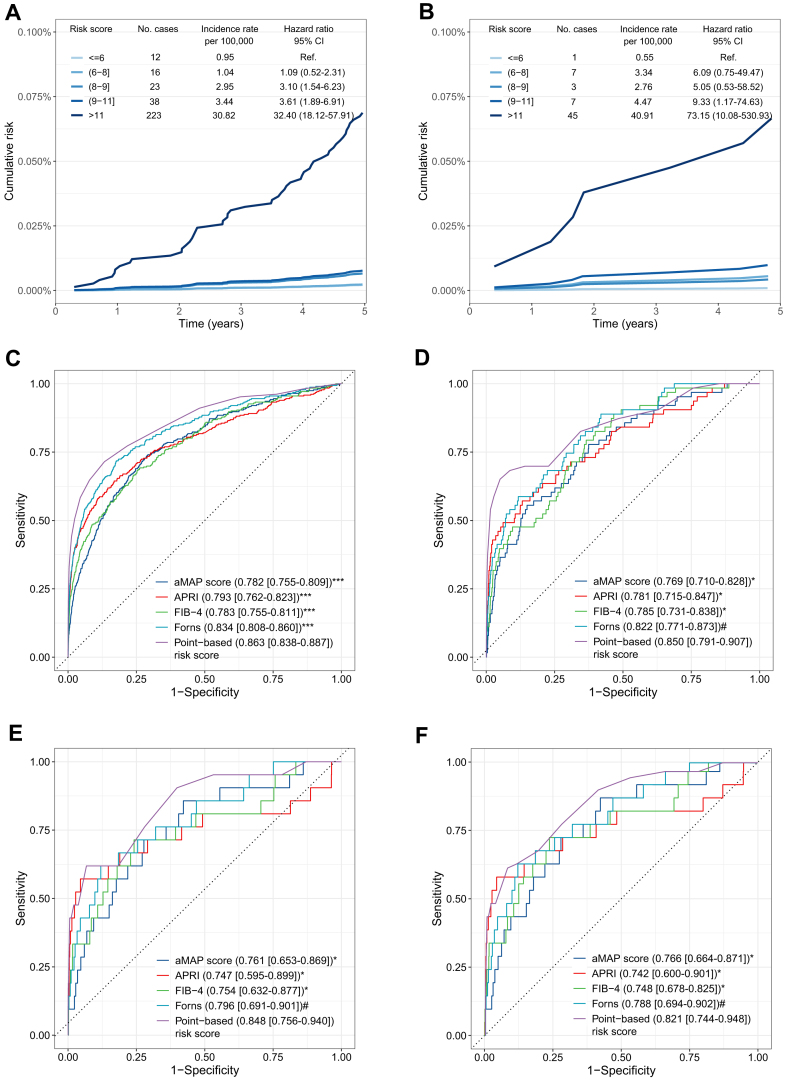
Findings: Twenty-five biomarkers were significantly associated with HCC risk, either linearly or nonlinearly. Based on the RSF model selected biomarkers, our point-based risk score showed a concordance index of 0.866 in the England cohort and varied between 0.814 and 0.849 in the three validation sets. HCC incidence rates ranged from 0.95 to 30.82 per 100,000 from the lowest to the highest quintiles of the risk score in the England cohort. Individuals in the highest risk quintile had a 32-73 times greater risk of HCC compared to those in the lowest quintile. Moreover, over 70% of HCC cases were detected in individuals within the top risk score quintile across all cohorts.

Interpretation: Our simple risk score enables the identification of high-risk individuals of HCC in the general population. However, including some biomarkers, such as insulin-like growth factor 1, not routinely measured in clinical practice may increase the model's complexity, highlighting the need for more accessible biomarkers that can maintain or improve the predictive accuracy of the risk score.

Funding: This work was supported by the National Natural Science Foundation of China (grant numbers: 82204125) and the Science and Technology Support Program of Taizhou (TS202224).

Keywords: Cohort study; Common clinical biomarkers; HCC; Nonlinear correlation; Point-based scoring system.


Conflict of interest statement

All authors declare no conflict of interests.

Figures

Fig. 1
Fig. 1
The study flowchart.
Fig. 2
Fig. 2
The linear association of age and 12 clinical biomarkers with the risk of hepatocellular carcinoma. The hazard ratios (HR) of biomarkers were calculated from the Cox regression models and represented the risk per one standard deviation increment in the log-transformed biomarker levels. The HR of age represented the risk of HCC per 5-year increment of age. The steel blue shadow denotes the 95% confidence intervals.
Fig. 3
Fig. 3
The nonlinear association of 13 clinical biomarkers with risk of hepatocellular carcinoma. The hazard ratios (HR) were calculated by the Cox regression models and represented the risk per one standard deviation increment in the log-transformed biomarker levels. The steel blue shadow denotes the 95% confidence intervals. The vertical dash lines denote the median values of biomarkers.
Fig. 4
Fig. 4
The point-based risk scoring-system for predicting hepatocellular carcinoma. Panel A shows the point-based risk score for each biomarker. The integer 0–5 denotes the risk point for different ranges of biomarker levels. Panel B shows the calibration of the point-based risk score in the discovery and validation sets (cumulative risk of HCC at the end of follow-up were shown). ALT, alanine aminotransferase; ApoB, apolipoprotein B; PLT, platelet count; SHBG, sex hormone binding globulin; GGT, gamma glutamyltransferase; IGF-1, insulin growth factor 1; DBi, direct bilirubin; HbA1c, glycosylated hemoglobin.
Fig. 5
Fig. 5
The risk stratification and prediction abilities of the point-based risk score for hepatocellular carcinoma. Panels A and B show the 5-year cumulative risk of HCC in participants with different levels of the risk score in the England (A) and Scotland and Wales (B) cohorts, respectively. Panels C–F show the comparisons of the predictive ability of our risk score with the aMAP score and non-invasive fibrosis tests in the England (C), Scotland and Wales (D), UKBB non-White-British (E), and the Taizhou Longitudinal Study (F), respectively. The ROC curves for our risk score appear smoother compared to the stepwise appearance of the established scores. This difference arises because our point-based risk score is discretely distributed as integers between 0 and 26, while the established scores are continuously distributed over a broader range, resulting in finer steps. The differences in the number of steps between cohorts are due to variations in the distribution of each score across different populations. Larger sample sizes result in more unique score values, affecting the granularity and appearance of the ROC curves. The numbers shown in panel C-F were AUROC values and their 95% confidence interval. ∗∗∗, ∗, and # denotes P value < 0.0001, <0.05, and >0.05, respectively.

Similar articles

Cited by

References

    1. Kulik L., El-Serag H.B. Epidemiology and management of hepatocellular carcinoma. Gastroenterology. 2019;156:477–491.e1. - PMC - PubMed
    1. Aleksandrova K., Boeing H., Nöthlings U., et al. Inflammatory and metabolic biomarkers and risk of liver and biliary tract cancer. Hepatology. 2014;60:858–871. - PMC - PubMed
    1. Fedirko V., Duarte-Salles T., Bamia C., et al. Prediagnostic circulating vitamin D levels and risk of hepatocellular carcinoma in European populations: a nested case-control study. Hepatology. 2014;60:1222–1230. - PubMed
    1. Zhao L., Deng C., Lin Z., et al. Dietary fats, serum cholesterol and liver cancer risk: a systematic review and meta-analysis of prospective studies. Cancers (Basel) 2021;13:1580. - PMC - PubMed
    1. Åberg F., Helenius-Hietala J., Puukka P., et al. Interaction between alcohol consumption and metabolic syndrome in predicting severe liver disease in the general population. Hepatology. 2018;67:2141–2149. - PubMed

LinkOut - more resources