. 2024 Oct 11;135(9):890-909.
doi: 10.1161/CIRCRESAHA.124.323595. Epub 2024 Sep 12.

Myeloid-Specific JAK2 Contributes to Inflammation and Salt Sensitivity of Blood Pressure

Affiliations

Myeloid-Specific JAK2 Contributes to Inflammation and Salt Sensitivity of Blood Pressure

Mohammad Saleem et al. Circ Res. .

Abstract

Background: Salt sensitivity of blood pressure (SSBP), characterized by acute changes in blood pressure with changes in dietary sodium intake, is an independent risk factor for cardiovascular disease and mortality in people with and without hypertension. We previously found that elevated sodium concentration activates antigen-presenting cells (APCs), resulting in high blood pressure, but the mechanisms are unknown. Here, we hypothesized that APC-specific JAK2 (Janus kinase 2) through STAT3 (signal transducer and activator of transcription 3) and SMAD3 (small mothers against decapentaplegic homolog 3) contributes to SSBP.

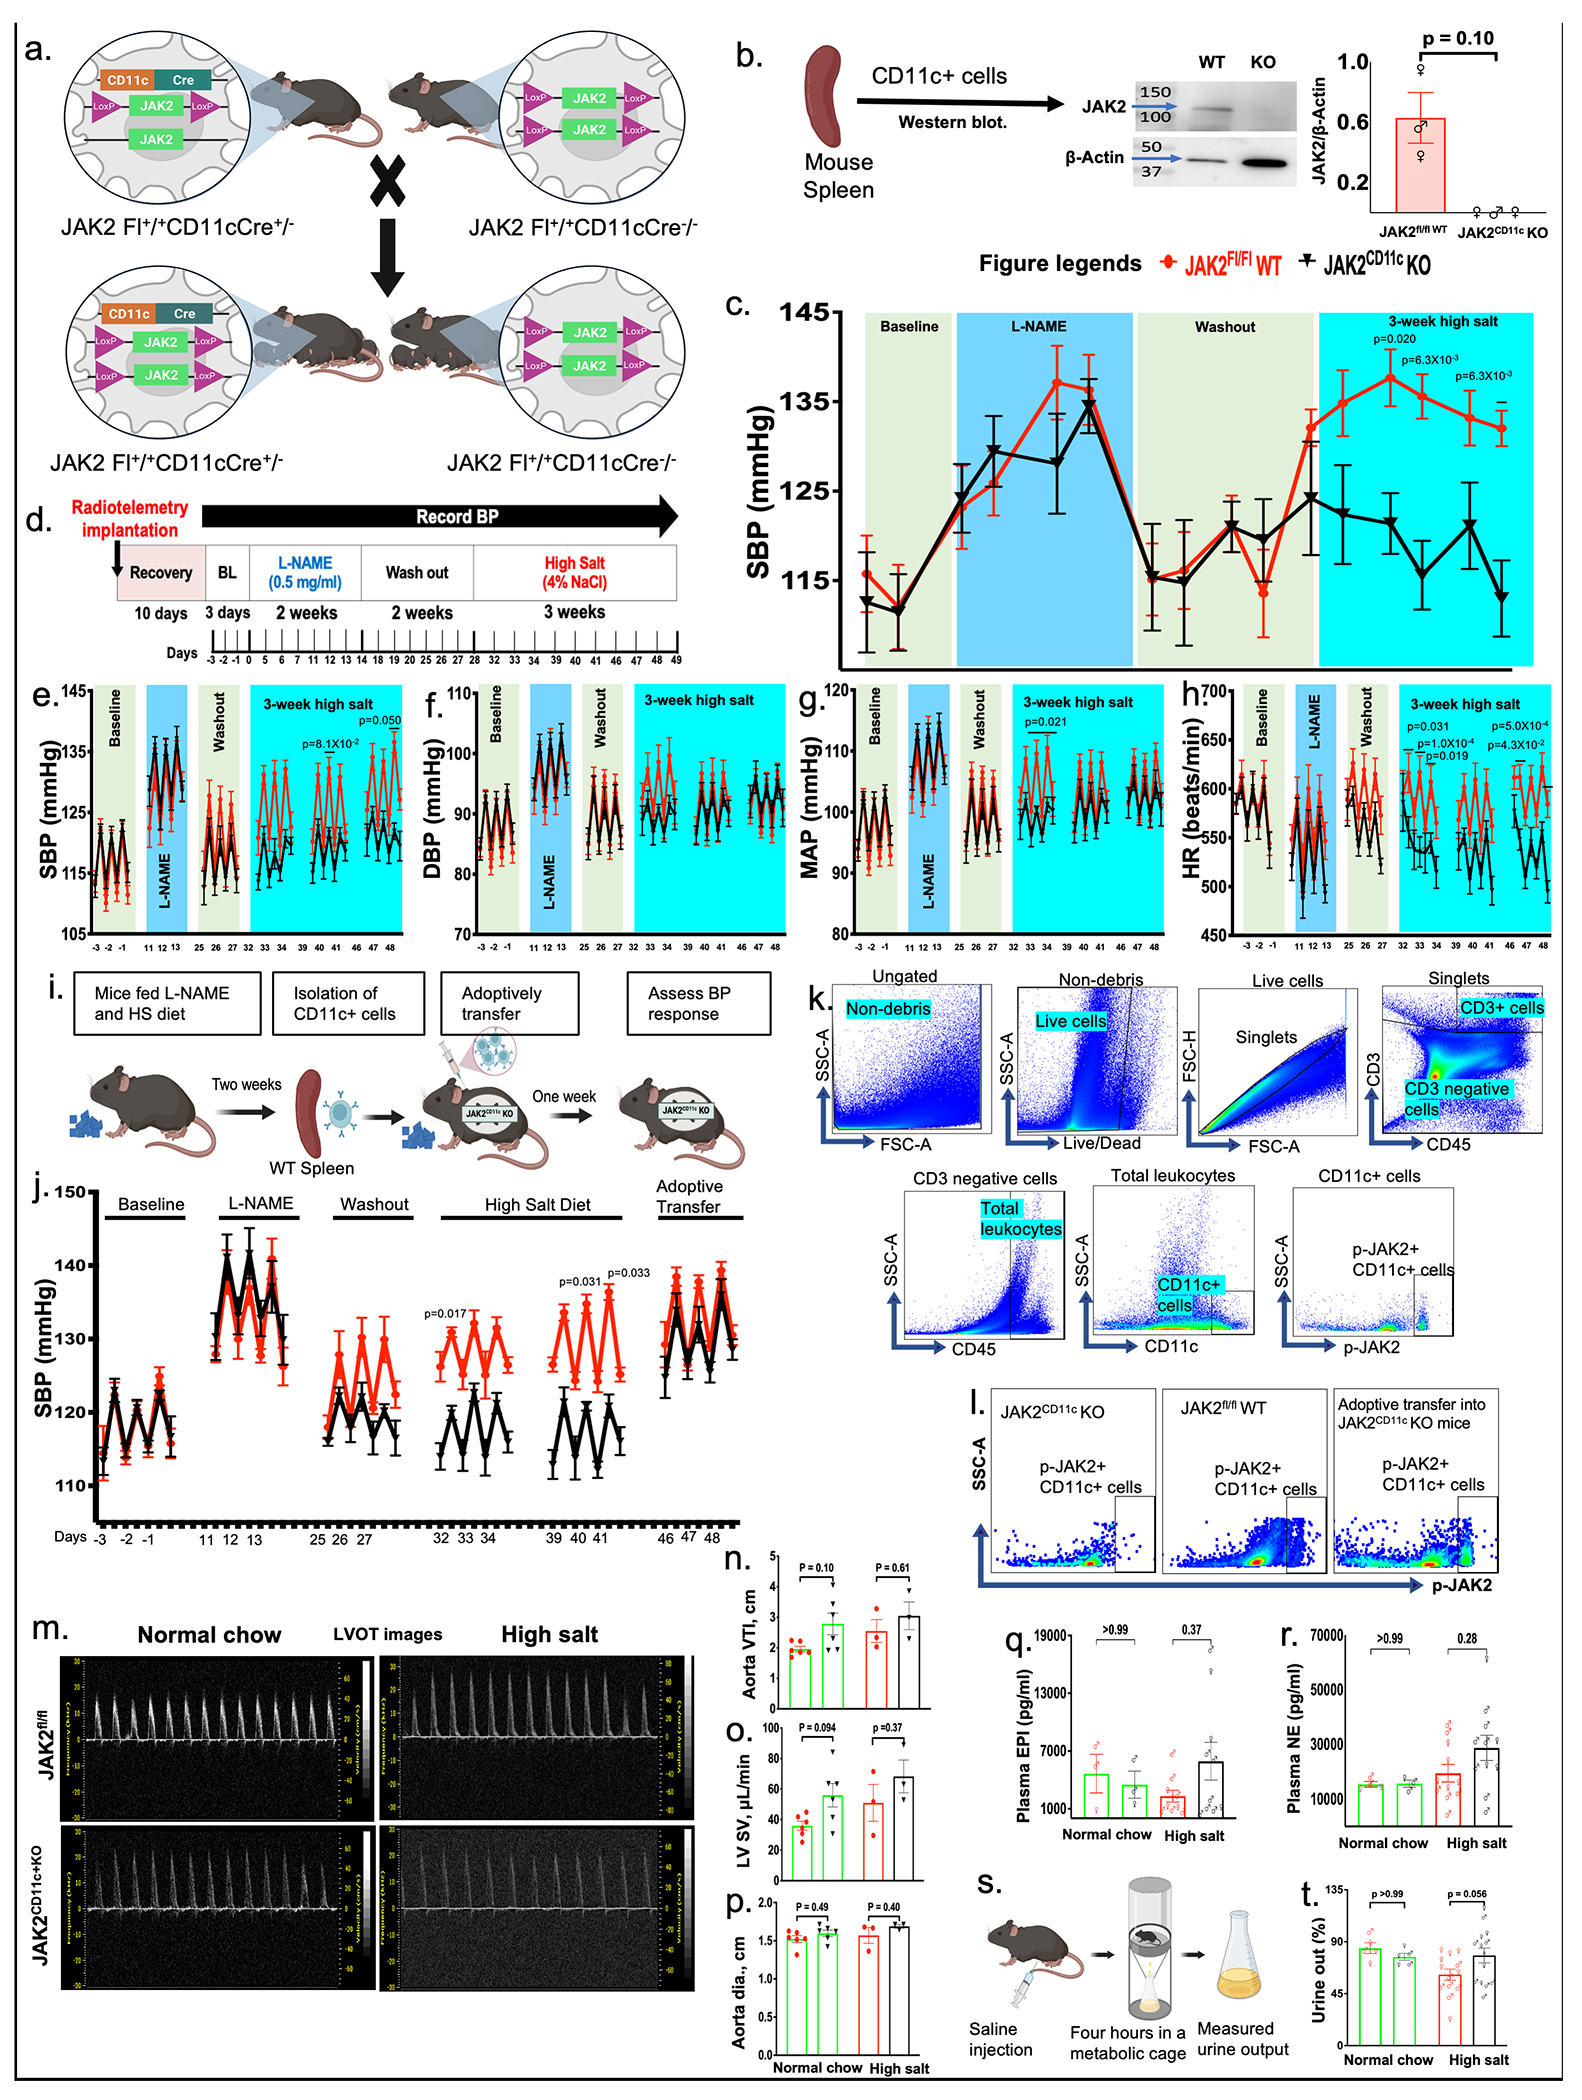
Methods: We performed bulk or single-cell transcriptomic analyses following in vitro monocytes exposed to high salt and in vivo high sodium treatment in humans using a rigorous salt-loading/depletion protocol to phenotype SSBP. We also used a myeloid cell-specific CD11c+ JAK2 knockout mouse model and measured blood pressure with radiotelemetry after N-omega-nitro-L-arginine-methyl ester and a high salt diet treatment. We used flow cytometry for immunophenotyping and measuring cytokine levels. Fluorescence in situ hybridization and immunohistochemistry were performed to spatially visualize the kidney's immune cells and cytokine levels. Echocardiography was performed to assess cardiac function.

Results: We found that high salt treatment upregulates gene expression of the JAK/STAT/SMAD pathway while downregulating inhibitors of this pathway, such as suppression of cytokine signaling and cytokine-inducible SH2, in human monocytes. Expression of the JAK2 pathway genes mirrored changes in blood pressure after salt loading and depletion in salt-sensitive but not salt-resistant humans. Ablation of JAK2, specifically in CD11c+ APCs, attenuated salt-induced hypertension in mice with SSBP. Mechanistically, we found that SMAD3 acted downstream of JAK2 and STAT3, leading to increased production of highly reactive isolevuglandins and proinflammatory cytokine IL (interleukin)-6 in renal APCs, which activate T cells and increase production of IL-17A, IL-6, and TNF-α (tumor necrosis factor-alpha).

Conclusions: Our findings reveal the APC JAK2 signaling pathway as a potential target for the diagnosis and treatment of SSBP in humans.

Keywords: Janus kinase 2; STAT3 transcription factor; Smad proteins; blood pressure; hypertension.


Conflict of interest statement

None.

Figures

Fig. 1.
Fig. 1.. High salt modulates JAK/STAT and downstream regulatory genes in human monocytes.
The pie charts in a and b show the expression of the up and down-regulated pathways. c, f, Heat maps display the visual representations of gene expression differences of the JAK/STAT/SMAD pathway after normal or high salt conditions. Bright green, bright blue, and black represent the highest, lowest, and median expression values, respectively. Rows describe the individual genes, while columns show individual samples. d, e, and g bar graphs show RPKM values for genes of the JAK/STAT/SOCS/SMAD pathway. n=11, paired analyses were performed (NS vs HS), and adjusted P values (q) are shown in bar graphs d, e, g, false discovery rate <0.05. To confirm if high salt treatment increases these signaling molecules at protein levels, we measured phosphorylation levels in CD11c+ cells isolated from the spleen of 129S1/SvImJ mice as depicted. h depicts the experimental design to perform flow cytometry. i display the gating strategy used to determine the CD11c+ cells. j-q histograms and bar graphs show the phosphorylation levels of JAK1, JAK2, TYK2, STAT1, STAT2, STAT3, SMAD2, and SMAD3. Comparisons of two groups, j-q, were performed using unpaired parametric followed by Welch’s t-tests for j-I, and n-q (normally distributed) and unpaired nonparametric followed by Mann-Whitney test for m (not normally distributed). ECM indicates extracellular matrix; TYK2, tyrosine kinase 2; JAK, Janus kinase; STAT, signal transducer and activator of transcription; SOCS, suppressor of cytokine signaling; CISH, cytokine-inducible SH2 containing protein; TGFB1, Transforming Growth Factor Beta 1; TGFBI, transforming growth factor beta-induced; TGFBR, transforming growth factor beta receptor 1; TGFBRAP1, transforming growth factor beta receptor-associated protein 1; p, phosphorylation; MFI, mean fluorescence intensity.
Fig. 2.
Fig. 2.. JAK2/STAT3/SMAD3 transcript expression changes mirror blood pressure changes after salt-load and depletion in hypertensive patients.
a, Experimental design for the inpatient rapid salt-load and depletion protocol b, UMAP representation of multiple immune cell type clusters using antibody-derived tags identifying different immune cell types. c, UMPAs with different markers to identify monocytes and dendritic cells. d, UMAP depiction of monocyte and dendritic cell clustering at baseline, after salt loading (SL) and salt depletion (SD). e, Dot plot illustration of the percent and average expression of JAK/STAT/SMAD and associated genes in different immune cells. f, Heatmap hierarchical clustering of JAK/STAT/SOCS/SMAD gene expression in DCs. g, is the UMAP illustration of JAK2, j, for STAT3, and l, for SMAD3 gene expression at baseline, after SL and SD in SR and SS patients. n=8-9. h, is the correlation of pulse pressure with JAK2, and m is with SMAD3. i, k, and n show the JAK2, STAT3, and SMAD3 correlation with fractional excretion of sodium (FENa). Similarly, o and p show the correlation of SMAD3 with urinary sodium excretion (UNaV) and fractional excretion of potassium (FEK). The correlations were analyzed using linear regression, and significance was computed with a 2-tailed Pearson test for figures h, i, k, and m-o. To understand if the JAK2 mutation, V617F, affects the phosphorylation levels of the JAK2, STAT3, and SMAD3, we performed flow cytometry on PBMC from JAK2 gain-of-function mutation and control participants. r, shows the experimental design, and s depicts the gating strategy to determine the distinct groups of immune cells. t, u, and v show the p-JAK2, p-STAT3, and p-SMAD3 levels in DCs. Comparisons of two groups, t-v, were performed using unpaired parametric followed by Welch’s t-tests (normally distributed). JAK indicates Janus kinase; TYK2, tyrosine kinase 2; STAT, signal transducer and activator of transcription; SOCS, suppressor of cytokine signaling; CISH, cytokine-inducible SH2 containing protein; TGFB1, Transforming Growth Factor Beta 1; TGFBI, transforming growth factor beta-induced; TGFBR, transforming growth factor beta receptor 1; TGFBRAP1, transforming growth factor beta receptor-associated protein 1; IL6, interleukin 6; IL6R, interleukin receptor 6; TNF, tumor necrosis factor-alpha; IFNG, interferon-gamma. B indicates baseline; SL, salt load; SD, salt depletion; PP, pulse pressure; FENa, fractional sodium excretion; UNaV, urinary sodium volume; FEK, fractional potassium excretion; and p, phosphorylation, MFI, mean fluorescence intensity.
Fig. 3.
Fig. 3.. Loss of JAK2 in myeloid CD11c+ cells protects from salt-induced high blood pressure and preserves response to volume load in the kidney.
a, JAK2 Fl+/+CD11cCre+/ (JAK2CD11cKO) Mice were generated by crossing JAK2fl/fl mice with tgCD11cCRE+/+ transgenic mice. The JAK2fl/fl littermates were used as control mice. The isolated splenocytes were used to run the WB depicted in b, and the right side shows the quantification of JAK2 protein expression in JAK2fl/fl and JAK2CD11cKO mice. We normalized the density of JAK2 expression with loading control beta-actin. c, shows the tail-cuff measurement of systolic blood pressure (SBP) at baseline, L-after NAME treatment, and high salt diet treatment. d, Experimental design and the timeline of blood pressure measurement with state-of-the-art radio-telemetry technique. e, shows the systolic blood pressure (SBP), f, diastolic blood pressure (DBP), g, mean arterial pressure (MAP), and h, heart rate (HR) in JAK2fl/fl and JAK2CD11cKO mice. We performed an adoptive transfer experiment to determine the specificity and role of myeloid CD11c cells in causing SSBP (Fig. 3i–k). i, experimental design, j, SBP results, k, gating strategy for flow cytometry, and l, p-JAK2 expression in CD11c+ cells. n=5, male 2, female 3. Echocardiography was performed to assess cardiac function. m, the LV outflow tract (LVOT) images. n, quantification of aorta VTI, o, LVSV, and q, aorta diameter. All data are expressed at mean ±SEM; n=12-13, male 6, female 7. We employed a paired two-way ANOVA with Bonferroni repeated measure post hoc test. To measure catecholamines, blood was collected by puncturing the left ventricle with a syringe and stored in Eppendorf tubes containing 10 μl EGTA-glutathione. Plasma EPI and NE were measured at Vanderbilt University Medical Center Hormone Assay and Analytical Services Core. q, bar graphs show the plasma level of epinephrine (EPI) and r, norepinephrine (NE) in mice treated with L-NAME/HS, for normal chow, n=10 for L-NAME/HS. s, an experimental scheme was to collect urine using metabolic cages for the saline challenge experiment. t, bar graphs show the urine output measurement of both mice groups after the four-hour saline challenge. n=5 for normal chow, 13-14 for L-NAME/HS. A two-way ANOVA with Bonferroni repeated measure post hoc test was used to compare the groups. JAK represents Janus kinase; L-NAME, L-NG-Nitro arginine methyl ester; W.B., Western blot; VTI, Velocity time integral; LVSV, left ventricle stroke volume. All data are expressed as a mean ± SEM.
Fig. 4:
Fig. 4:. Loss of JAK2 in myeloid CD11c+ cells prevents salt-induced phosphorylation of STAT3 and SMAD3 in renal immune cells.
We treated mice with L-NAME and high salt, and at the end of the experiment, the mice were euthanized. We perfused mice with 0.09% saline, and perfused kidney, spleen, and aorta were collected and processed to obtain a single-cell suspension. Flow cytometry samples were prepared following an established protocol in our laboratory. a, Gating strategy to identify the myeloid cells of flow cytometry data. We used fluorescence minus one (FMO) control to set the proper gates (not shown). b, Representative flow cytometry histograms show the expression levels of p-STAT3 in CD45+ (total leukocytes), c, in DCs, d, in monocytes, and h, in macrophages. Similarly, representative histogram e, shows the expression levels of p-SMAD3 in CD45+ (total leukocytes), f, in DCs, g, in monocytes, and i, in macrophages. In histogram figures, red and black colors indicate JAK2fl/fl and JAK2CD11cKO respectively, and treated with L-NAME/high salt; green color indicates both JAK2fl/fl and JAK2CD11cKO fed with normal chow. n=4-5 for normal chow, n=7-10 for L-NAME/HS. Two-way ANOVA with Bonferroni repeated measure post hoc test was used to compare the groups. j, Blot shows the expression of proteins p-STAT3, k, p-SMAD3 and l, SOCS3. n=4-7, we used unpaired parametric followed by Welch’s t-tests for normally distributed data in Fig. j, l, and unpaired nonparametric followed by Mann-Whitney test for k. We performed additional experiments to further address the STAT3 and SMAD3 activation pathways. We performed experiments using IL-6, and TGF-β 1 recombinant proteins, which are canonical JAK-STAT and TGF-SMAD pathway activators, respectively. We isolated CD11c+ cells from the spleen of JAK2fl/fl and JAK2CD11cKO mice. Similar experiments were performed in CD11c+ splenocytes isolated from 129S1/SvImJ mice. m, Representative flow cytometry histograms show the expression levels of p-JAK2, n, p-STAT3, and o, p-SMAD3 in CD11c+ myeloid cells isolated from the spleens of JAK2fl/fl and JAK2CD11cKO mice; the right side are the quantifications. p, Representative flow cytometry histograms show the expression levels of p-JAK2, r, p-STAT3, and q, p-SMAD3 in CD11c+ myeloid cells isolated from the spleens of 129S1/SvImJ mice. Two-way ANOVA with Bonferroni repeated measure post hoc test was used to compare the groups. s, Pictorial depiction of the potential interactions between JAK2/STAT3/SMAD3 pathway. SSC-A indicates a side scatter area; FSC-A, a forward scatter area; FSC-H, a forward scatter height. STAT indicates signal transducer and activator of transcription; SOCS, suppressor of cytokine signaling; JAK, Janus kinase. All data are expressed as a mean ± SEM.
Fig. 5.
Fig. 5.. Loss of JAK2 in myeloid CD11c+ cells prevents salt-induced fibrosis and immune cell infiltration in the kidney.
a, Masson’s Trichrome staining of the kidney cortex. The white star represents the highest deposition of collagen, scale bar 50μm. b, quantification of fibrosis. c, F4/80 immunostaining for macrophages in the kidney, scale bar 50μm. d, quantification of f4/80+ cells. e, Representative dot plots for total leukocytes (CD45+), f, for monocytes (CD115+), g, for DCs (CD11c+/IA/IE+), and h, for macrophages (MerTK+); the right side is the quantification. i, and j, Representative histograms showing the expression levels of IsoLG, and IL-6 in CD45+ (total leukocytes), k, and l, in DCs, and m, and n, in monocytes; the right side is the quantification. o, Representative flow cytometry histograms showing the expression levels of TNF-α in macrophages; the right side is the quantification. n= 4-5 for normal chow, 5-13 for L-NAME/HS. Two-way ANOVA with Bonferroni repeated measure post hoc test was used to compare the groups. SSC-A indicates a side scatter area; IsoLG, isolevuglandins; IL-6, interleukin-6, MHCII, Major Histocompatibility Complex, Class II; DCs, dendritic cells; TNF-α, Tumor Necrosis Factor-α. All data are expressed as a mean ± SEM.
Fig. 6.
Fig. 6.. Loss of JAK2 in myeloid CD11c+ cells prevents salt-induced T-cell infiltration and inflammation in the kidney.
a, Shows the gating strategy to identify lymphocytes. We used fluorescence minus one (FMO) controls to set the correct gates (not shown). b, Representative dot plots showing total lymphocytes (CD3+); c, T helper (CD4+) and cytotoxic T (CD8a+) cells; d, CD4+ effector memory (TEM) and central memory (TCM) T-cells; and e, showing CD8a+ effector memory (TEM) and central memory (TCM) cells; the right side is the quantification. f, Representative flow cytometry histograms show the expression levels of TNF-α, g, IL-17A, and h, IL-6 in CD8a+ effector memory (TEM) T-cells; the right side is the quantification. Likewise, i, the representative histogram shows the expression levels of TNF-α, j, IL-17A, and k, IL-6 in CD8a+ central memory (TEM) T-cells; the right side is the quantification. In histogram figures, red and black colors indicate JAK2fl/fl, and JAK2CD11cKO, respectively, and treated with L-NAME/high salt; green color indicates both JAK2fl/fl and JAK2CD11cKO fed with normal chow. n= 4-5 for the normal chow group, 5-13 for the L-NAME/HS group. We used two-ANOVA with Bonferroni repeated measure post hoc test to compare the groups. SSC-A indicates a side scatter area; FSC-A, a forward scatter area; FSC-H, a forward scatter height. IFN-γ indicates interferon-γ; TNF-α, Tumor Necrosis Factor-α; IL-17, interleukin-17A. All data are expressed as a mean ± SEM.
Fig. 7.
Fig. 7.. Loss of JAK2 in myeloid CD11c+ cells prevents salt-induced IL-6 and ENaC-γ subunit expression in the kidney.
We performed Fluorescence In-Situ Hybridization (FISH) in paraffin-embedded kidneys isolated from mice treated with L-NAME/HS regimen. Green fluorescence represents CD11c+ mRNA expression; magenta IL-6 mRNA expression; red ENaC-γ expression; and yellow represents JAK2 mRNA expression; blue, nuclei. a, Representative confocal microscopy images of CD11c expression, b, IL-6 expression, c, JAK2 expression, and d, merged. Similarly, e, Representative microscopy images of CD11c expression, f, ENaC-γ, g, JAK2 expression, and h, merged. We were limited in the number of channels in the microscope, so we needed to stain two sequential slides for four different markers. n=2, scale bar, 50 μm. The original magnification was 63x. JAK2 indicates Janus kinase 2; IL-6, interleukin-6; ENaC-γ, epithelial sodium channels; PCT, proximal convoluted tubules; DCT, distal convoluted tubules; DT, distal tubules; CNT, connecting tubules.
Fig. 8.
Fig. 8.. Schematic depiction of salt-induced activation of JAK/STAT pathway leading to the phosphorylation of SMAD3, consequently contributing to SSBP.
Consumption of a high salt diet increases extracellular sodium, entering myeloid CD11c+ cells through the ENaC channel; ENaC expression was lowered in the kidney of JAK2CD11cKO mice. High intracellular sodium activates NADPH oxidase activity, which increases superoxide production, leading to elevated IsoLG protein adduct formation and IL-6 expression. IL-6, by activating JAK2/STAT3 pathway, renders SMAD3 phosphorylation. Activated SMAD3 increases NADPH oxidase gene expression, resulting in elevated IsoLG protein adduct formation and other proinflammatory cytokines expression. IsoLG protein adducts are highly immunogenic and are presented to T cells, which increases proinflammatory cytokines, including IL-17A, IL-6, and TNF-α. This phenomenon renders a highly inflammatory milieu in the kidney, leading to sodium retention and renal vascular dysfunction that leads to salt-sensitive hypertension. JAK2 indicates Janus kinase 2; STAT, signal transducer and activator of transcription; SOCS, suppressor of cytokine signaling; ENaC, epithelial sodium channels; IsoLG, isolevuglandins; TNF, Tumor Necrosis Factor; and IL, interleukin.

References

    1. He FJ, MacGregor GA. Reducing population salt intake worldwide: from evidence to implementation. Prog Cardiovasc Dis. 2010;52:363–382. doi: 10.1016/j.pcad.2009.12.006 - DOI - PubMed
    1. Weinberger MH, Fineberg NS, Fineberg SE, Weinberger M. Salt sensitivity, pulse pressure, and death in normal and hypertensive humans. Hypertension. 2001;37:429–432. doi: 10.1161/01.hyp.37.2.429 - DOI - PubMed
    1. Morimoto A, Uzu T, Fujii T, Nishimura M, Kuroda S, Nakamura S, Inenaga T, Kimura G. Sodium sensitivity and cardiovascular events in patients with essential hypertension. Lancet. 1997;350:1734–1737. doi: 10.1016/S0140-6736(97)05189-1 - DOI - PubMed
    1. Strazzullo P, D’Elia L, Kandala NB, Cappuccio FP. Salt intake, stroke, and cardiovascular disease: meta-analysis of prospective studies. BMJ. 2009;339:b4567. doi: 10.1136/bmj.b4567 - DOI - PMC - PubMed
    1. Barbaro NR, Foss JD, Kryshtal DO, Tsyba N, Kumaresan S, Xiao L, Mernaugh RL, Itani HA, Loperena R, Chen W, et al. Dendritic Cell Amiloride-Sensitive Channels Mediate Sodium-Induced Inflammation and Hypertension. Cell Rep. 2017;21:1009–1020. doi: 10.1016/j.celrep.2017.10.002 - DOI - PMC - PubMed

MeSH terms