. 2025 Feb;21(8):e2405618.
doi: 10.1002/smll.202405618. Epub 2024 Sep 12.

Rational Design of Lipid Nanoparticles for Enhanced mRNA Vaccine Delivery via Machine Learning

Affiliations

Rational Design of Lipid Nanoparticles for Enhanced mRNA Vaccine Delivery via Machine Learning

Seo-Hyeon Bae et al. Small. 2025 Feb.

Abstract

Since the coronavirus pandemic, mRNA vaccines have revolutionized the field of vaccinology. Lipid nanoparticles (LNPs) are proposed to enhance mRNA delivery efficiency; however, their design is suboptimal. Here, a rational method for designing LNPs is explored, focusing on the ionizable lipid composition and structural optimization using machine learning (ML) techniques. A total of 213 LNPs are analyzed using random forest regression models trained with 314 features to predict the mRNA expression efficiency. The models, which predict mRNA expression levels post-administration of intradermal injection in mice, identify phenol as the dominant substructure affecting mRNA encapsulation and expression. The specific phospholipids used as components of the LNPs, as well as the N/P ratio and mass ratio, are found to affect the efficacy of mRNA delivery. Structural analysis highlights the impact of the carbon chain length on the encapsulation efficiency and LNP stability. This integrated approach offers a framework for designing advanced LNPs and has the potential to unlock the full potential of mRNA therapeutics.

Keywords: lipid nanoparticles (LNPs); mRNA expression efficiency; mRNA vaccines; machine learning (ML) techniques; structural optimization.


Conflict of interest statement

The authors declare no conflict of interest.

Figures
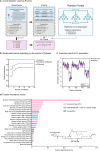
Figure 1
Figure 1
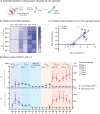
Machine learning (ML) analysis for predicting the mRNA expression efficiency and assessing feature importance of the ionizable lipid substructure and LNP composition. a) Overall ML process. Graphical images were created with BioRender.com. b) Model performance depending on the number of features. c) Prediction result of intradermal (I.D.) mRNA expression. d) Feature importance scores.
Figure 2
Figure 2
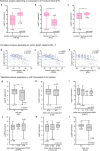
Statistical analysis between features and I.D. mRNA expression efficiency. The I.D. mRNA expression levels utilized for statistical analysis were replaced by a logarithmic transformation. a–c) Statistical analysis depending on substructure of FH, d–f) Correlation analysis depending on carbon length in EB and T. g–l) Statistical analysis depending on LNP composition and formulation. In the box plots graphs (a–c and g–l), the central line of each box denotes the median, the box edges indicate the interquartile range (IQR), and the whiskers represent the range of the data (1.5 times the IQR from the first and third quartile). The number of samples (n) is shown for each group. Statistical significance was defined as * p < 0.05, ** p < 0.01, and *** p < 0.001. In the scatter plots (d–f), the solid lines represent the regression line, while the dotted lines indicate the standard error. The correlation coefficient (r) is shown for each regression line.
Figure 3
Figure 3
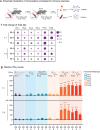
Formulation of LNPs using selected ionizable lipids and physicochemical properties of mRNA‐loaded LNPs. a) Schematic diagram of 36 ionizable lipids selected for systematic analysis. b) Schematic illustration of RLuc‐loaded mRNA‐LNPs formulated with ionizable lipids selected using ML. Graphical images were created with BioRender.com. c) Encapsulation efficiency (EE) of mRNA‐loaded LNPs. Data are represented as the mean ± standard deviation. Statistical significance was analyzed using two‐way ANOVA and defined as * p < 0.05, *** p < 0.001, and **** p < 0.0001. (P.C, positive control).
Figure 4
Figure 4
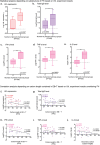
In vivo analysis of mRNA expression and immune response depending on LNP types. The results of all experiments were compared by substituting fold change based on the values of the Nil group included in the experiment in question. a) Schematic of immunization schedules for hEPO‐LNP. Seven‐week‐old ICR (Institute of Cancer Research) mice were immunized with 10 µg/40 µL of hEPO‐LNPs. Blood was collected 6 h later, and serum was separated. Subsequently, analysis was performed by ELISA. b) Relative hEPO expression. c) Correlation analysis to confirm the results of I.M. and I.D. expression. All results are logarithmically scaled. d) Relative values of MCP‐1 and IL‐6 in serum. e) Schematic illustration of immunization schedules for HPV‐LNP. Seven‐week‐old C57BL/6 mice prime/boost immunized with LNPs encapsulating HPV mRNA (10 µg) or Dulbecco's phosphate‐buffered saline through I.M. injection. f–g) Experimental results were compared by replacing the fold change with the values of the Nil group included in the experiment. f) Serum samples were collected from mice 1 week after the second immunization with mRNA‐LNPs, and the levels of total IgG were measured using ELISA. g) Number of HPV peptide‐specific IFN‐γ cells in splenocytes was measured using ELISpot. Data are represented as the mean ± standard deviation. Statistical significance was analyzed using two‐way ANOVA and defined as * p < 0.05, ** p < 0.01, *** p < 0.001, and **** p < 0.0001. Graphical images were created with BioRender.com.
Figure 4
Figure 4
In vivo analysis of mRNA expression and immune response depending on LNP types. The results of all experiments were compared by substituting fold change based on the values of the Nil group included in the experiment in question. a) Schematic of immunization schedules for hEPO‐LNP. Seven‐week‐old ICR (Institute of Cancer Research) mice were immunized with 10 µg/40 µL of hEPO‐LNPs. Blood was collected 6 h later, and serum was separated. Subsequently, analysis was performed by ELISA. b) Relative hEPO expression. c) Correlation analysis to confirm the results of I.M. and I.D. expression. All results are logarithmically scaled. d) Relative values of MCP‐1 and IL‐6 in serum. e) Schematic illustration of immunization schedules for HPV‐LNP. Seven‐week‐old C57BL/6 mice prime/boost immunized with LNPs encapsulating HPV mRNA (10 µg) or Dulbecco's phosphate‐buffered saline through I.M. injection. f–g) Experimental results were compared by replacing the fold change with the values of the Nil group included in the experiment. f) Serum samples were collected from mice 1 week after the second immunization with mRNA‐LNPs, and the levels of total IgG were measured using ELISA. g) Number of HPV peptide‐specific IFN‐γ cells in splenocytes was measured using ELISpot. Data are represented as the mean ± standard deviation. Statistical significance was analyzed using two‐way ANOVA and defined as * p < 0.05, ** p < 0.01, *** p < 0.001, and **** p < 0.0001. Graphical images were created with BioRender.com.
Figure 5
Figure 5
Analysis of the main substructural features in ionizable lipids. All results are logarithmically scaled. a–e) Statistical analysis depending on substructure of FH based on I.M. experiment results. f–j) Correlation analysis depending on carbon length of EB+T based on I.M. experiment results considering FH. FHs with phenolic hydroxyl groups (FH‐4, FH‐5, and FH‐6) are indicated by light‐colored dots. The black lines denote the correlation analysis for all 36 LNPs. The colored lines show the correlation for FHs with phenolic hydroxyl groups. In the box plots (a–e), the central line of each box denotes the median, the box edges indicate the interquartile range (IQR), and the whiskers represent the range of the data (1.5 times the IQR from the first and third quartile). Statistical significance was defined as * p < 0.05, ** p < 0.01, and *** p < 0.001. In the scatter plots (f–j), the solid lines represent the regression line. The correlation coefficient (r) is shown for each regression line.
Figure 6
Figure 6
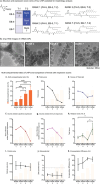
Structural relationship of LNPs with expression performance. a) Expression score ranks and the chemical structure of ranked LNPs. b, Cryo‐transmission electron microscopy images of ranked LNPs (scale bar: 100 nm). c–k) Relationship between multi‐compartmental ratio and expression performance of LNPs by expressing multi‐compartmental ratio as a column in each graph. c, Multi‐compartmental ratio of ranked LNPs. d) Total score (sum of expression level and immune response level) of ranked LNPs. e) Scores of total IgG of ranked LNPs. f) Scores of related cytokine expression (IFN‐γ, IL‐2, and TNF‐α) of ranked LNPs. g) Scores of related immune responses (total IgG and cytokine expression) of ranked LNPs. h) Relative level of IL‐6 of ranked LNPs. The results were compared by substituting the fold change based on the values of the Nil group included in the experiment in question. This part is related to the IL‐6 levels shown in Figure 4. i) Particle size of ranked LNPs. j) Zeta potential of ranked LNPs. k) Encapsulation efficiency (EE, %) of ranked LNPs. Data are represented as the mean ± standard deviation. Statistical significance was analyzed using two‐way ANOVA and defined as * p < 0.05, ** p < 0.01, *** p < 0.001, and **** p < 0.0001.

References

    1. Pardi N., Hogan M. J., Porter F. W., Weissman D., Nat. Rev. Drug Discovery 2018, 17, 261. - PMC - PubMed
    1. Hou X., Zaks T., Langer R., Dong Y., Nat. Rev. Mater. 2021, 6, 1078. - PMC - PubMed
    1. Han X., Zhang H., Butowska K., Swingle K. L., Alameh M.‐G., Weissman D., Mitchell M. J., Nat. Commun. 2021, 12, 7233. - PMC - PubMed
    1. Hald Albertsen C., Kulkarni J. A., Witzigmann D., Lind M., Petersson K., Simonsen J. B., Adv. Drug Delivery Rev. 2022, 188, 114416. - PMC - PubMed
    1. Xu Y., Golubovic A., Xu S., Pan A., Li B., J. Mater. Chem. B 2023, 11, 6527. - PubMed

Publication types

LinkOut - more resources