. 2024 Nov;11(41):e2401856.
doi: 10.1002/advs.202401856. Epub 2024 Sep 12.

Mitochondrial tRNAGlu 14693A > G Mutation, an "Enhancer" to the Phenotypic Expression of Leber's Hereditary Optic Neuropathy

Affiliations

Mitochondrial tRNAGlu 14693A > G Mutation, an "Enhancer" to the Phenotypic Expression of Leber's Hereditary Optic Neuropathy

Lihao Jin et al. Adv Sci (Weinh). 2024 Nov.

Abstract

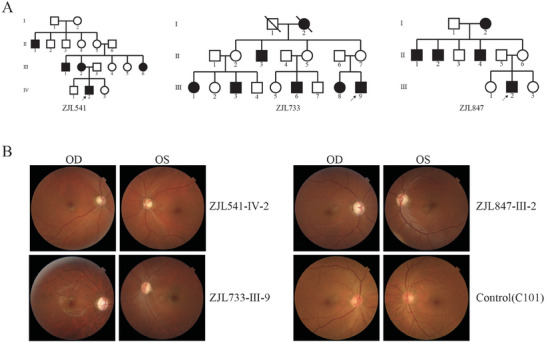
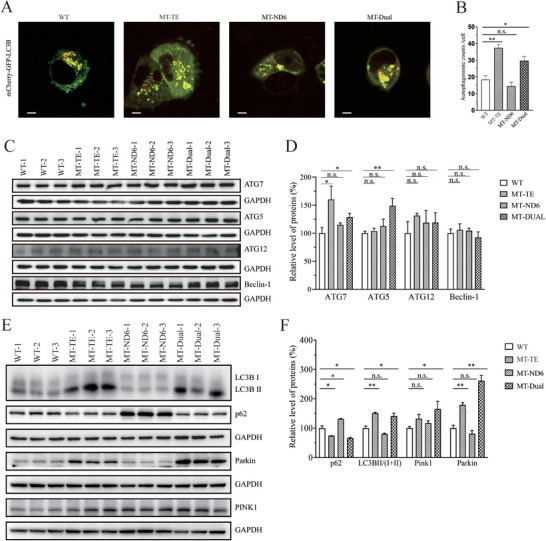
Leber's hereditary optic neuropathy (LHON), a maternally inherited ocular disease, is predominantly caused by mitochondrial DNA (mtDNA) mutations. Mitochondrial tRNA variants are hypothesized to amplify the pathogenic impact of three primary mutations. However, the exact mechanisms remained unclear. In the present study, the synergistic effect of the tRNAGlu 14693A > G and ND6 14484T > C mutations in three Chinese families affected by LHON is investigated. The m.14693A > G mutation nearly abolishes the pseudouridinylation at position 55 of tRNAGlu, leading to structural abnormalities, decreased stability, aberrant mitochondrial protein synthesis, and increased autophagy. In contrast, the ND6 14484T > C mutation predominantly impairs complex I function, resulting in heightened apoptosis and virtually no induction of mitochondrial autophagy compared to control cell lines. The presence of dual mutations in the same cell lines exhibited a coexistence of both upregulated cellular stress responses to mitochondrial damage, indicating a scenario of autophagy and mutation dysregulation within these dual-mutant cell lines. The data proposes a novel hypothesis that mitochondrial tRNA gene mutations generally lead to increased mitochondrial autophagy, while mutations in genes encoding mitochondrial proteins typically induce apoptosis, shedding light on the intricate interplay between different genetic factors in the manifestation of LHON.

Keywords: apoptosis; leber's hereditary optic neuropathy; mitochondrial tRNA mutation; mitophagy; phenotypic expression.


Conflict of interest statement

The authors declare no conflict of interest.

Figures

Figure 1
Figure 1
Clinical and genetic characterization of eight Chinese families. A) LHON in three Han Chinese families. Vision‐impaired individuals are indicated by black symbols. B) Fundus photographs (Cannon CR6‐45NM) of Chinese patients, carriers, and control subjects.
Figure 2
Figure 2
Alteration in the structure and conformation of mitochondrial tRNAGlu. A) Cloverleaf structure and Schematic of the tertiary structure of wild type and mutant human mitochondrial tRNAGlu. Red dashed lines represent the anticipated disturbances in tertiary base pairings. B) Mitochondrial RNA from control (C101.2) and mutant (HZL017‐III‐3.3) cells were incubated with CMCT for CMC modification of Ψ residues. Reverse transcription was carried out to identify the stops caused by CMC‐pseudouridine. C) Assessment of conformation changes by PAGE analysis under native conditions. D) Melting profiles of WT and MT tRNAGlu transcripts measured at 260 nm with a heating rate of 1° min−1 from 25 to 95°. First derivative (dA/dT) against temperature curves was shown to highlight the Tm value transitions. E) S1 and angiogenin digestion pattern of tRNAGlu and tRNAPro purified from the control cell line (C101.2) and mutant cell line (HZL017‐III‐3.3). Cleavage products of tRNAs were resolved in 10% desaturating PAGE gels with 8 M urea, electroblotted, and hybridized with specific 3′ end DIG‐labeled oligonucleotide probes.
Figure 3
Figure 3
Assessment of mitochondrial function. A) Western blot analysis of mitochondrial proteins. 20 µg of total cellular proteins from various cell lines were electrophoresed through a denaturing polyacrylamide gel, electroblotted, and immuno‐detected with ten respiratory complex subunits specific antibodies in mutant and control cells with TOM20 as a loading control. B) Quantification of OXPHOS subunits levels in control and mutant cell lines. C) Measurement of mitochondrial ROS. The rates of ROS generation by mitochondria in living cells from mutant and control cell lines were analyzed by a Novocyte flow cytometer (ACEA Biosciences) using the mitochondrial superoxide indicator MitoSOX‐Red (5 mm). A, flow cytometry histogram showing MitoSOX‐Red fluorescence of various cell lines. D) Western blot analysis of three antioxidative enzymes. 20µg of total proteins from various cell lines was electrophoresed, electroblotted, and hybridized with catalase, SOD1, and SOD2 antibodies and with GAPDH as a loading control. E) Relative ratios of MitoSOX‐Red fluorescence intensity. F) quantification of SOD2, SOD1, and Catalase. Average relative values of SOD2, SOD1, and Catalase were normalized to the average values of GAPDH in various cell lines. G) Measurement of cellular and mitochondrial ATP levels using a bioluminescence assay. Cells were incubated with 10 mm glucose or 5 mm 2‐deoxy‐d‐glucose plus 5 mm pyruvate to determine ATP generation under mitochondrial ATP synthesis. Average rates of ATP level per cell line and are shown. H) An analysis of O2 consumption rate (OCR) in the various cell lines using different inhibitors. The OCRs were first measured on 1 × 10⁴ cells of each cell line under basal condition and then sequentially added oligomycin (1.5 µM), carbonyl cyanide p‐(trifluoromethoxy)phenylhydrazone (FCCP) (0.5 µM), rotenone (1 µM) and antimycin A (1 µM) at indicated times to determine different parameters of mitochondrial functions. I) Graphs presented the ATP‐linked OCR, proton leak OCR, maximal OCR, reserve capacity OCR, and non‐mitochondrial OCR in mutant and control cell lines. Non‐mitochondrial OCR was determined as the OCR after rotenone/antimycin A treatment. Basal OCR was determined as OCR before oligomycin minus OCR after rotenone/antimycin A. ATP‐linked OCR was determined as OCR before oligomycin minus OCR after oligomycin. Proton leak OCR was determined as basal OCR minus ATP‐linked OCR. Maximal OCR was determined as the OCR after FCCP minus non‐mitochondrial OCR. Reserve capacity OCR was defined as the difference between maximal OCR after FCCP minus basal OCR. The average values of three determinations for each cell line are shown. Data are represented as mean ± SEM. Statistical significance is indicated as follows: n.s., no significance, *p < 0.05, ***p < 0.01, ***p < 0.001. Asterisks represent the level of significance in comparison to the control group.
Figure 4
Figure 4
Investigation of apoptosis. A) Annexin V/PI apoptosis assay by flow cytometry. Cells were harvested and stained with Annexin V and 1 µL of PI. Flow cytometric plots show cells in the live, early apoptosis, and late apoptosis stages. Apoptosis rate increased in mutant cells compared with control cells. (B) Western blot analysis of apoptosis related proteins. 20 µg of total proteins from various cell lines were electrophoresed, electroblotted, and hybridized with Bcl‐XL, BAD, Caspase 9, Caspase 3, CytC, BAX, BCL2L13 antibodies and with GAPDH as a loading control. C) Relative Annexin V‐positive cells from various cell lines. Three independent determinations were done in each cell line. D) Quantification of seven proteins associated with apoptosis. Three independent determinations were done in each cell line. E) Representative images of TUNEL assay in control and mutant cells. F) Quantification of apoptotic cells in control and mutant cell lines. Graph details and symbols as in Figure 3.
Figure 5
Figure 5
Evaluation of autophagy. A) Representative images of mCherry‐GFP‐LC3B transfection in various cell lines. B) Autophagic flux was quantitatively assessed by counting the number of GFP and mCherry puncta per cell in live images. A minimum of 50 cells per treatment group was analyzed. C) Western blot analysis for ATG5, ATG7, ATG12 and Beclin‐1. 20 µg of total cellular proteins from various cell lines was electrophoresed, electroblotted, and hybridized with ATG5, ATG7, ATG12, and Beclin‐1 antibodies, with GAPDH as a loading control. D) Quantification of four autophagy related proteins, ATG5, ATG7, ATG12, and Beclin‐1 in mutant and control cell lines. E) Western blot analysis for mitophagic response proteins LC3‐I/(I+II), p62, Parkin, and PINK1. 20 µg of total cellular proteins from various cell lines was electrophoresed, electroblotted, and hybridized with LC3, p62, Parkin, and PINK1 antibodies, with GAPDH as a loading control. F) Quantification of four autophagy related proteins, LC3, p62, Parkin, and PINK1 in mutant and control cell lines. Graph details and symbols as in Figure 3.

References

    1. Zuccarelli M., Vella‐Szijj J., Serracino‐Inglott A., Borg J. J., Eur. J. Ophthalmol. 2020, 30, 1220. - PubMed
    1. Danese A., Patergnani S., Maresca A., Peron C., Raimondi A., Caporali L., Marchi S., La Morgia C., Del Dotto V., Zanna C., Iannielli A., Segnali A., Di Meo I., Cavaliere A., Lebiedzinska‐Arciszewska M., Wieckowski M. R., Martinuzzi A., Moraes‐Filho M. N., Salomao S. R., Berezovsky A., R. Belfort, Jr. , Buser C., Ross‐Cisneros F. N., Sadun A. A., Tacchetti C., Broccoli V., Giorgi C., Tiranti V., Carelli V., Pinton P., Cell Rep. 2022, 40, 111124. - PMC - PubMed
    1. Priglinger C., Klopstock T., Rudolph G., Priglinger S. G., Klin Monbl Augenheilkd 2019, 236, 1271. - PubMed
    1. Bargiela D., Chinnery P. F., Neurosci. Lett. 2019, 710, 132932. - PubMed
    1. Nie Z., Wang C., Chen J., Ji Y., Zhang H., Zhao F., Zhou X., Guan M. X., Hum. Mol. Genet. 2023, 32, 231. - PMC - PubMed

LinkOut - more resources