. 2024 Nov;11(42):e2406124.
doi: 10.1002/advs.202406124. Epub 2024 Sep 12.

Enhancing Cardioprotection Through Neutrophil-Mediated Delivery of 18β-Glycyrrhetinic Acid in Myocardial Ischemia/Reperfusion Injury

Affiliations

Enhancing Cardioprotection Through Neutrophil-Mediated Delivery of 18β-Glycyrrhetinic Acid in Myocardial Ischemia/Reperfusion Injury

Dongjian Han et al. Adv Sci (Weinh). 2024 Nov.

Abstract

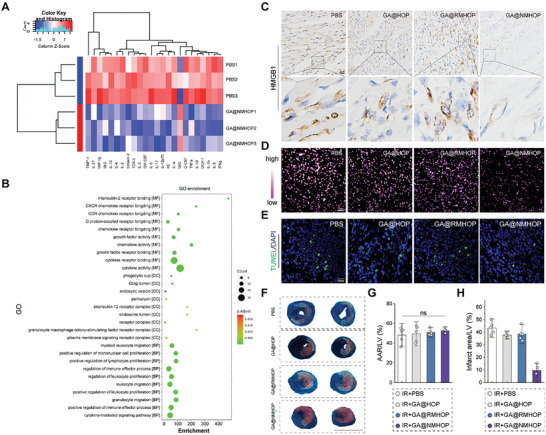
Myocardial ischemia/reperfusion injury (MI/RI) generates reactive oxygen species (ROS) and initiates inflammatory responses. Traditional therapies targeting specific cytokines or ROS often prove inadequate. An innovative drug delivery system (DDS) is developed using neutrophil decoys (NDs) that encapsulate 18β-glycyrrhetinic acid (GA) within a hydrolyzable oxalate polymer (HOP) and neutrophil membrane vesicles (NMVs). These NDs are responsive to hydrogen peroxide (H2O2), enabling controlled GA release. Additionally, NDs adsorb inflammatory factors, thereby reducing inflammation. They exhibit enhanced adhesion to inflamed endothelial cells (ECs) and improved penetration. Once internalized by cardiomyocytes through clathrin-mediated endocytosis, NDs protect against ROS-induced damage and inhibit HMGB1 translocation. In vivo studies show that NDs preferentially accumulate in injured myocardium, reducing infarct size, mitigating adverse remodeling, and enhancing cardiac function, all while maintaining favorable biosafety profiles. This neutrophil-based system offers a promising targeted therapy for MI/RI by addressing both inflammation and ROS, holding potential for future clinical applications.

Keywords: drug delivery; inflammation; myocardial ischemia‐reperfusion injury; nanomedicine; neutrophil decoys (NDs); reactive oxygen species (ROS).


Conflict of interest statement

The authors declare no conflict of interest.

Figures

Scheme 1
Scheme 1
The schematic illustration depicts the fabrication process of NDs and the underlying principle of utilizing NDs to mitigate reperfusion injury in MI/RI by reprogramming the oxidative and inflammatory microenvironment. The excessive infiltration of immune cells and the subsequent generation of ROS contribute to heightened apoptosis of cardiomyocytes. Following intravenous injection into mice, NDs initially enter the bloodstream and subsequently accumulate within the injured heart. The NDs effectively deplete ROS levels and release GA, which hinders the nuclear translocation of HMGB1 and exerts a comprehensive inhibition of inflammatory cascades.
Figure 1
Figure 1
Characterizations of neutrophil membrane‐coated NPs. A) Representative TEM images of GA@HOP, GA@RMHOP, and GA@NMHOP. Scale bar = 200 nm. B) Hydrodynamic size distribution and C) ζ potential of GA@HOP, GA@RMHOP, and GA@NMHOP. D) Representative LSCM images of GA@NMHOP (red: neutrophil membrane labeled with DiI; green: GA@HOP labeled with FITC). Scale bar = 20 µm. E–G) Changes of NPs diameters over time (0, 2, 4, 8, 12 h) in the presence of H2O2. n = 3. H) Representative TEM images of GA@HOP, GA@RMHOP, and GA@NMHOP fragments after degradation in the presence of H2O2 for 12 h. Scale bar = 200 nm. I) Accumulated GA release from GA@HOP, GA@RMHOP, and GA@NMHOP in PBS or in the presence of 1 mM H2O2. n = 3. *p < 0.05 versus PBS group. All data are shown as means ± SD. Statistical analyses were performed by two‐tailed unpaired Student's t‐test and one‐way ANOVA followed by Tukey's post‐hoc test.
Figure 2
Figure 2
In vitro neutralization of inflammatory factors and chemokines. A) Schematic representation of the co‐culture of macrophages and cardiomyocytes. B) Dose‐response neutralization of proinflammatory factors, including TNF‐α, IL‐1β, IL‐6, and CXCL2, by both RDs and NDs in MI‐CM. n = 4. C) Binding capacity of NDs to inflammatory cytokines TNF‐α, IL‐1β, IL‐6, and CXCL2. IC50 values were determined using the variable slope model in GraphPad Prism 7. n = 4. D) Schematic illustration of RAW264.7 cell stimulation using MI‐CM. E) Analysis of RAW264.7 cell activation by measuring the relative mRNA expression levels of TNF‐α, IL‐1β, IL‐6, and iNOS through RT‐qPCR analysis. n = 5. *p < 0.05 versus PBS group. All data are shown as means ± SD. Statistical analyses were performed by one‐way ANOVA followed by Tukey's post‐hoc test.
Figure 3
Figure 3
Targeting profile of NDs in vitro. A) Schematic diagram of CCK‐8. (B–F) Cell activity at five concentration gradients of NDs. B) CM: cardiomyocyte; C) MΦ: macrophage; D) EC: endothelial cell; E) CF: cardiac fibroblasts; F) Illustration of groups. n = 5. G–J) Uptake of GA@HOP, GA@RMHOP, and GA@NMHOP by macrophages in vitro. n = 6. K) Representative images of ICAM‐1 expression in HUVECs. Scale bar = 50 µm. L,M) Immunofluorescence and quantification of NPs conjugated with HUVECs. Scale bar = 20 µm. n = 3. L–N) Quantification of NPs distribution at different levels within the transwell system. n = 3. O) Quantitative analysis of fluorescence intensity in the lower chamber. n = 3. *p < 0.05 versus HOP group. All data are shown as means ± SD. Statistical analyses were performed by two‐tailed unpaired Student's t‐test and one‐way ANOVA followed by Tukey's post‐hoc test.
Figure 4
Figure 4
Protective effects of NDs in cardiomyocytes. A,B) Uptake assay and quantification of NDs by H9C2. Scale bar = 20 µm. n = 3. C) Representative images of DCFH‐DA fluorescence in H9C2 cells. Scale bar = 50 µm. D) Quantification of DCFH‐DA fluorescence intensity. n = 3. E) Cell activity of H9C2. n = 6. F) Representative images of JC‐1 (JC‐1 aggregate, red; JC‐1 monomer, green). Scale bar = 50 µm. G) Quantification of JC‐1 fluorescence intensity. n = 3. H) Western blot of HMGB1 in both the cytoplasm and nucleus. I,J) Quantification of HMGB1 in both the cytoplasm and nucleus. n = 5. K) The relative expression of HMGB1 mRNA. n = 5. L) Illustration of enzyme‐linked immunosorbent assay. M) Quantification of HMGB1 in H9C2 cell supernatants. n = 5. *p < 0.05 versus control group. #p < 0.05 versus I/R group. All data are shown as means ± SD. Statistical analyses were performed by one‐way ANOVA followed by Tukey's post‐hoc test.
Figure 5
Figure 5
In vivo targeting profile of NDs. A) Schematic illustration showing the design of animal study. B) Survival curves of mice in each treatment group. C) Blood circulation profiles of GA@HOP, GA@RMHOP, and GA@NMHOP. n = 3. D) Distribution of GA@HOP, GA@RMHOP, and GA@NMHOP in different organs. E) Quantification of total fluorescence intensity of NPs in different organs. n = 3. F,G) Representative fluorescence microscopy images and quantification of NPs distribution in infarcted areas. n = 5. Scale bar = 50 µm. H,I) Representative fluorescence microscopy images and quantification of neutrophil infiltration in infarcted areas. n = 5. Scale bar = 50 µm. *p < 0.05 versus PBS group. #p < 0.05 versus GA@HOP, GA@RMHOP group. All data are shown as means ± SD. Statistical analyses were performed by one‐way ANOVA followed by Tukey's post‐hoc test.
Figure 6
Figure 6
Inhibition of HMGB1 release and ROS production of cardiomyocytes. A) Heat map of inflammatory cytokines and chemokines. B) GO enrichment analysis of inflammatory cytokines and chemokines. C) Representative immunohistochemistry images of HMGB1 in myocardium. Scale bar = 50 µm. D) Representative images of DHE staining. Scale bar = 20 µm. E) Representative images of infarct size as stained by Evans Blue and TTC. Scale bar = 500 µm. F,G) Quantification of myocardial area at risk in relation to the left ventricle (AAR/V %) and infarct size (IS/AAR %). n = 5. H) TUNEL‐positive cardiomyocytes. Scale bar = 20 µm. *p < 0.05 versus PBS group. #p < 0.05 versus GA@HOP, GA@RMHOP group. All data are shown as means ± SD. Statistical analyses were performed by one‐way ANOVA followed by Tukey's post‐hoc test.
Figure 7
Figure 7
NDs improves ventricular function and limits adverse LV remodeling. A) Representative echocardiographic images on day 28. B–E) Quantitative analysis of LVEDD, LVEDV, LVEF (%) and LVFS (%) as assessed by echocardiography. n = 10. F) Representative Masson's trichrome staining. Scale bar = 1 cm. G,H) Quantification of fibrotic area and wall thickness. n = 5. I) Representative staining with WGA. Scale bar = 20 µm. J) Biochemical markers reflecting hepatic and renal function. n = 5. K) HE staining of important organs such as the brain, liver, spleen, kidney, and lung. Scale bar = 20 µm. *p < 0.05 versus Sham or PBS group. #p < 0.05 versus GA@HOP, GA@RMHOP group. All data are shown as means ± SD. Statistical analyses were performed by one‐way ANOVA followed by Tukey's post‐hoc test.

References

    1. Samsky M. D., Morrow D. A., Proudfoot A. G., Hochman J. S., Thiele H., Rao S. V., JAMA 2021, 326, 1840. - PMC - PubMed
    1. Gong F. F., Vaitenas I., Malaisrie S. C., Maganti K., JAMA Cardiol. 2021, 6, 341. - PubMed
    1. Bhatt D. L., Lopes R. D., Harrington R. A., JAMA 2022, 327, 662. - PubMed
    1. Reed G. W., Rossi J. E., Cannon C. P., Lancet 2017, 389, 197. - PubMed
    1. Sabatine M. S., Braunwald E., J. Am. Coll. Cardiol. 2021, 77, 2822. - PubMed

LinkOut - more resources