. 2024 Nov;11(42):e2406364.
doi: 10.1002/advs.202406364. Epub 2024 Sep 12.

ImputeHiFI: An Imputation Method for Multiplexed DNA FISH Data by Utilizing Single-Cell Hi-C and RNA FISH Data

Affiliations

ImputeHiFI: An Imputation Method for Multiplexed DNA FISH Data by Utilizing Single-Cell Hi-C and RNA FISH Data

Shichen Fan et al. Adv Sci (Weinh). 2024 Nov.

Abstract

Although multiplexed DNA fluorescence in situ hybridization (FISH) enables tracking the spatial localization of thousands of genomic loci using probes within individual cells, the high rates of undetected probes impede the depiction of 3D chromosome structures. Current data imputation methods neither utilize single-cell Hi-C data, which elucidate 3D genome architectures using sequencing nor leverage multimodal RNA FISH data that reflect cell-type information, limiting the effectiveness of these methods in complex tissues such as the mouse brain. To this end, a novel multiplexed DNA FISH imputation method named ImputeHiFI is proposed, which fully utilizes the complementary structural information from single-cell Hi-C data and the cell type signature from RNA FISH data to obtain a high-fidelity and complete spatial location of chromatin loci. ImputeHiFI enhances cell clustering, compartment identification, and cell subtype detection at the single-cell level in the mouse brain. ImputeHiFI improves the recognition of cell-type-specific loops in three high-resolution datasets. In short, ImputeHiFI is a powerful tool capable of imputing multiplexed DNA FISH data from various resolutions and imaging protocols, facilitating studies of 3D genome structures and functions.

Keywords: 3D genomes; DNA FISH data; imputation; multimodal imaging; single‐cell Hi‐C data.


Conflict of interest statement

The authors declare no conflict of interest.

Figures
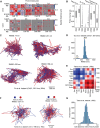
Figure 1
Figure 1
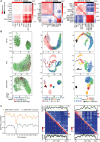
The probe missing rates and chromosomal structural similarities in multiplexed DNA FISH datasets. A) Heatmap of single‐cell spatial distances with varying probe missing rates for the mouse brain dataset at the resolution 25Kb (Takei et al., 2021). The probe missing rate is quantified as the ratio of the bin number without probe signals to the total bin number in the chromosomal region. The cell names are displayed below the heatmap. B) The probe missing rates of Takei et al., Su et al., Payne et al., and Huang et al. dataset, respectively. The probe missing rate quantifies the proportion of undetected probes relative to the total number of probes within a cell. C) 3D visualization of the imaging data at the resolution of 50 kb on chromosome 21. Red and blue represent chromosome 21 from different cells or copies, respectively. D) Distribution of the RMSD values for each chromosome relative to its nearest neighboring chromosome (Su et al. dataset, chr21, 50 kb, 651 bins). The percentage of RMSD values from 0 to 250 is 3% (278 of 7967), and from 600 to 800 is 80% (6352 of 7967). The neighbor bin distance is 500 nm. E) RMSD values between the different cell types of 1Mb resolution (Takei et al. mouse brain dataset). F) 3D visualization of two cells’ probe coordinates from Takei et al. brain dataset: Left: Astro (cell name ‘1354′) to Astro (cell name ‘1170′); Right: Astro (cell name ‘1354′) to Micro (cell name ‘1324′). G) Distribution of probe numbers with different cell absence rates of each probe. For each probe, the cell absence rate is the number of cells in which it was undetected, divided by the total number of cells. The mean cell absence rate of each probe is 0.76. The minimum is 0.6.
Figure 2
Figure 2
The clustering results of multiplexed DNA FISH data (Takei et al. mouse brain data at the resolution 1Mb) and single‐cell Hi‐C data (Lee et al. human brain data and Tan et al. mouse brain data). A) Pearson correlation coefficient within and between cell types for single cells. Each cell uses locus pairs with high variability as features. The variability of locus pairs is defined by the coefficient of variation, i.e., the standard deviation divided by the mean. B) UMAP visualization of three datasets with three different clustering methods. For the Takei et al. dataset, Exc means excitatory neurons. Inh means inhibitory neurons, which includes ‘Pvalb’, “Sst”, “Vip”, and “Ndnf”. OPC/Oligo, oligodendrocyte progenitor cells, and oligodendrocytes. For the Lee et al. dataset, “Exc” means excitatory neurons, which include “L2/3′, ‘L4”, “L5”, and “L6”. “Inh” means inhibitory neurons, which include “Pvalb”, “Sst”, “Vip”, and “Ndnf”. “Astro”, astrocyte. “ODC”, oligodendrocyte. “OPC”, oligodendrocyte progenitor cell. “MG”, microglia. “NN1”, non‐neuronal cell type 1. “Endo”, endothelial cell. For the Tan et al. dataset, Neuron type includes neonatal neuron 1, neonatal neuron 2, cortical l2–5 pyramidal cell, cortical l6 pyramidal cell, hippocampal pyramidal cell, hippocampal granule cell, interneuron, medium spiny neuron, astrocyte type includes neonatal astrocyte, adult astrocyte. Oligodendrocyte type includes oligodendrocyte progenitor and mature oligodendrocyte. C) Agreement between the merged 1Mb proximity score maps from multiplexed DNA FISH data and the merged 1Mb chromatin interaction maps from scHi‐C data for excitatory neurons (left). Control data are multiplexed DNA FISH data of other cell types. scHi‐C data (322 cells) are displayed with 1Mb bin size to compare with 1Mb resolution multiplexed DNA FISH data (1895 cells) for excitatory neurons (chr1 and chr7, middle and right, respectively). The vertical green lines on the heatmaps indicate the positions of local maxima of the insulation score, where interactions between chromosomal segments on either side are typically reduced.
Figure 3
Figure 3
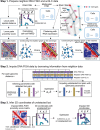
Overview of ImputeHiFI mode 1. To simplify our description, we referred to multiplexed DNA FISH as DNA FISH. Step 1: Prepare neighbor DNA FISH and scHi‐C data. ImputeHiFI uses multimodal DNA FISH, RNA FISH data, and multi‐omics scRNA‐seq and scHi‐C data. First, ImputeHiFI clusters the RNA FISH data, calculates the RMSD for DNA FISH on the same type of cells to build a cell‐type‐specific neighbor graph, and merges the neighbor DNA FISH data. Next, ImputeHiFI uses MaxFuse to match RNA FISH with scRNA‐seq data and scGAD to match scRNA‐seq with scHi‐C data. ImputeHiFI then creates a neighbor graph for the matched scHi‐C data and merges the neighbor scHi‐C data. Step 2: Impute the proximity score matrix of DNA FISH data by borrowing information from neighbor data. For each genomic distance v, ImputeHiFI determines neighbor scHi‐C data weight a and neighbor DNA FISH data weight b through the detected locus pairs in DNA FISH data. Then, ImputeHiFI uses a and b to impute the undetected locus pairs in DNA FISH data. Step 3: Infer 3D coordinates of undetected loci. Utilizing the imputed DNA FISH proximity score matrix obtained from step two, along with 3D coordinates containing undetected loci, ImputeHiFI models the proximity score as independent Poisson random variables k, where the 3D coordinates of loci serving as the Poisson parameter λ. By maximizing the likelihood, ImputeHiFI imputes the 3D coordinates of undetected loci.
Figure 4
Figure 4
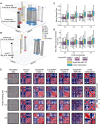
(A, B) Data preparation of ImputHiFI. (C, D, E) The imputation results of simulated multiplexed DNA FISH data. A) Match Takei et al. RNA FISH and Tan et al. scRNA‐seq data with MaxFuse. B) Match Tan et al. scRNA‐seq and Tan et al. scHi‐C data with scGAD. C) The performance of five imputation methods on the simulated dataset using MESE as the metric. D) The performance of five imputation methods on the simulated dataset using RMSD as the metric. E) Spatial distance heatmap of simulated data, ground truth, and the results of five imputation methods. Cell name: ‘1846′. Chr6: 50–100 Mb.
Figure 5
Figure 5
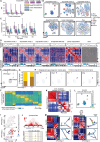
The imputation results of Takei et al. multiplexed DNA FISH data at the resolution 1Mb in the mouse brain. A) ARI between the true labels and the k‐means predicted labels of multiplexed DNA FISH data imputed with different methods and raw data. Cells with a missing rate not exceeding the specified threshold were selected. The number of repetitions is 4. B) UMAP visualization of multiplexed DNA FISH data imputed with different methods and raw data. The probe missing rate is less than 0.8. C) Boundary insulation scores of multiplexed DNA FISH data imputed with different methods and raw data. The probe missing rate is 0.8. Multiplexed DNA FISH data were merged according to cell types. The boundaries are the insulation score peaks at the transition point between A and B compartments. D) Single‐cell insulation score, heatmap, and compartment eigenvector of multiplexed DNA FISH data imputed with different methods and raw data. The cell name is ‘482′. Chr1: 3.2–195.4 Mb. E) UMAP visualization of OPC/Oligo 1 and OPC/Oligo 2 in DNA FISH imputed by ImputeHiFI mode 1. F) Mean spatial distances of lists of cell‐type‐specific locus pairs among single cells. The top 100 cell‐type‐specific locus pairs are detected from imputed multiplexed DNA FISH data (the result of ImputeHiFI mode 1). G) The proportion of marker genes for oligodendrocyte progenitor and mature oligodendrocyte within the cell type‐specific locus pairs of OPC/Oligo 1 and OPC/Oligo 2. The top 100 marker genes are detected from Tan et al. scRNA‐seq data. The top 100 cell type‐specific locus pairs are detected from imputed multiplexed DNA FISH data (the result of ImputeHiFI mode 1). H) The marker genes expression of Takei et al.’s RNA FISH data in the mouse brain. I) The enrichment scores of mature oligodendrocyte marker genes on the D2 plots of OPC/Oligo 1 and OPC/Oligo 2 (the result of ImputeHiFI mode 1). D2 plot is DNA density and distance to the nuclear periphery (DisTP) 2D matrix plot. J) Top: Heatmap of Jiang et al. mouse cerebral cortex bulk Hi‐C data. Resolution 40Kb. The position of the Exoc6b gene is chr6: 84618487‐85069513. Bottom: Bar plot of Allan et al. H3K27Ac and ATAC (Allan et al. data) mean count in oligodendrocyte Progenitor cell (rows 1, 3) and mature oligodendrocyte cell (rows 2, 4). Window size 100 bp. H3K27Ac value range: 0–90. ATAC value range: 0–60. K) Spatial distance heatmap of merged OPC/Oligo 1 and OPC/Oligo 2 cells (the result of ImputeHiFI mode 1). L) Spatial distance of locus pairs chr6: (84,86) Mb on imputed multiplexed DNA FISH data (the result of ImputeHiFI mode 1). M) Single‐cell spatial distance heatmap and 3D coordinates of chr6: 73–90 Mb on imputed multiplexed DNA FISH data (the result of ImputeHiFI mode 1).
Figure 6
Figure 6
The imputation results of three datasets: (A‐G) Takei et al. multiplexed DNA FISH data at the resolution of 25 kb in mouse brain cells, (H‐K) Takei et al. multiplexed DNA FISH data at the resolution in mESCs, and (L‐M) Huang et al. multiplexed DNA FISH data at the resolution 5 kb in mouse embryonic stem cells. A) Loop number in imputed data and raw data. B) Proportion of the loops from the raw data retained after imputation with different methods. C) Left: Loop fold change is defined as the ratio of the central contacts to the mean of the neighboring contacts (−250 kb to +250 kb). Specific loops refer to those unique in the imputed data by ImputeHiFI mode 2 compared to the raw data. Common loops are those shared between the raw data and the imputed data by ImputeHiFI mode 2. Right: Proximity score matrix heatmap of merged specific loops and common loops. D) Loop numbers for three types of loops in the imputed data by ImputeHiFI mode 2. E) Loop length is the genomic distance between loop endpoints. The Y‐axis represents the loop length interval. ImputeHiFI mode 2 result. F) The number of differential enhancer‐promoter loops between cell types. The upper triangle displays the results of the imputed data by ImputeHiFI mode 2, while the lower triangle shows results from raw data. G) Spatial distance matrix heatmap of the imputed data by ImputeHiFI mode 2. The position of the Osbpl3 gene is chr6: 50293330‐50382837. H) Same as (A). I) Same as (B). J) Same as (C). K) Two enhancer‐promoter loops in the imputed data by ImputeHiFI mode 2. The bottom three tracks are mESC CTCF, mESC H3K27ac, and mESC H3K4me3 ChIP‐seq data. The positions of the Nr5a2 and Auts2 genes are chr1: 136845314‐136960380 and chr5: 131437333‐132543220, respectively. L) Quantification of cells exhibiting Sox2 promoter‐super enhancer interaction on 129 and cast alleles. The Sox2 promoter is located at chr3: 34645000–34655000, and the super‐enhancer is at chr3: 34755000–34765000. Cells with spatial distances shorter than the median between these regions were identified as having a Sox2 promoter‐super enhancer interaction. M) Single‐cell heatmaps of spatial distance matrices from multiplexed DNA FISH data. The cell is named ‘25061′, the allele is ‘129′, and the region covers chr3: 34601078‐34806078. SE means super enhancer.

Similar articles

Cited by

References

    1. Flyamer I. M., Gassler J., Imakaev M., Brando H. B., Ulianov S. V., Abdennur N., Razin S. V., Mirny L. A., Tachibana‐Konwalski K., Nature 2017, 544, 110. - PMC - PubMed
    1. Luo X., Liu Y., Dang D., Hu T., Hou Y., Meng X., Zhang F., Li T., Wang C., Li M., Cell 2021, 184, 723. - PubMed
    1. Rao S. S. P., Huntley M. H., Durand N. C., Stamenova E. K., Bochkov I. D., Robinson J. T., Sanborn A. L., Machol I., Omer A. D., Lander E. S., Cell 2014, 159, 1665. - PMC - PubMed
    1. Bonev B., Cohen N. M., Szabo Q., Fritsch L., Papadopoulos G. L., Lubling Y., Xu X., Lv X., Hugnot J. P., Tanay A., Cell 2017, 171, 557. - PMC - PubMed
    1. Beagrie R. A., Scialdone A., Schueler M., Kraemer D. C., Chotalia M., Xie S. Q., Barbieri M., De Santiago I., Lavitas L. M., Branco M. R., Nature 2017, 543, 519. - PMC - PubMed

LinkOut - more resources