. 2024 Oct 1;63(19):2440-2448.
doi: 10.1021/acs.biochem.4c00379. Epub 2024 Sep 12.

Determination of Initial Rates of Lipopolysaccharide Transport

Affiliations

Determination of Initial Rates of Lipopolysaccharide Transport

Matthew Nava et al. Biochemistry. .

Abstract

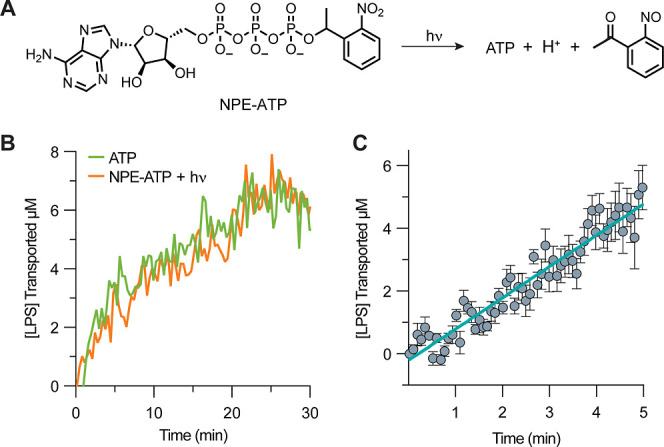
Nonvesicular lipid trafficking pathways are an important process in every domain of life. The mechanisms of these processes are poorly understood in part due to the difficulty in kinetic characterization. One important class of glycolipids, lipopolysaccharides (LPS), are the primary lipidic component of the outer membrane of Gram-negative bacteria. LPS are synthesized in the inner membrane and then trafficked to the cell surface by the lipopolysaccharide transport proteins, LptB2FGCADE. By characterizing the interaction of a fluorescent probe and LPS, we establish a quantitative assay to monitor the flux of LPS between proteoliposomes on the time scale of seconds. We then incorporate photocaged ATP into this system, which allows for light-based control of the initiation of LPS transport. This control allows us to measure the initial rate of LPS transport (3.0 min-1 per LptDE). We also find that the rate of LPS transport by the Lpt complex is independent of the structure of LPS. In contrast, we find the rate of LPS transport is dependent on the proper function of the LptDE complex. Mutants of the outer membrane Lpt components, LptDE, that cause defective LPS assembly in live cells display attenuated transport rates and slower ATP hydrolysis compared to wild type proteins. Analysis of these mutants reveals that the rates of ATP hydrolysis and LPS transport are correlated such that 1.2 ± 0.2 ATP are hydrolyzed for each LPS transported. This correlation suggests a model where the outer membrane components ensure the coupling of ATP hydrolysis and LPS transport by stabilizing a transport-active state of the Lpt bridge.


Conflict of interest statement

The authors declare no competing financial interest.

Figures

Figure 1
Figure 1
LPS structure (left) and schematic depicting LPS transport in vivo (right). Seven lipopolysaccharide transport proteins, LptB2FGCADE, form a transenvelope bridge to move LPS from the inner membrane to the cell surface upon ATP binding and hydrolysis.
Figure 2
Figure 2
Continuous fluorescence assay to monitor the flux of LPS through Lpt transporter. (A) Assay design using IM and OM proteoliposomes. Protein complexes and LPS are drawn to highlight the productive orientation. Proteins are incorporated in both directions in liposomes and LPS would be distributed across both leaflets of the IM proteoliposome. Dansyl-PMBN (right) binds LPS once it is translocated into OM proteoliposomes. (B) The fluorescence spectra (λexc = 365 nm) of dansyl-PMBN added to OM proteoliposomes in the presence or absence LPS. (C) Normalized relative QY of dansyl-PMBN with OM proteoliposomes at increasing amounts of LPS. (D) Experimental fluorescence intensity at 510 nm over time normalized to laser-shot power and initial fluorescence intensity in the presence and absence of ATP. (E) LPS transported in OM proteoliposomes. Each data point is the average of 10 consecutive measurements taken 2 s apart.
Figure 3
Figure 3
Photolysis of adenosine 5′-triphosphate, P3-(1-(2-nitro-phenyl)ethyl) ester (NPE-ATP) allows for temporal control of LPS transport. (A) Decaging photoreaction of NPE-ATP is a photolyzable precursor to ATP. (B) Lpt complex transport of LPS using either ATP (purple) or photolyzed NPE-ATP (orange). (C) Determination of initial rate of LPS transport. Error bars indicate the average of 5 technical replicates, where each time point is the average of 10 consecutive measurements taken 500 ms apart.
Figure 4
Figure 4
LPS transport rates are independent of LPS core oligosaccharide structure. (A) Structures of LPS variants used in this study. Abbreviations used: KDO = 3-deoxy-d-manno-octulosonic acid, Hep = Heptose, PPEtN = diphosphorylethanloamine, P = phosphate, Gal = galactose, Glc = glucose, GlcNAc = N-acetylglucosamine. (B) Lpt complex mediated transport of different LPS variants. (C) Average transport rates and standard deviation for LPS variants.
Figure 5
Figure 5
Mutations in LptE attenuate both Ra LPS transport and ATP hydrolysis. (A) Ra LPS transport of LptE mutants. (B) Average Ra LPS transport rates and standard deviation for LptE mutants. (C) ATP hydrolysis rates of LptE mutants. (D) Comparison of Ra LPS transport (B) and ATP hydrolysis rates (C).

Similar articles

References

    1. Rothfield L. I.Biological membranes: An overview at the molecular level. In Structure and Function of Biological Membranes; Academic Press, 1971; pp 3–9.
    1. Yarwood R.; Hellicar J.; Woodman P. G.; Lowe M. Membrane trafficking in health and disease. Dis. Models Mech. 2020, 13, dmm043448.10.1242/dmm.043448. - DOI - PMC - PubMed
    1. De Weer P. A century of thinking about cell membranes. Annu. Rev. Physiol. 2000, 62, 919–926. 10.1146/annurev.physiol.62.1.919. - DOI - PubMed
    1. Lundstedt E.; Kahne D.; Ruiz N. Assembly and maintenance of lipids at the bacterial outer membrane. Chem. Rev. 2021, 121, 5098–5123. 10.1021/acs.chemrev.0c00587. - DOI - PMC - PubMed
    1. Rothman J. E.; Wieland F. T. Protein sorting by transport vesicles. Science 1996, 272, 227–234. 10.1126/science.272.5259.227. - DOI - PubMed

Publication types

MeSH terms

LinkOut - more resources