. 2024 Sep 12;81(1):399.
doi: 10.1007/s00018-024-05429-3.

Phenotypic profiling of human induced regulatory T cells at early differentiation: insights into distinct immunosuppressive potential

Affiliations

Phenotypic profiling of human induced regulatory T cells at early differentiation: insights into distinct immunosuppressive potential

Roosa Kattelus et al. Cell Mol Life Sci. .

Abstract

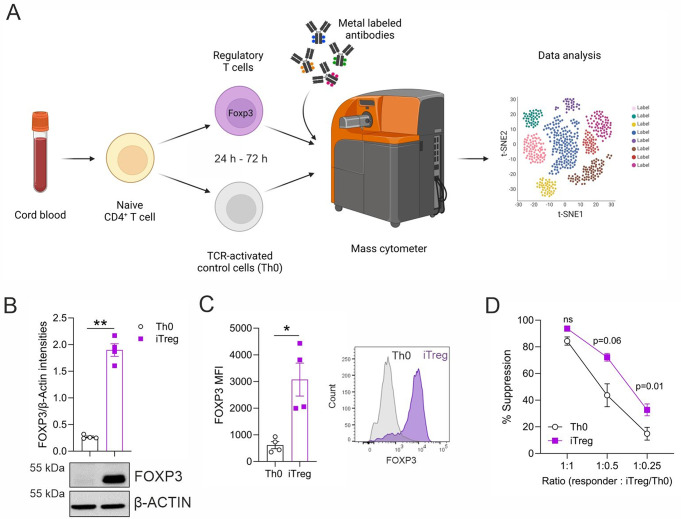
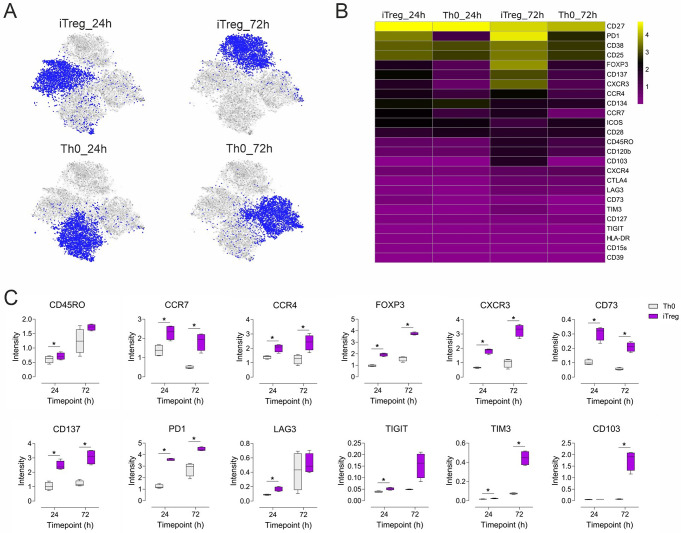
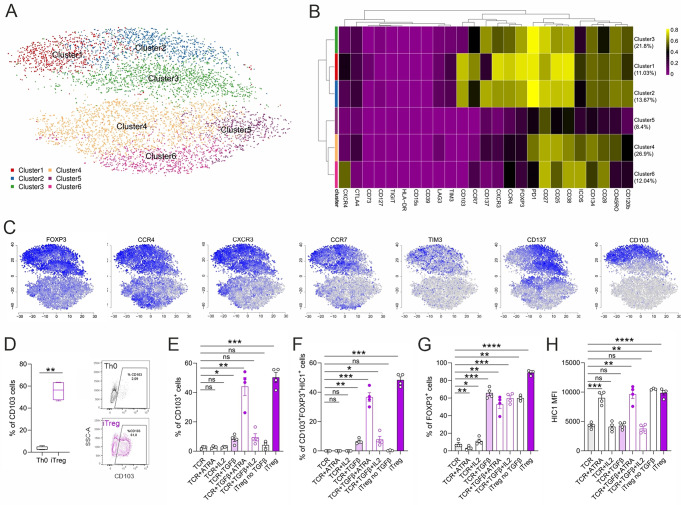
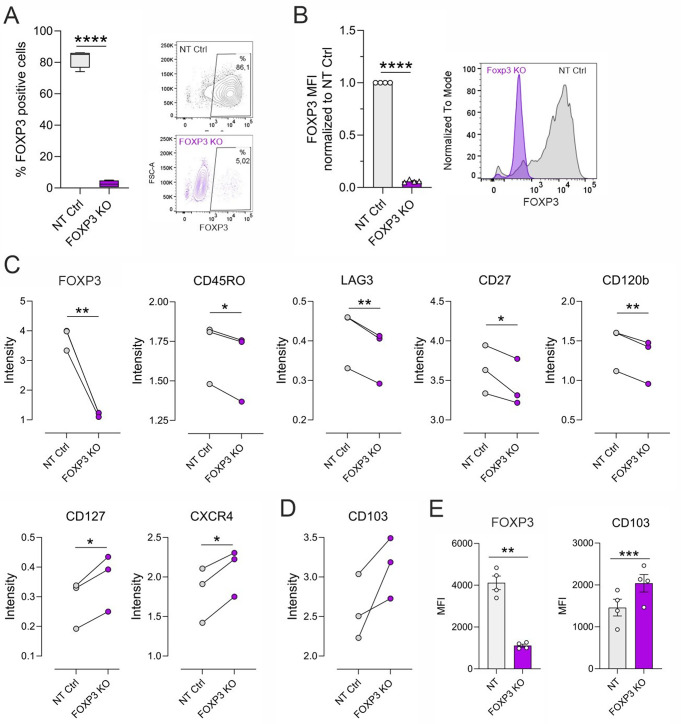
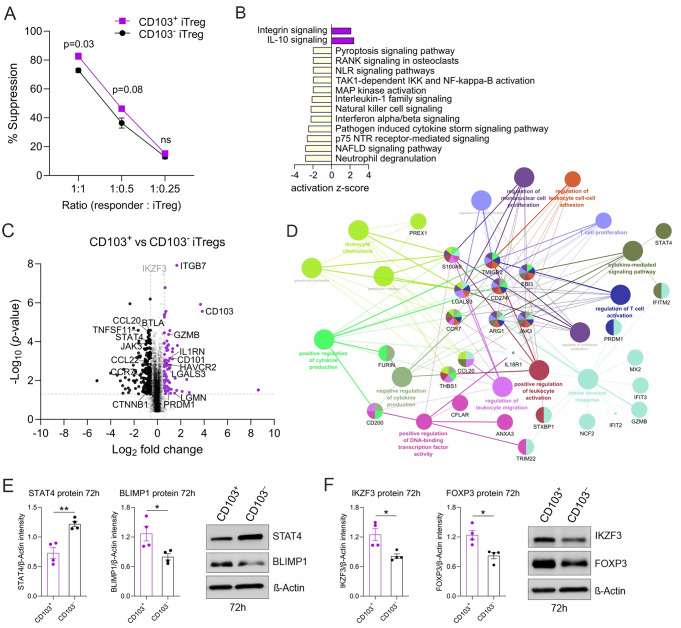
Regulatory T cells (Tregs) play a key role in suppressing systemic effector immune responses, thereby preventing autoimmune diseases but also potentially contributing to tumor progression. Thus, there is great interest in clinically manipulating Tregs, but the precise mechanisms governing in vitro-induced Treg (iTreg) differentiation are not yet fully understood. Here, we used multiparametric mass cytometry to phenotypically profile human iTregs during the early stages of in vitro differentiation at single-cell level. A panel of 25 metal-conjugated antibodies specific to markers associated with human Tregs was used to characterize these immunomodulatory cells. We found that iTregs highly express the transcription factor FOXP3, as well as characteristic Treg-associated surface markers (e.g. CD25, PD1, CD137, CCR4, CCR7, CXCR3, and CD103). Expression of co-inhibitory factors (e.g. TIM3, LAG3, and TIGIT) increased slightly at late stages of iTreg differentiation. Further, CD103 was upregulated on a subpopulation of iTregs with greater suppressive capacity than their CD103- counterparts. Using mass-spectrometry-based proteomics, we showed that sorted CD103+ iTregs express factors associated with immunosuppression. Overall, our study highlights that during early stages of differentiation, iTregs resemble memory-like Treg features with immunosuppressive activity, and provides opportunities for further investigation into the molecular mechanisms underlying Treg function.

Keywords: CD103; Differentiation; FOXP3; Mass cytometry; Mass spectrometry; Regulatory T cells.


Conflict of interest statement

A.M. is a cofounder of Site Tx, Arsenal Biosciences, Spotlight Therapeutics and Survey Genomics, serves on the boards of directors at Site Tx, Spotlight Therapeutics and Survey Genomics, is a member of the scientific advisory boards of Site Tx, Arsenal Biosciences, Spotlight Therapeutics, Survey Genomics, NewLimit, Amgen, and Tenaya, owns stock in Arsenal Biosciences, Site Tx, Spotlight Therapeutics, NewLimit, Survey Genomics, Tenaya and Lightcast and has received fees from Site Tx, Arsenal Biosciences, Spotlight Therapeutics, NewLimit, 23andMe, PACT Pharma, Juno Therapeutics, Tenaya, Lightcast, Trizell, Vertex, Merck, Amgen, Genentech, GLG, ClearView Healthcare, AlphaSights, Rupert Case Management, Bernstein and ALDA. A.M. is an investor in and informal advisor to Offline Ventures and a client of EPIQ. The Marson laboratory has received research support from the Parker Institute for Cancer Immunotherapy, the Emerson Collective, Juno Therapeutics, Epinomics, Sanofi, GlaxoSmithKline, Gilead and Anthem and reagents from Genscript and Illumina.The other authors declare no competing interests.

Figures

Fig. 1
Fig. 1
In vitro-induced Tregs express FOXP3 and are suppressive. (A) Workflow. Naïve CD4+ CD25 T cells from four individual umbilical cord blood donors were cultured under iTreg polarizing conditions for 24 and 72 h and were analyzed by mass cytometry. CD4+ T cells activated by anti-CD3 and anti-CD28 were used as controls (Th0). A 25-parameter mass cytometry panel was designed to study the expression of Treg markers during early cell differentiation. (B-C) Expression of FOXP3 protein in iTreg at 72 h of differentiation was evaluated by western blot, normalized to β-actin (B) and intracellular staining using flow cytometry (FOXP3 Ab clone PCH101), showing mean fluorescent intensities (MFI) (C). (D) The suppressive capacity of these iTregs was evaluated by co-culturing them with fluorescence-labeled CD4+CD25- responder T cells at different ratios using flow cytometry. The percentage of suppression is shown. Plots in (B-D) show mean ± SEM from four individual biological replicates. Statistical significance is calculated using paired T-tests (ns, not significant; * p < 0.05, ** p < 0.01)
Fig. 2
Fig. 2
Multi-marker profiling of human iTreg and Th0 control cells using mass cytometry. (A) t-SNE visualization of marker intensity distribution from all four individuals combined are shown for iTregs and control cells activated by anti-CD3 and anti-CD28 (Th0) at 24 and 72 h of differentiation. (B) The median intensities of the 25 markers at 24 and 72 h of iTregs and Th0 cells for four individual biological replicates are shown as a heatmap. (C) Selected differentially expressed markers are shown as box plots. Boxplot represents median and interquartile range, and whiskers extend to maximum and minimum values. Data are shown for four individual biological replicates. Statistical significance is calculated using paired T-test (* FDR < 0.05)
Fig. 3
Fig. 3
Immunophenotypic characterization of the human iTreg compartment reveals a CD103+ subpopulation. (A-C) A panel of 25 Treg-associated markers was utilized to characterize human iTreg and control cells activated by anti-CD3 and anti-CD28 (Th0) at 72 h of differentiation by mass cytometry. (A) tSNE plot of iTreg and Th0 cells, from all four individuals combined, is shown. (B) A heatmap of the normalized marker expression in each cluster is shown. (C) The expression profiles of selected markers are displayed as tSNE plots. (D) The percentage of CD103+ cells was validated at 72 h in Th0 and iTreg cells by flow cytometry for five biological replicates. Boxplots represent median and interquartile range, and whiskers extend to maximum and minimum values. Representative histograms are shown on right panel. (E-H) The percentage of single CD103+ (E), triple CD103+FOXP3+HIC1+ (F), single FOXP3+ cells (G), and the mean fluorescence intensities (MFI) of HIC1 intracellular expression (H) determined by flow cytometry, are shown from naïve CD4+ T cells cultured for 72 h under Th0 condition, iTreg differentiation condition, or Th0 in the presence of IL2, ATRA and TGFβ alone or in combinations. Plots in E-H show mean ± SEM of four biological replicates. Statistical significance in D-H is calculated using paired T-tests (∗ p < 0.05, ∗∗ p < 0.01, ∗∗∗ p < 0.001, ∗∗∗∗ p < 0.0001)
Fig. 4
Fig. 4
Effect of FOXP3 silencing on iTreg associated surface markers. (A-B) Ablation of FOXP3 using CRISPR-Cas9 was confirmed by flow cytometry at 72 h of iTreg differentiation. Percentage of FOXP3+ cells (A) and mean fluorescence intensities (MFI) of FOXP3 relative to NT Ctrl (FOXP3 Ab clone 237/E7) (B) are shown as bar plots for four individual donors (left). Representative dot plots and histograms, respectively, are shown (right). (C) Based on mass cytometry analysis, the intensity of differentially expressed markers in NT Ctrl and FOXP3 KO iTregs are displayed as line plots for three individual donors. Statistical significance is assessed using linear mixed effects modeling, as described in the Method section. (D) CD103 intensity, assessed by mass cytometry in NT Ctrl and FOXP3 KO iTregs at 72 h is shown. (E) CD103 upregulation in FOXP3 KO iTregs was further validated by flow cytometry, showing MFI of FOXP3 (Ab clone 237/E7) and CD103 in four biological replicates. Plots in (A,B and E) show mean ± SEM. Statistical significance in A,B,E is calculated using paired T-tests (∗ p < 0.05, ∗∗ p < 0.01, ∗∗∗ p < 0.001, ∗∗∗∗ p < 0.0001)
Fig. 5
Fig. 5
CD103+ iTregs co-express several immunosuppressive factors. (A) At 72 h of iTregs differentiation, CD103+ and CD103 iTregs were sorted and co-cultured with fluorescence-labeled CD4+CD25 responder T cells at different ratios to study their suppressive capacity by flow cytometry. The percentage of suppression is shown. (B) Mass spectrometry-based proteomics was performed on sorted CD103+ and CD103 iTregs for four biological replicates. IPA was used to identify signaling pathways that are significantly altered between CD103+ and CD103 iTregs. Pathways with a p value < 0.05 and |Z score| > 2 were considered to be significantly enriched. The activation Z score was calculated to predict activation or inhibition of pathways. (C) Volcano plot highlights the Treg-associated proteins that are differentially expressed between sorted CD103+ and CD103 Tregs at 72 h of polarization with corrected p value of < 0.05 and log2FC > 0.58. Upregulated proteins are in purple, and downregulated proteins are in black. (D) Key networks of differentially abundant proteins and their associated protein-protein interaction (PPI) networks were visualized using Cytoscape together with the STRING database. The pathway enrichment analysis was made against the background of detected proteins for reference. (E-F) Expression of STAT4, and BLIMP1 (E, left and middle panels), and FOXP3 and IKZF3 protein levels (F, left and middle panels) in CD103+ and CD103 iTreg at 72 h of differentiation were evaluated by western blot. Representative immunoblots are shown (E, right panel and F, right panel). Plots in (A,E, F) show mean±SEM from four individual biological replicates. Statistical significance is calculated using paired T-tests (ns, not significant; * p < 0.05, ** p < 0.01)

References

    1. Sakaguchi S, Sakaguchi N, Asano M, Itoh M, Toda M (1995) Immunologic self-tolerance maintained by activated T cells expressing IL-2 receptor alpha-chains (CD25). Breakdown of a single mechanism of self-tolerance causes various autoimmune diseases. J Immunol 155 - PubMed
    1. Dieckmann D, Plottner H, Berchtold S, Berger T, Schuler G (2001) Ex vivo isolation and characterization of Cd4 + Cd25 + T cells with Regulatory properties from Human Blood. J Exp Med 193:1303–1310. 10.1084/JEM.193.11.1303 10.1084/JEM.193.11.1303 - DOI - PMC - PubMed
    1. Vignali DAA, Collison LW, Workman CJ (2008) How regulatory T cells work. Nat Reviews Immunol 2008 8(8):7. 10.1038/nri234310.1038/nri2343 - DOI - PMC - PubMed
    1. Campbell C, Rudensky A (2020) Roles of Regulatory T Cells in Tissue Pathophysiology and metabolism. Cell Metab 31:18–25. 10.1016/j.cmet.2019.09.010 10.1016/j.cmet.2019.09.010 - DOI - PMC - PubMed
    1. Sakaguchi S, Mikami N, Wing JB, Tanaka A, Ichiyama K, Ohkura N (2020) Regulatory T cells and human disease. Annu Rev Immunol 38:541–566. 10.1146/ANNUREV-IMMUNOL-042718-041717 10.1146/ANNUREV-IMMUNOL-042718-041717 - DOI - PubMed

MeSH terms