. 2024 Sep 10;16(17):12191-12208.
doi: 10.18632/aging.205954. Epub 2024 Sep 10.

Aging-related biomarkers for the diagnosis of Parkinson's disease based on bioinformatics analysis and machine learning

Affiliations

Aging-related biomarkers for the diagnosis of Parkinson's disease based on bioinformatics analysis and machine learning

Weiwei Yang et al. Aging (Albany NY). .

Abstract

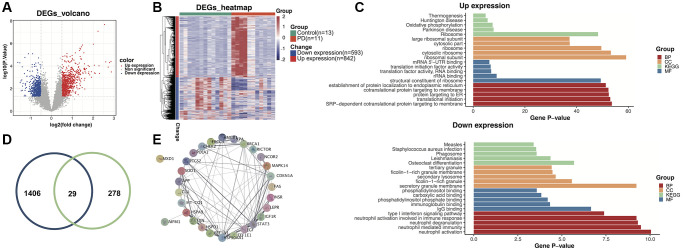
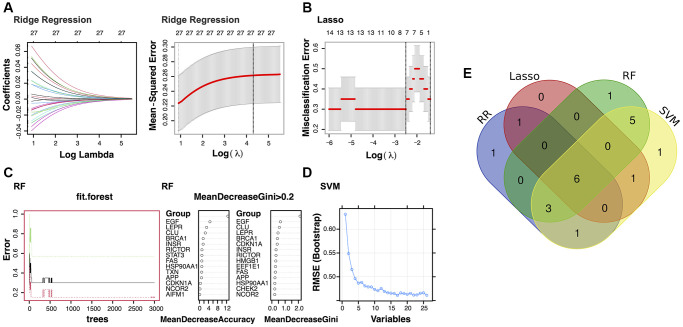
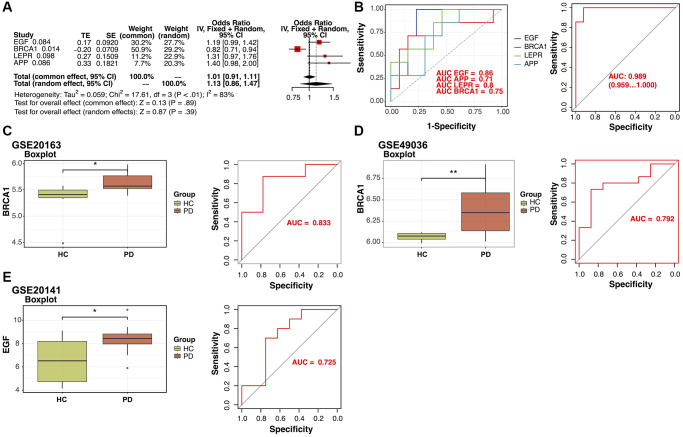
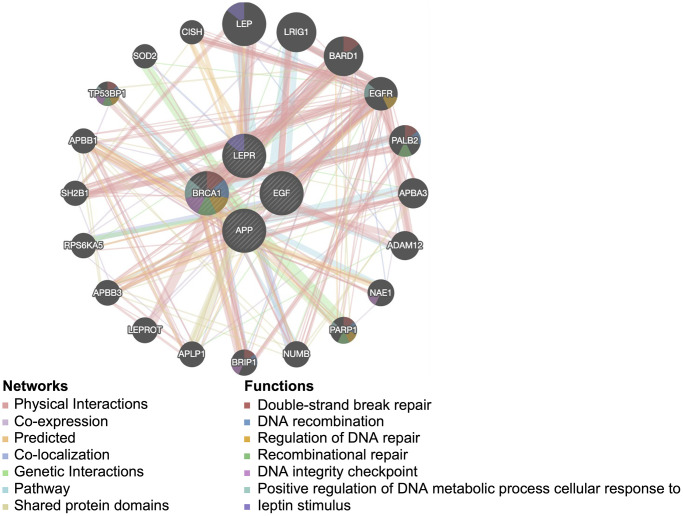
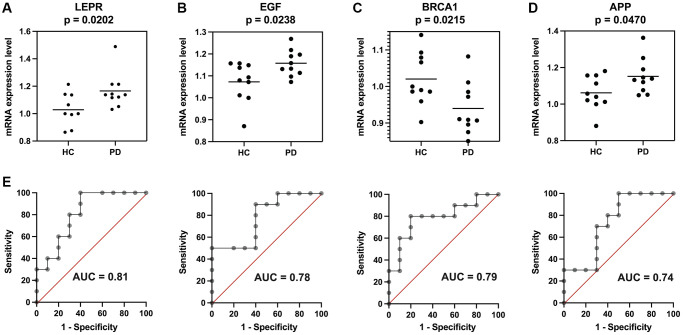
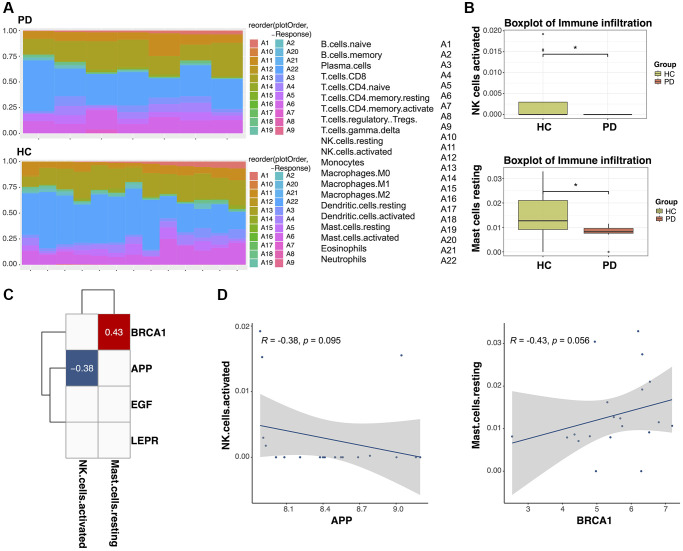
Parkinson's disease (PD) is a multifactorial disease that lacks reliable biomarkers for its diagnosis. It is now clear that aging is the greatest risk factor for developing PD. Therefore, it is necessary to identify novel biomarkers associated with aging in PD. In this study, we downloaded aging-related genes from the Human Ageing Gene Database. To screen and verify biomarkers for PD, we used whole-blood RNA-Seq data from 11 PD patients and 13 healthy control (HC) subjects as a training dataset and three datasets retrieved from the Gene Expression Omnibus (GEO) database as validation datasets. Using the limma package in R, 1435 differentially expressed genes (DEGs) were found in the training dataset. Of these genes, 29 genes were found to occur in both DEGs and 307 aging-related genes. By using machine learning algorithms (LASSO, RF, SVM, and RR), Venn diagrams, and LASSO regression, four of these genes were determined to be potential PD biomarkers; these were further validated in external validation datasets and by qRT-PCR in the peripheral blood mononuclear cells (PBMCs) of 10 PD patients and 10 HC subjects. Based on the biomarkers, a diagnostic model was developed that had reliable predictive ability for PD. Two of the identified biomarkers demonstrated a meaningful correlation with immune cell infiltration status in the PD patients and HC subjects. In conclusion, four aging-related genes were identified as robust diagnostic biomarkers and may serve as potential targets for PD therapeutics.

Keywords: Parkinson’s disease; aging; diagnostic biomarker; machine learning algorithms; nomogram.


Conflict of interest statement

CONFLICTS OF INTEREST: The authors declare no conflicts of interest related to this study.

Figures

Figure 1
Figure 1
Identification of aging-related differentially expressed genes (DEGs) in the training dataset. (A) Volcano plot of the DEGs. (B) Heatmap of the DEGs. (C) Gene ontology and Kyoto Encyclopedia of Genes and Genomes (KEGG) enrichment analysis of overexpressed and underexpressed DEGs. (D) Intersection of aging-related genes and DEGs. (E) Protein-protein interaction (PPI) network analysis reveals that 28 genes interact with each other.
Figure 2
Figure 2
Identification of the potential diagnostic biomarkers from the selected modules. (A) Ridge Regression analysis (RR). (B) Least Absolute Shrinkage and Selection Operator (LASSO) regression analysis. (C) Random Forest (RF) analysis. (D) Support Vector Machine (SVM) analysis. (E) Venn plot exhibiting the biomarkers that were identified by all four algorithms.
Figure 3
Figure 3
Verification of the identified potential diagnostic biomarkers. (A) Least Absolute Shrinkage and Selection Operator (LASSO) regression analysis identified four potential diagnostic biomarkers (p-value < 0.1). (B) Receiver operating characteristic (ROC) curves for evaluating the diagnostic ability of the four genes separately or combined in a training cohort. (C, D) Box plots for the differential expression analyses of BRCA1 in the validation datasets GSE20163 and GSE49036. ROC curves for evaluating the diagnostic ability of BRCA1 in the validation datasets. (E) Box plots for the differential expression analysis of EGF in the validation dataset GSE20141. ROC curves for evaluating the diagnostic ability of EGF in GSE20141.
Figure 4
Figure 4
Protein-protein interaction network for the four potential diagnostic biomarkers constructed in GeneMANIA. Different colors of the network edge indicate the bioinformatics method applied: physical interaction, coexpression, predicted, colocalization, pathway, genetic interaction, and shared protein domains.
Figure 5
Figure 5
Enrichment analysis of the four potential biomarker genes according to gene set enrichment analysis (GSEA) in the training dataset. (A) Pathways enriched in EGF-mediated signaling, (B) BRCA1-mediated signaling, and (C) signaling by APP in Parkinson’s disease (PD). (D) Signaling by LEPR in PD.
Figure 6
Figure 6
Prediction of drugs targeting the potential diagnostic biomarkers using SigCom LINCS. Top 20 small molecules related to expression regulation that are enriched for the four potential biomarker genes (z-score >3, p-value < 0.05) in seven cell lines.
Figure 7
Figure 7
Establishment of the diagnostic model in three validation datasets. Nomograms for the diagnostic model of Parkinson’s disease (PD), calibration curves, and decision curve analyses (DCAs) for the diagnostic model were constructed in (A) GSE20141, (B) GSE49036, and (C) GSE20163.
Figure 8
Figure 8
Validation of the four potential biomarkers in an independent cohort. Expression of (A) LEPR, (B) EGF, (C) BRCA1, and (D) APP in Parkinson’s disease (PD) patients and healthy control (HC) subjects. (E) Receiver operating characteristic (ROC) curves of the four genes for diagnosis. *p < 0.05.
Figure 9
Figure 9
The relationship between diagnostic biomarkers and immune cell infiltration. (A) Heatmap of the infiltration proportions of 22 types of immune cells in Parkinson’s disease (PD) patients and healthy control (HC) subjects. (B) Box plots for the differential proportion analysis of two immune cell types in PD and HC samples. (C) Heatmap of the correlation between diagnostic biomarkers and immune cells. (D) Correlation between APP expression and activated natural killer (NK) cells and correlation between BRCA1 expression and resting mast cells.

Similar articles

References

    1. Chen Z, Li G, Liu J. Autonomic dysfunction in Parkinson's disease: Implications for pathophysiology, diagnosis, and treatment. Neurobiol Dis. 2020; 134:104700. 10.1016/j.nbd.2019.104700 - DOI - PubMed
    1. Acharya S, Lumley AI, Zhang L, Vausort M, Devaux Y, and On Behalf Of The Ncer-Pd Consortium. GATA3 as a Blood-Based RNA Biomarker for Idiopathic Parkinson's Disease. Int J Mol Sci. 2023; 24:10040. 10.3390/ijms241210040 - DOI - PMC - PubMed
    1. Rocha EM, Keeney MT, Di Maio R, De Miranda BR, Greenamyre JT. LRRK2 and idiopathic Parkinson's disease. Trends Neurosci. 2022; 45:224–36. 10.1016/j.tins.2021.12.002 - DOI - PMC - PubMed
    1. Brudek T. Inflammatory Bowel Diseases and Parkinson's Disease. J Parkinsons Dis. 2019; 9:S331–44. 10.3233/JPD-191729 - DOI - PMC - PubMed
    1. Ba F, Martin WR. Dopamine transporter imaging as a diagnostic tool for parkinsonism and related disorders in clinical practice. Parkinsonism Relat Disord. 2015; 21:87–94. 10.1016/j.parkreldis.2014.11.007 - DOI - PubMed

LinkOut - more resources