. 2024 Sep 12;134(21):e180157.
doi: 10.1172/JCI180157.

Postprandial metabolomics analysis reveals disordered serotonin metabolism in post-bariatric hypoglycemia

Affiliations

Postprandial metabolomics analysis reveals disordered serotonin metabolism in post-bariatric hypoglycemia

Rafael Ferraz-Bannitz et al. J Clin Invest. .

Abstract

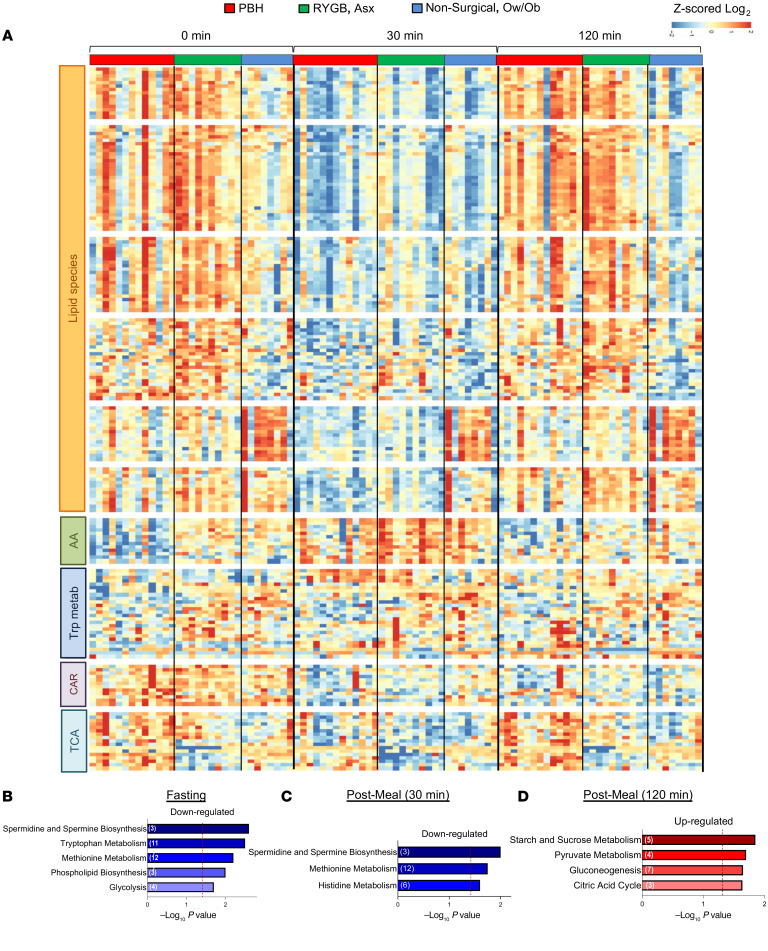
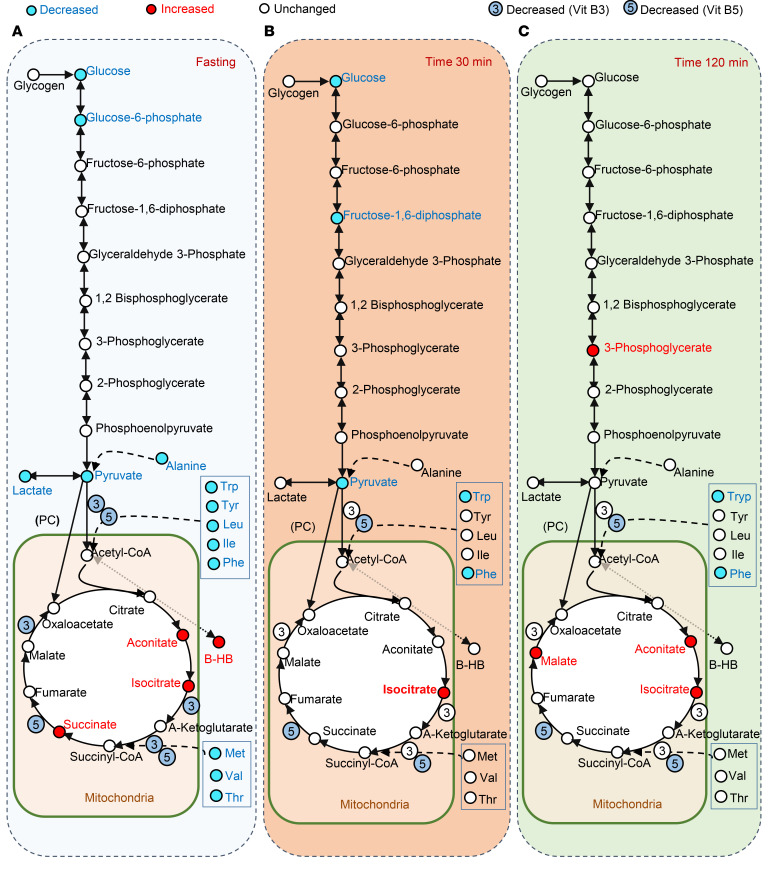
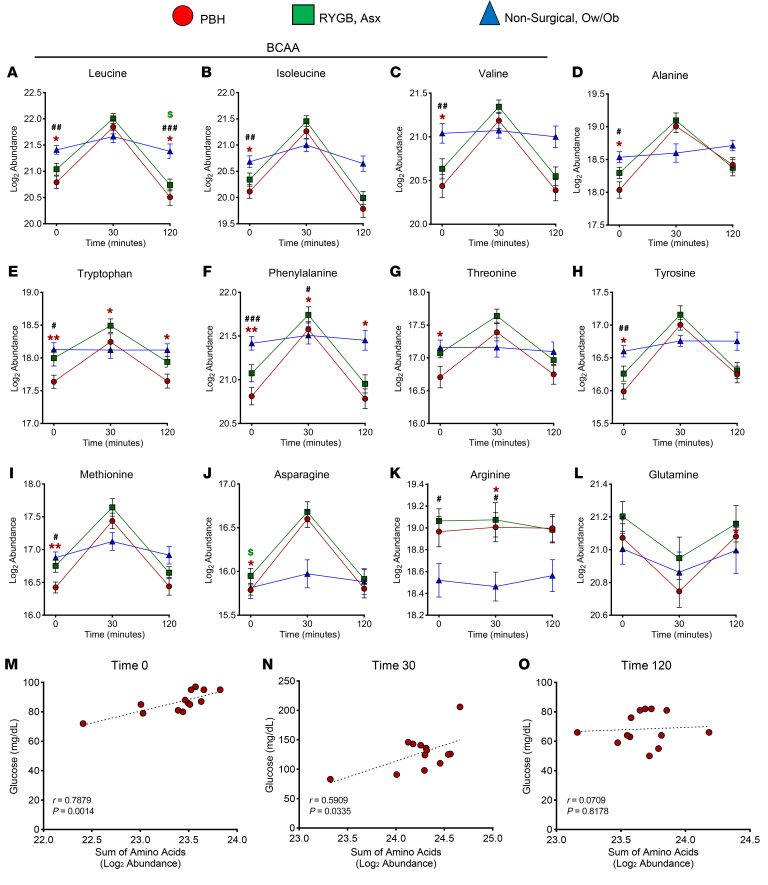
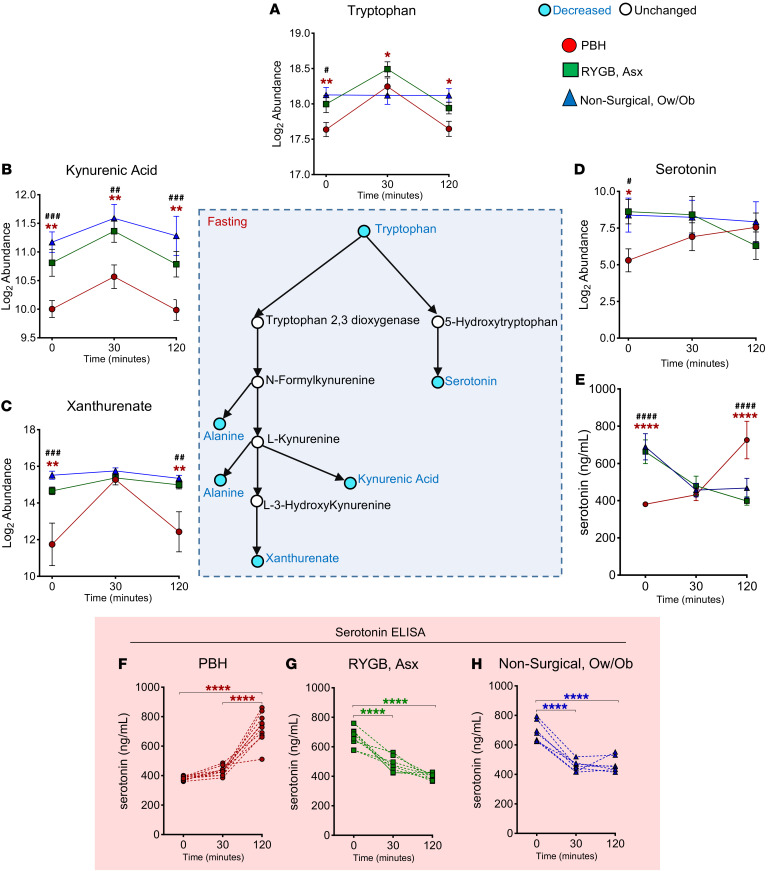
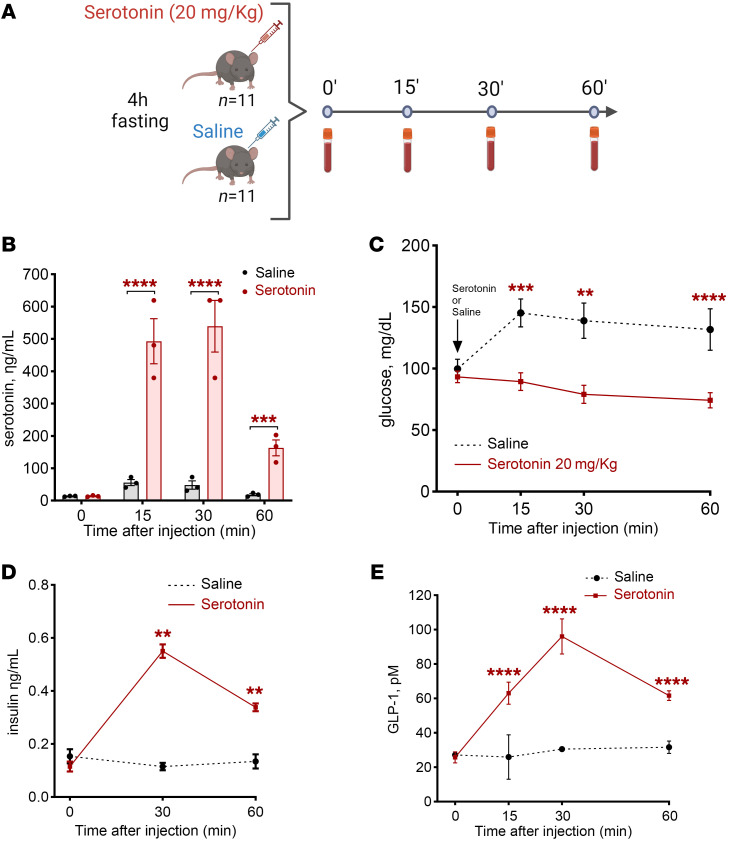
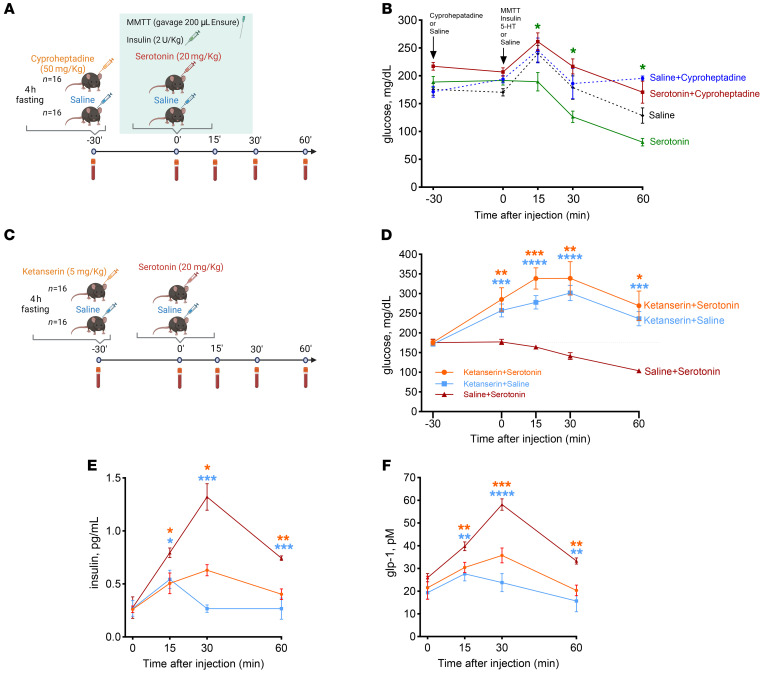
BACKGROUNDBariatric surgery is a potent therapeutic approach for obesity and type 2 diabetes but can be complicated by post-bariatric hypoglycemia (PBH). PBH typically occurs 1-3 hours after meals, in association with exaggerated postprandial levels of incretins and insulin.METHODSTo identify mediators of disordered metabolism in PBH, we analyzed the plasma metabolome in the fasting state and 30 and 120 minutes after mixed meal in 3 groups: PBH (n = 13), asymptomatic post-Roux-en-Y gastric bypass (post-RYGB) (n = 10), and nonsurgical controls (n = 8).RESULTSIn the fasting state, multiple tricarboxylic acid cycle intermediates and the ketone β-hydroxybutyrate were increased by 30%-80% in PBH versus asymptomatic. Conversely, multiple amino acids (branched-chain amino acids, tryptophan) and polyunsaturated lipids were reduced by 20%-50% in PBH versus asymptomatic. Tryptophan-related metabolites, including kynurenate, xanthurenate, and serotonin, were reduced 2- to 10-fold in PBH in the fasting state. Postprandially, plasma serotonin was uniquely increased 1.9-fold in PBH versus asymptomatic post-RYGB. In mice, serotonin administration lowered glucose and increased plasma insulin and GLP-1. Moreover, serotonin-induced hypoglycemia in mice was blocked by the nonspecific serotonin receptor antagonist cyproheptadine and the specific serotonin receptor 2 antagonist ketanserin.CONCLUSIONTogether these data suggest that increased postprandial serotonin may contribute to the pathophysiology of PBH and provide a potential therapeutic target.FUNDINGNational Institutes of Health (NIH) grant R01-DK121995, NIH grant P30-DK036836 (Diabetes Research Center grant, Joslin Diabetes Center), and Fundação de Amparo à Pesquisa do Estado de São Paulo grant 2018/22111-2.

Keywords: Endocrinology; Glucose metabolism; Metabolism.


Conflict of interest statement

Conflict of interest: MEP serves on the data safety monitoring board for Fractyl, has received investigator-initiated research support from Dexcom, and is a consultant for Eiger, Hanmi, and MBX Pharmaceuticals.

Figures

Figure 1
Figure 1. Metabolite abundance in individuals with PBH, Asx, and Ow/Ob in the fasting state and at 30 and 120 minutes after mixed meal ingestion.
(A) Heatmap of z-scored log2-transformed metabolite abundance for the top 190 most altered metabolites between groups, with unsupervised hierarchical clustering of rows. Cluster annotations include lipid species (clusters 1–6), amino acids (AA; cluster 7), tryptophan metabolites (cluster 8), carnitines (CAR; cluster 9), and tricarboxylic acid (TCA) cycle metabolites (cluster 10). (BD) Pathway enrichment analysis for PBH versus Asx individuals in the fasting state and 30 and 120 minutes after meal ingestion, respectively. Downregulated pathways are colored blue, while upregulated pathways are colored red. The –log10 P value for enrichment is represented on the x axis; the vertical line indicates nominal P less than 0.05.
Figure 2
Figure 2. Model demonstrating the metabolites of the glycolysis, gluconeogenesis, and TCA cycle pathways during mixed meal tolerance test.
Individuals with PBH and Asx are compared in the fasting state (A) and at 30 minutes (B) and 120 minutes (C) after mixed meal ingestion. Metabolites are colored blue if decreased (nominal P < 0.05), red if increased (nominal P < 0.05), and white if unchanged in PBH versus Asx.
Figure 3
Figure 3. Abundance of 12 plasma AAs in PBH, Asx, and Ow/Ob individuals in the fasting state and at 30 and 120 minutes after mixed meal ingestion.
(AL) Abundance of leucine (A), isoleucine (B), valine (C), alanine (D), tryptophan (E), phenylalanine (F), threonine (G), tyrosine (H), methionine (I), asparagine (J), arginine (K), and glutamine (L). (MO) Correlation between glucose levels and sum of AA abundance in the fasting state (red, M) and at 30 minutes (red, N) and 120 minutes (red, O) after meal. Data are mean ± SD. *,#,$P < 0.05; **,##P < 0.01; ###P < 0.001. Two-way ANOVA with Tukey’s multiple-comparison test was performed.
Figure 4
Figure 4. Abundance of tryptophan, tryptophan-derived metabolites, and serotonin in PBH, Asx, and Ow/Ob individuals in the fasting state and after mixed meal ingestion.
Center: Schematic of tryptophan metabolism and downstream metabolites. (AE) Abundance of tryptophan (A), kynurenic acid (B), xanthurenate (C), serotonin (D), and serotonin by ELISA (E). (FH) Serotonin ELISA of individual participants in PBH (red), Asx (green), and Ow/Ob (blue) groups. Data are mean ± SD. *,#P < 0.05; **,##P < 0.01; ###P < 0.001;****P < 0.0001 for PBH vs. Asx; ####P < 0.0001 for PBH vs. Ow/Ob. Two-way ANOVA with Tukey’s multiple-comparison test was performed. Blue color of circles in the schematic indicates metabolites with decreased abundance, while white indicates unchanged abundance.
Figure 5
Figure 5. Serotonin reduces glucose and increases insulin and GLP-1 secretion.
(A) Experimental protocol showing exogenous administration of serotonin (20 mg/kg) or saline in C57BL/6J mice. (B) Serotonin levels achieved by serotonin injection. (C) Glucose levels after serotonin or saline injection. (D and E) Insulin levels (D) and GLP-1 levels (E) after serotonin or saline injection. In all panels, **P < 0.01, ***P < 0.001, ****P < 0.0001 by 2-way ANOVA with Tukey’s multiple-comparison test.
Figure 6
Figure 6. Serotonin induces hypoglycemia during meal tolerance test; hypoglycemia is blocked by cyprophetadine and more specifically by ketanserin.
Reductions in glucose are blocked by the serotonin antagonist cyproheptadine and the specific serotonin receptor 2 antagonist ketanserin. (A) Scheme showing administration of cyproheptadine (50 mg/kg) or saline and, after 30 minutes, oral gavage with 200 μL of Ensure, insulin injection (2 U/kg), and administration of serotonin (20 mg/kg) or saline in C57BL/6J mice. MMTT, mixed meal tolerance test. (B) Glucose levels during experiment. (C) Scheme showing administration of ketanserin (5 mg/kg) and exogenous administration of serotonin (20 mg/kg) or saline in C57BL/6J mice. (D) Glucose levels after serotonin or saline injection. (E and F) Insulin levels (E) and GLP-1 levels (F) after serotonin or saline injection. In all panels, *P < 0.05, **P < 0.01, ***P < 0.001, ****P < 0.0001 by 2-way ANOVA with Tukey’s multiple-comparison test.

References

    1. Mingrone G, et al. Metabolic surgery versus conventional medical therapy in patients with type 2 diabetes: 10-year follow-up of an open-label, single-centre, randomised controlled trial. Lancet. 2021;397(10271):293–304. doi: 10.1016/S0140-6736(20)32649-0. - DOI - PubMed
    1. Courcoulas AP, et al. Long-term outcomes of medical management vs bariatric surgery in type 2 diabetes. JAMA. 2024;331(8):654–664. doi: 10.1001/jama.2024.0318. - DOI - PMC - PubMed
    1. Hansen CF, et al. Hypertrophy dependent doubling of L-cells in Roux-en-Y gastric bypass operated rats. PLoS One. 2013;8(6):e65696. doi: 10.1371/journal.pone.0065696. - DOI - PMC - PubMed
    1. Sandoval DA, Patti ME. Glucose metabolism after bariatric surgery: implications for T2DM remission and hypoglycaemia. Nat Rev Endocrinol. 2023;19(3):164–176. doi: 10.1038/s41574-022-00757-5. - DOI - PMC - PubMed
    1. Goldfine AB, et al. Patients with neuroglycopenia after gastric bypass surgery have exaggerated incretin and insulin secretory responses to a mixed meal. J Clin Endocrinol Metab. 2007;92(12):4678–4685. doi: 10.1210/jc.2007-0918. - DOI - PubMed