. 2024 Nov;71(11):1358-1376.
doi: 10.1109/TUFFC.2024.3459391. Epub 2024 Nov 27.

Investigating the Use of Traveltime and Reflection Tomography for Deep Learning-Based Sound-Speed Estimation in Ultrasound Computed Tomography

Investigating the Use of Traveltime and Reflection Tomography for Deep Learning-Based Sound-Speed Estimation in Ultrasound Computed Tomography

Gangwon Jeong et al. IEEE Trans Ultrason Ferroelectr Freq Control. 2024 Nov.

Abstract

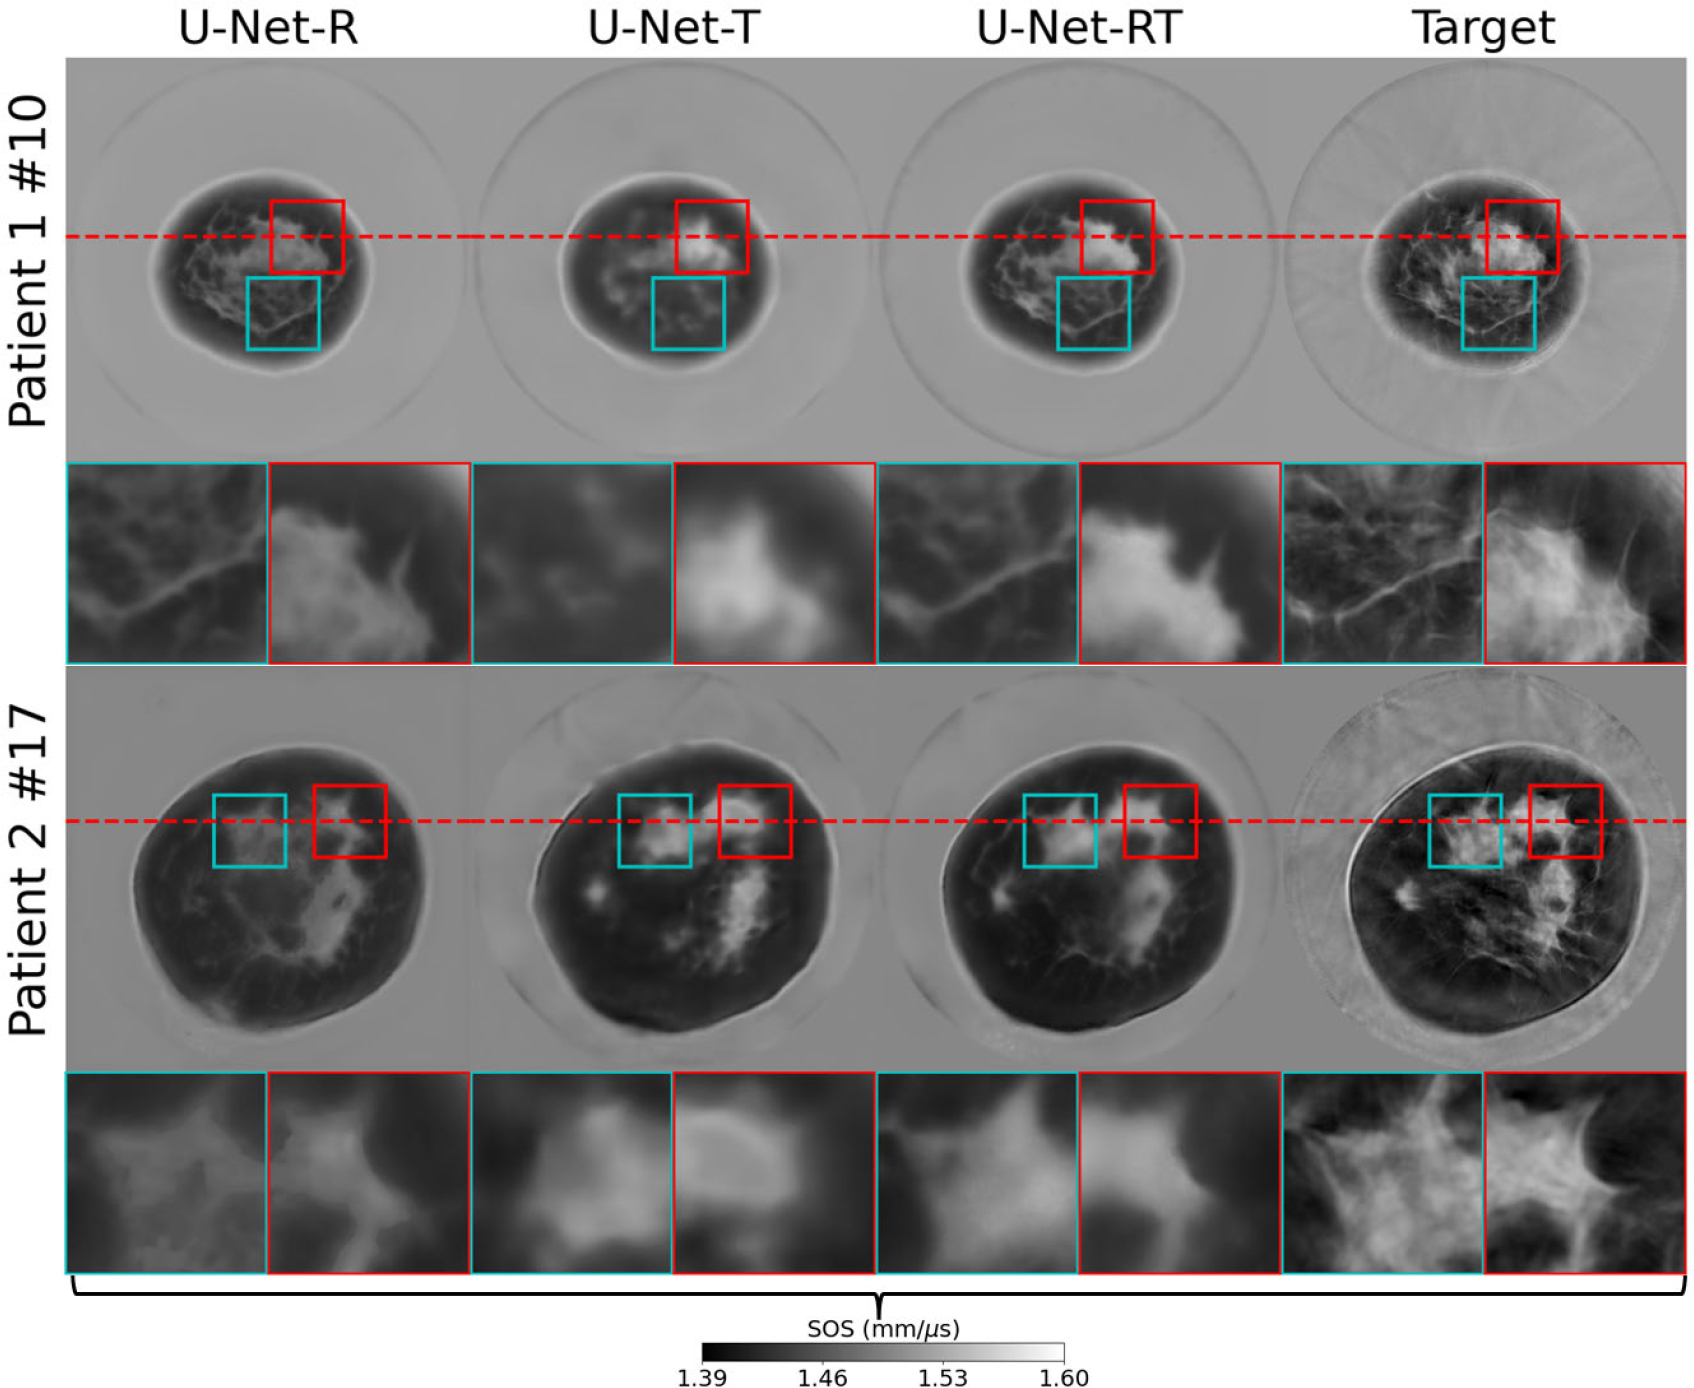
Ultrasound computed tomography (USCT) quantifies acoustic tissue properties such as the speed-of-sound (SOS). Although full-waveform inversion (FWI) is an effective method for accurate SOS reconstruction, it can be computationally challenging for large-scale problems. Deep learning-based image-to-image learned reconstruction (IILR) methods can offer computationally efficient alternatives. This study investigates the impact of the chosen input modalities on IILR methods for high-resolution SOS reconstruction in USCT. The selected modalities are traveltime tomography (TT) and reflection tomography (RT), which produce a low-resolution SOS map and a reflectivity map, respectively. These modalities have been chosen for their lower computational cost relative to FWI and their capacity to provide complementary information: TT offers a direct SOS measure, while RT reveals tissue boundary information. Systematic analyses were facilitated by employing a virtual USCT imaging system with anatomically realistic numerical breast phantoms (NBPs). Within this testbed, a supervised convolutional neural network (CNN) was trained to map dual-channel (TT and RT images) to a high-resolution SOS map. Single-input CNNs were trained separately using inputs from each modality alone (TT or RT) for comparison. The accuracy of the methods was systematically assessed using normalized root-mean-squared error (NRMSE), structural similarity index measure (SSIM), and peak signal-to-noise ratio (PSNR). For tumor detection performance, receiver operating characteristic (ROC) analysis was employed. The dual-channel IILR method was also tested on clinical human breast data. Ensemble average of the NRMSE, SSIM, and PSNR evaluated on this clinical dataset was 0.2355, 0.8845, and 28.33 dB, respectively.


Figures

Fig. 1.
Fig. 1.
Illustrative examples of tumor and non-tumor regions within breast images. From left to right: target SOS maps displaying tumor ROIs (red boxes), label maps highlighting tumor locations, binary maps of tumor ROIs, and binary maps of normal breast tissue excluding the tumor ROIs. Both tumor and normal tissue regions were employed for the calculation of traditional IQ metrics, as well as for determining distinct weight values for each region when fine-tuning the networks using the WMSE loss.
Fig. 2.
Fig. 2.
From left to right: examples of a reflectivity map reconstructed by DAS-RT (scaled using its maximum absolute value), SOS map reconstructed by BRTT, SOS map produced by U-Net-RT, target SOS map, and the corresponding error map representing the difference between the target SOS map and the SOS map produced by U-Net-RT. Images were cropped to a window of size 124 × 124 mm. From top to bottom: results corresponding to NBPs representative of the four breast density types (A)–(D). Square insets highlight specific patches (25 × 25 mm) within the images, with zoomed views shown below each image. DAS-RT and BRTT images, serving as inputs for U-Net-RT, contribute tissue boundary information and background SOS information, respectively, to the SOS map produced by U-Net-RT.
Fig. 3.
Fig. 3.
Comparisons of the SOS maps reconstructed by U-Net-R, U-Net-T, U-Net-RT, and FWI (from left to right) and the corresponding error maps, where the examples were drawn from the testing dataset. Images were cropped to a window of size 124 × 124 mm. Square insets highlight specific patches (25 × 25 mm) within the images, with zoomed views shown below each image. Compared to the U-Net-RT, the estimates from the U-Net-R exhibit bias and those from the U-Net-T contain false structures, while the SOS maps reconstructed by FWI display artifacts.
Fig. 4.
Fig. 4.
ROC curves and AUC values of the numerical observers using the SOS estimates generated by the U-Net-RT, U-Net-R, U-Net-T, and FWI as inputs. Bracketed numbers indicate the standard error for AUC estimations.
Fig. 5.
Fig. 5.
Three examples of 24 × 24 mm patches from the testing dataset. From left to right: patches obtained from the SOS maps produced by U-Net-RT, U-Net-RTw5, U-Net-RTw20, and FWI, with the final column presenting the corresponding label map indicating tumor presence/absence. For each example, from top to bottom: SP or SA patch followed by the corresponding error map. The first row shows a case where the fine-tuned U-Net-RT models can resolve tumors while the standard U-Net-RT fails. The second row shows a case where the fine-tuned U-Net-RT with high weight values (U-Net-RTw20) can produce false positives. Finally, the third highlights the limited ability of the standard and fine-tuned U-Net-RT models to resolve the tumor when compared to FWI.
Fig. 6.
Fig. 6.
ROC curves for fine-tuned U-Net-RT using WMSE loss function: U-Net-RTw2, U-Net-RTw5, U-Net-RTw10, and U-Net-RTw20, along with FWI and U-Net-RT for comparison. Bracketed numbers indicate the standard error for AUC estimations.
Fig. 7.
Fig. 7.
Application of the dual-modality IILR method to clinical USCT breast data. From left to right: reflectivity amplitude map reconstructed by DAS-RT (scaled using its maximum value), SOS maps reconstructed by BRTT, SOS map produced by U-Net-RT, target SOS map produced by FWI, and the corresponding error map representing the difference between the target SOS map and the SOS map produced by U-Net-RT. Each row represents a slice from a different patient. The rows are labeled as “Patient X#Y,” where X is the patient number and Y is the slice number. Lower Y values indicate slices closer to the nipple. Each image represents a 212 × 212 mm area. Square insets highlight specific patches (37.5 × 37.5 mm) within the images, with zoomed views shown below each image. DAS-RT and BRTT images, serving as inputs for U-Net-RT, contribute tissue boundary information and background SOS information, respectively, to the SOS map produced by U-Net-RT.
Fig. 8.
Fig. 8.
Comparison of the dual-modality and single-modality IILR methods using clinical USCT breast data. From left to right: SOS estimates produced by the U-Net-R, U-Net-T, U-Net-RT, and FWI (target SOS). Each row represents a slice from a different patient. The rows are labeled as “Patient X#Y,” where X is the patient number and Y is the slice number. Lower Y values indicate slices closer to the nipple. Each image represents a 212 × 212 mm area. Square insets highlight specific patches (37.5 × 37.5 mm) within the images, with zoomed views shown below each image. The red dashed lines in the two testing cases indicate the locations of the line profiles shown in Fig. 9. While U-Net-RT and U-Net-R exhibit similar tissue structures due to the DAS-RT input informing boundary locations and shapes, U-Net-R shows significant bias in high-SOS regions, and U-Net-T is more prone to missing fine details.
Fig. 9.
Fig. 9.
Comparison of SOS line profiles for (a) Patient 1 # 10 and (b) Patient 2 # 17, corresponding to red dashed lines in Fig. 8. The results include the target SOS produced by FWI and the SOS estimates produced by the U-Net-RT, U-Net-R, and U-Net-T. The U-Net-R exhibits bias in certain high-SOS regions, while the U-Net-T output shows distortion at tissue boundaries when compared to the U-Net-RT results.

Similar articles

Cited by

References

    1. Duric N et al., “Detection of breast cancer with ultrasound tomography: First results with the computed ultrasound risk evaluation (CURE) prototype,” Med. Phys, vol. 34, no. 2, pp. 773–785, 2007. - PubMed
    1. Sandhu GY, Li C, Roy O, Schmidt S, and Duric N, “Frequency domain ultrasound waveform tomography: Breast imaging using a ring transducer,” Phys. Med. Biol, vol. 60, no. 14, pp. 5381–5398, Jul. 2015. - PMC - PubMed
    1. Duric N et al., “Clinical breast imaging with ultrasound tomography: A description of the SoftVue system,” J. Acoust. Soc. Amer, vol. 135, no. 4, p. 2155, Apr. 2014.
    1. André M, Wiskin J, and Borup D, “Clinical results with ultrasound computed tomography of the breast,” in Quantitative Ultrasound in Soft Tissues. Cham, Switzerland: Springer, 2013, pp. 395–432.
    1. Kratkiewicz K, Pattyn A, Alijabbari N, and Mehrmohammadi M, “Ultrasound and photoacoustic imaging of breast cancer: Clinical systems, challenges, and future outlook,” J. Clin. Med, vol. 11, no. 5, p. 1165, Feb. 2022. - PMC - PubMed

Publication types