. 2024 Sep 12;9(20):e167910.
doi: 10.1172/jci.insight.167910.

A positive cytokine/chemokine feedback loop establishes plasmacytoid DC-driven autoimmune pancreatitis in IgG4-related disease

Affiliations

A positive cytokine/chemokine feedback loop establishes plasmacytoid DC-driven autoimmune pancreatitis in IgG4-related disease

Akane Hara et al. JCI Insight. .

Abstract

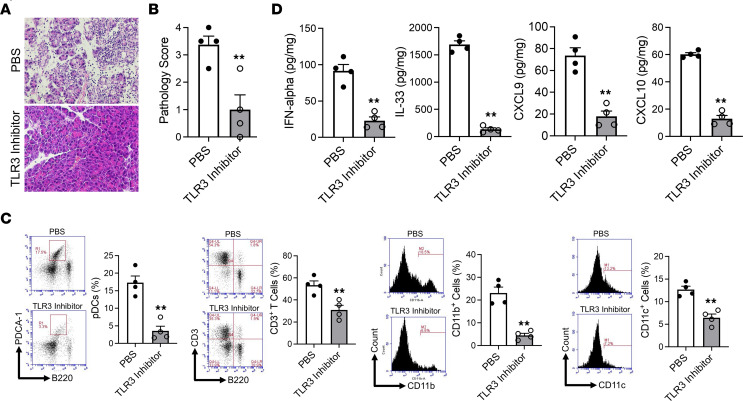
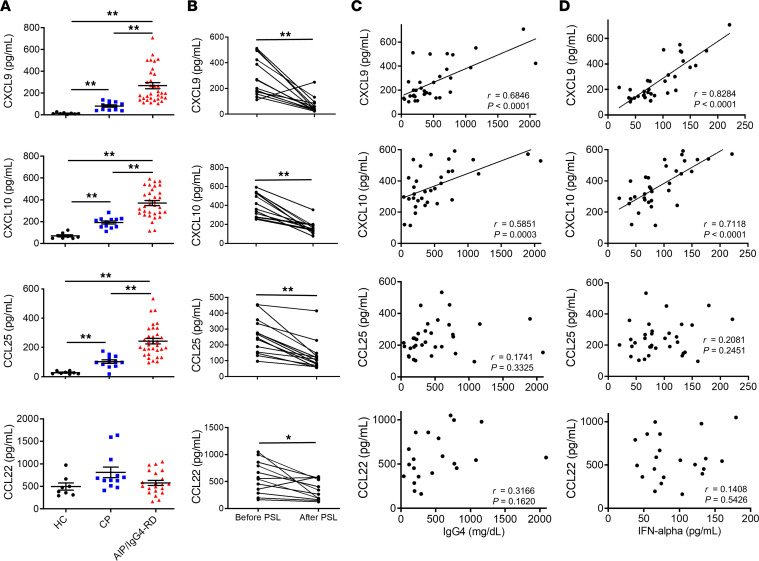
The pathogenesis of the murine model of autoimmune pancreatitis associated with IgG4-related disease (AIP/IgG4-RD) induced by administration of polyinosinic-polycytidylic acid (poly[I:C]) is incompletely understood. While it is known that murine and human AIP/IgG4-RD is driven by plasmacytoid dendritic cells (pDCs) producing IFN-α, the origin of these cells and their relation to effector T cells is not known. Here, we show that murine AIP was initiated by TLR3-bearing conventional DCs in the uninflamed pancreas whose activation by the TLR3 ligand poly(I:C) caused IFN-α, CXCL9, and CXCL10 secretion. This, in turn, induced pancreatic recruitment of CXCR3+ T cells and these T cells, via their secretion of CCL25, facilitated migration of pDCs bearing CCR9 into the pancreas. This established a feedback loop anchored by the now dominant pDC production of IFN-α and the continued CXCR3+ T cell facilitation of pDC migration. Remarkably, the interaction between CXCR3+ T cells and pDCs also existed at the functional level since this interaction enhanced the production of CCL25 and IFN-α by CXCR3+ T cells and pDCs, respectively. Evidence presented here that a similar disease mechanism was present in human AIP/IgG4-RD creates new avenues of disease treatment.

Keywords: Autoimmunity; Chemokines; Cytokines; Gastroenterology.


Figures

Figure 1
Figure 1. Blockade of TLR3 by inhibitors prevents the development of experimental autoimmune pancreatitis.
MRL/MpJ mice were administered poly(I:C) by intraperitoneal injection twice a week for a total of 16 times to induce experimental autoimmune pancreatitis (AIP). Each poly(I:C) injection was preceded by intraperitoneal injection of saline (PBS, n = 4) or TLR3/dsRNA binding inhibitor (1 mg, n = 4). After sacrifice at 3 hours following the final set of injections, pancreases were removed and analyzed as indicated. (A and B) Hematoxylin and eosin staining of the pancreatic tissues and pathological scores of induced AIP in the 2 groups. Original magnification, ×400. (C) Percentages of plasmacytoid DCs (pDCs), CD3+ T cells, CD11b+ myeloid cells, and CD11c+ DCs within pancreatic mononuclear cells, as determined by flow cytometric analyses. pDCs were defined as PDCA-1+B220lo cells. Left panels: Representative cytometric analysis. Right panels: Bar graphs of cumulative results. (D) Concentrations of IFN-α, IL-33, CXCL9, and CXCL10 in protein extracts of pancreatic tissues from mice without and with TLR3 inhibitor administration, as determined by ELISA. Each dot corresponds to the value in 1 mouse. Statistical analyses were performed using an unpaired, 2-tailed Student’s t test. Results are expressed as mean ± SEM. **P < 0.01.
Figure 2
Figure 2. Conventional DCs are the major cellular source of type I IFNs in the inductive phase of experimental autoimmune pancreatitis.
MRL/MpJ mice (n = 6) were treated with poly(I:C) by intraperitoneal injection for a total of 2 times. After sacrifice at 3 hours following the final injection, pancreases were removed and processed to extract pancreatic mononuclear cells (PMNCs). PMNCs were extracted from untreated MRL/MpJ mice (n = 6) to obtain baseline data (No Tx). (A) Conventional DCs (cDCs, 1 × 10⁶/mL) and pDCs (1 × 10⁶/mL) were purified from the extracted PMNCs and cultured with poly(I:C) (25 μg/mL) or CpG (1 μM) for 48 hours in triplicate. Culture supernatants from each well were then analyzed by ELISA to determine the concentrations of IFN-α, IFN-β, CXCL9, and CXCL10. (B) PMNCs (1 × 10⁶/mL) and CD11c+ DC–depleted PMNCs (1 × 10⁶/mL) were stimulated with poly(I:C) (25 μg/mL) for 48 hours in triplicate. Culture supernatant from each well was then analyzed by ELISA. Each dot represents the value derived from 1 well. Statistical analyses were performed using an unpaired, 2-tailed Student’s t test. Results shown are representative of data derived from 2 independent experiments and are expressed as mean ± SEM. **P < 0.01.
Figure 3
Figure 3. Expression of Th1-associated cytokines and chemokines is enhanced in MRL/MpJ mice treated with repeated injections of poly(I:C).
MRL/MpJ mice (n = 14) were treated with poly(I:C) by intraperitoneal injection twice a week for a total of 16 times. After sacrifice at 3 hours following the final injection, pancreases were removed and processed to extract pancreatic mononuclear cells (PMNCs) and proteins. PMNCs and proteins were extracted from untreated MRL/MpJ mice (n = 10, No Tx) to obtain baseline data. (A) Representative flow cytometric analyses (with gates set on lymphocyte fraction, upper panel) and bar graphs of cumulative results (lower panel) showing the percentages of CD4+CXCR3+ T cells and CD8+CXCR3+ T cells among PMNCs obtained from individual mice. (B and C) Concentrations of IFN-γ, TNF-α, IL-4, IL-17, CXCL9, CXCL10, CCL17, and CCL22 in protein extracts of pancreatic tissues from mice. Each dot represents the value derived from 1 mouse. Statistical analyses were performed using an unpaired, 2-tailed Student’s t test. Results shown represent the combined data of 3 (A) or 2 (B) independent experiments. Results are expressed as mean ± SEM. *P < 0.05, **P < 0.01.
Figure 4
Figure 4. The development of experimental autoimmune pancreatitis is dependent on the CXCR3-mediated signaling pathways.
MRL/MpJ mice were administered poly(I:C) twice a week for a total of 16 times by intraperitoneal injection. Each poly(I:C) injection was preceded by intraperitoneal injection of anti-CXCR3 Ab (200 μg, n = 7) or control Ab (200 μg, n = 9). After sacrifice at 3 hours following the final set of injections, pancreases were removed and analyzed as indicated. (A and B) Representative hematoxylin and eosin staining of the pancreatic tissues and pathological scores for autoimmune pancreatitis of individual mice in the 2 groups. Original magnification, ×400. (C) Flow cytometric analyses showing the percentages of pDCs, CD3+ T cells, CD11b+ myeloid cells, and CD11c+ DCs among pancreatic mononuclear cells. pDCs were defined as PDCA-1+B220lo cells. Left panels: Representative flow cytometric analyses. Right panels: Bar graphs of cumulative data from individual mice. (D) Concentrations of IFN-α, IL-33, and IFN-γ in protein extracts of pancreatic tissues obtained from mice as determined by ELISA. Statistical analyses were performed using an unpaired, 2-tailed Student’s t test. The results shown are the combined data derived from 2 independent experiments. Each dot represents the value derived from 1 mouse. Results are expressed as mean ± SEM. **P < 0.01.
Figure 5
Figure 5. Expression of CCR9 on pDCs in MRL/MpJ mice treated with repeated injections of poly(I:C).
MRL/MpJ mice were treated with or without poly(I:C), as indicated in Figure 3. After sacrifice at 3 hours following the final set of injections, pancreases were removed and analyzed as indicated. (A) Flow cytometric analysis of cell membrane expression of CCR2, CCR7, and CCR9 on pDCs in pancreatic mononuclear cells extracted from MRL/MpJ mice treated with 16 doses of poly(I:C). Analysis gate was set on PDCA-1+B220lo pDCs. Black curve: control Ab. Red curve: CCR2, CCR7, and CCR9 Abs. Results shown are representative data from 3 mice. (B) Concentrations of CCL2, CCL21, and CCL25 in protein extracts of pancreatic tissues obtained from untreated mice (No Tx, n = 10) or mice treated with 16 injections of poly(I:C) (n = 10), as determined by ELISA. Each dot represents the value derived from 1 mouse. Statistical analyses were performed using an unpaired, 2-tailed Student’s t test. Results shown are combined data of 2 independent experiments (B). Results are expressed as mean ± SEM. **P < 0.01.
Figure 6
Figure 6. Pancreatic accumulation of pDCs does not require the molecular interaction between CCR2 and CCL2.
MRL/MpJ mice were administered poly(I:C) twice a week for a total of 16 times. Each poly(I:C) injection was preceded by intraperitoneal injection of anti-CCL2 Ab (200 μg, n = 5) or control Ab (200 μg, n = 5). After sacrifice at 3 hours following the final set of injections, pancreases were removed and analyzed as indicated. (A and B) Representative hematoxylin and eosin staining of the pancreatic tissues and pathological scores of induced autoimmune pancreatitis in the 2 groups. Original magnification, ×400. (C) Concentrations of IFN-α, IL-33, TNF-α, and IL-6 in protein extracts of pancreatic tissues obtained from mice in the 2 groups. (D) Flow cytometric analyses showing the percentages of pDCs, CD3+ T cells, CD11b+ myeloid cells, and CD11c+ DCs among pancreatic mononuclear cells. Left panels: Representative flow cytometric analyses. Right panels: Bar graphs of cumulative data from individual mice. pDCs were defined as PDCA-1+B220lo cells. Each dot represents the value derived from 1 mouse. Statistical analyses were performed using an unpaired, 2-tailed Student’s t test. Results are expressed as mean ± SEM. **P < 0.01.
Figure 7
Figure 7. Pancreatic accumulation of pDCs requires the molecular interaction between CCR9 and CCL25.
MRL/MpJ mice were administered poly(I:C) twice a week for a total of 16 times by intraperitoneal injection. Each poly(I:C) injection was preceded by intraperitoneal injection of anti-CCL25 Ab (100 μg, n = 5) or control Ab (100 μg, n = 3). After sacrifice at 3 hours following the final set of injections, pancreases were removed and analyzed as indicated. (A and B) Representative hematoxylin and eosin staining of the pancreatic tissues and pathological scores of induced autoimmune pancreatitis in the 2 groups. Original magnification, ×400. (C) Concentrations of IFN-α, IL-33, TNF-α, and IL-6 in protein extracts of pancreatic tissues obtained from mice in the 2 groups. (D) Flow cytometric analyses showing the percentages of pDCs, CD3+ T cells, CD11b+ myeloid cells, and CD11c+ DCs among pancreatic mononuclear cells. Left panels: Representative flow cytometric analyses. Right panels: Bar graphs of cumulative data from individual mice. pDCs were defined as PDCA-1+B220lo cells. Each dot represents the value derived from 1 mouse. Statistical analyses were performed using an unpaired, 2-tailed Student’s t test. Results are expressed as mean ± SEM. *P < 0.05, **P < 0.01.
Figure 8
Figure 8. Pancreatic lymphoid cells stimulated by IFN-α are the source of CCL25.
MRL/MpJ mice were administered poly(I:C) twice a week for a total of 16 times by intraperitoneal injection. Each poly(I:C) injection was preceded by intraperitoneal injection of (A) pDC-depleting Ab (120G8 Ab, 100 μg, n = 5) or control Ab (100 μg, n = 5); (B) anti–IFN-α/β receptor Ab (anti-IFNAR Ab, 100 μg, n = 5) or control Ab (100 μg, n = 4); (C) anti–IL-33 receptor Ab (anti-ST2 Ab, 100 μg, n = 5) or control Ab (100 μg, n = 5); and (D) anti-CXCR3 Ab (200 μg, n = 7) or control Ab (200 μg, n = 9). After sacrifice at 3 hours following the final set of injections, pancreases were removed and processed for immunohistochemical studies with anti-CCL25 Ab. Upper panels: Representative tissue images of CCL25 expression by morphologically identified lymphoid cells (indicated by arrowheads) in tissues obtained from mice administered control Ab or depleting/neutralizing Ab. Original magnification, ×800. Lower panels: Bar graphs showing numbers of CCL25+ lymphoid cells/high-powered field (HPF) (counted blindly). Each dot represents the value derived from 1 mouse. Statistical analyses were performed using an unpaired, 2-tailed Student’s t test. Results are expressed as mean ± SEM. **P < 0.01.
Figure 9
Figure 9. CD3+CXCR3+ T cells produce CCL25 in response to IFN-α secreted by pDCs.
(A) FACS gating strategy for acquisition of CD3+CXCR3+ T cells, CD3+CXCR3 T cells, and PDCA-1+B220lo pDCs. (B and C) Pancreatic mononuclear cells (PMNCs) were isolated from pancreases of MRL/MpJ mice (n = 3) administered poly(I:C) twice a week for a total of 16 times. PMNCs were subjected to FACS to acquire purified CD3+CXCR3+ T cells, CD3+CXCR3 T cells, and pDCs, after which they were cultured or cocultured for 48 hours (at 1 × 10⁵/mL) in triplicate in the presence of anti-CD3 Ab (5 μg/mL) alone or with CpG (1 μM); in addition, in some experiments, anti–IFN-α/β receptor Ab (anti-IFNAR Ab, 100 μg/mL) or control Ab was added to the culture. Cell culture supernatants from each well were analyzed by ELISA for measurement of CCL25 and IFN-α. Each dot represents the CCL25 or IFN-α concentration value derived from each well. Statistical analyses were performed using the Kruskal-Wallis test and Bonferroni-corrected Mann-Whitney U test (B) or an unpaired, 2-tailed Student’s t test (C). Results shown are the representative 1 of 2 independent experiments and are expressed as mean ± SEM. **P < 0.01.
Figure 10
Figure 10. CD3+CXCR3+ T cells enhance differentiation of pDCs producing IFN-α and IL-33.
(A) Purified CD3+CXCR3+ T cells, CD3+CXCR3 T cells, and pDCs were acquired from the pancreatic tissues of MRL/MpJ mice administered poly(I:C) (n = 3) or untreated MRL/MpJ mice (n = 3) and cocultured as described in Figure 9 in triplicate under the indicated conditions. Cell culture supernatants from each well were analyzed by ELISA for measurement of CCL25, IFN-α, and IL-33. Each dot represents the value derived from 1 well. Statistical analyses were performed using the Kruskal-Wallis test and Bonferroni-corrected Mann-Whitney U test. Results are expressed as mean ± SEM. *P < 0.05, **P < 0.01. NS, not significant. (B) Diagram illustrating the positive feedback loop consisting of IFN-α/β, CXCL9, CXCL10, and CCL25 that establishes and sustains experimental pDC-driven autoimmune pancreatitis (see text for full description).
Figure 11
Figure 11. Serum concentrations of CXCL9, CXCL10, CCL25, and CCL22 in patients with autoimmune pancreatitis/IgG4-related disease.
Serum samples were collected from healthy controls (HC, n = 8), chronic alcoholic pancreatitis (CP) patients (n = 12), and autoimmune pancreatitis (AIP)/IgG4-related disease (IgG4-RD) patients (n = 33). (A) Serum concentrations of CXCL9, CXCL10, CCL25, and CCL22; each dot corresponds to a value in 1 patient. Statistical analyses: Kruskal-Wallis test and Bonferroni-corrected Mann-Whitney U test. Results are expressed as mean ± SEM. (B) Serum chemokine levels from patients with AIP/IgG4-RD (n = 14) before and after induction of remission with prednisolone (PSL) therapy. Statistical analyses: Wilcoxon’s signed-rank test. (C and D) Correlation between serum IgG4 or IFN-α levels and chemokines in patients with AIP/IgG4-RD. Each dot represents 1 patient. P values and correlation coefficient (r) values, as determined by Spearman’s rank correlation test, are shown. *P < 0.05; **P < 0.01.

Similar articles

Cited by

References

    1. Stone JH, et al. IgG4-related disease. N Engl J Med. 2012;366(6):539–551. doi: 10.1056/NEJMra1104650. - DOI - PubMed
    1. Kamisawa T, et al. IgG4-related disease. Lancet. 2015;385(9976):1460–1471. doi: 10.1016/S0140-6736(14)60720-0. - DOI - PubMed
    1. Watanabe T, et al. Mechanistic insights into autoimmune pancreatitis and IgG4-related disease. Trends Immunol. 2018;39(11):874–889. doi: 10.1016/j.it.2018.09.005. - DOI - PubMed
    1. Arai Y, et al. Plasmacytoid dendritic cell activation and IFN-α production are prominent features of murine autoimmune pancreatitis and human IgG4-related autoimmune pancreatitis. J Immunol. 2015;195(7):3033–3044. doi: 10.4049/jimmunol.1500971. - DOI - PubMed
    1. Watanabe T, et al. Chronic fibro-inflammatory responses in autoimmune pancreatitis depend on IFN-α and IL-33 produced by plasmacytoid dendritic cells. J Immunol. 2017;198(10):3886–3896. doi: 10.4049/jimmunol.1700060. - DOI - PubMed

MeSH terms