Comparative Study
. 2024 Sep 24;43(9):114705.
doi: 10.1016/j.celrep.2024.114705. Epub 2024 Sep 10.

Unraveling the phenotypic states of human innate-like T cells: Comparative insights with conventional T cells and mouse models

Affiliations
Comparative Study

Unraveling the phenotypic states of human innate-like T cells: Comparative insights with conventional T cells and mouse models

Liyen Loh et al. Cell Rep. .

Abstract

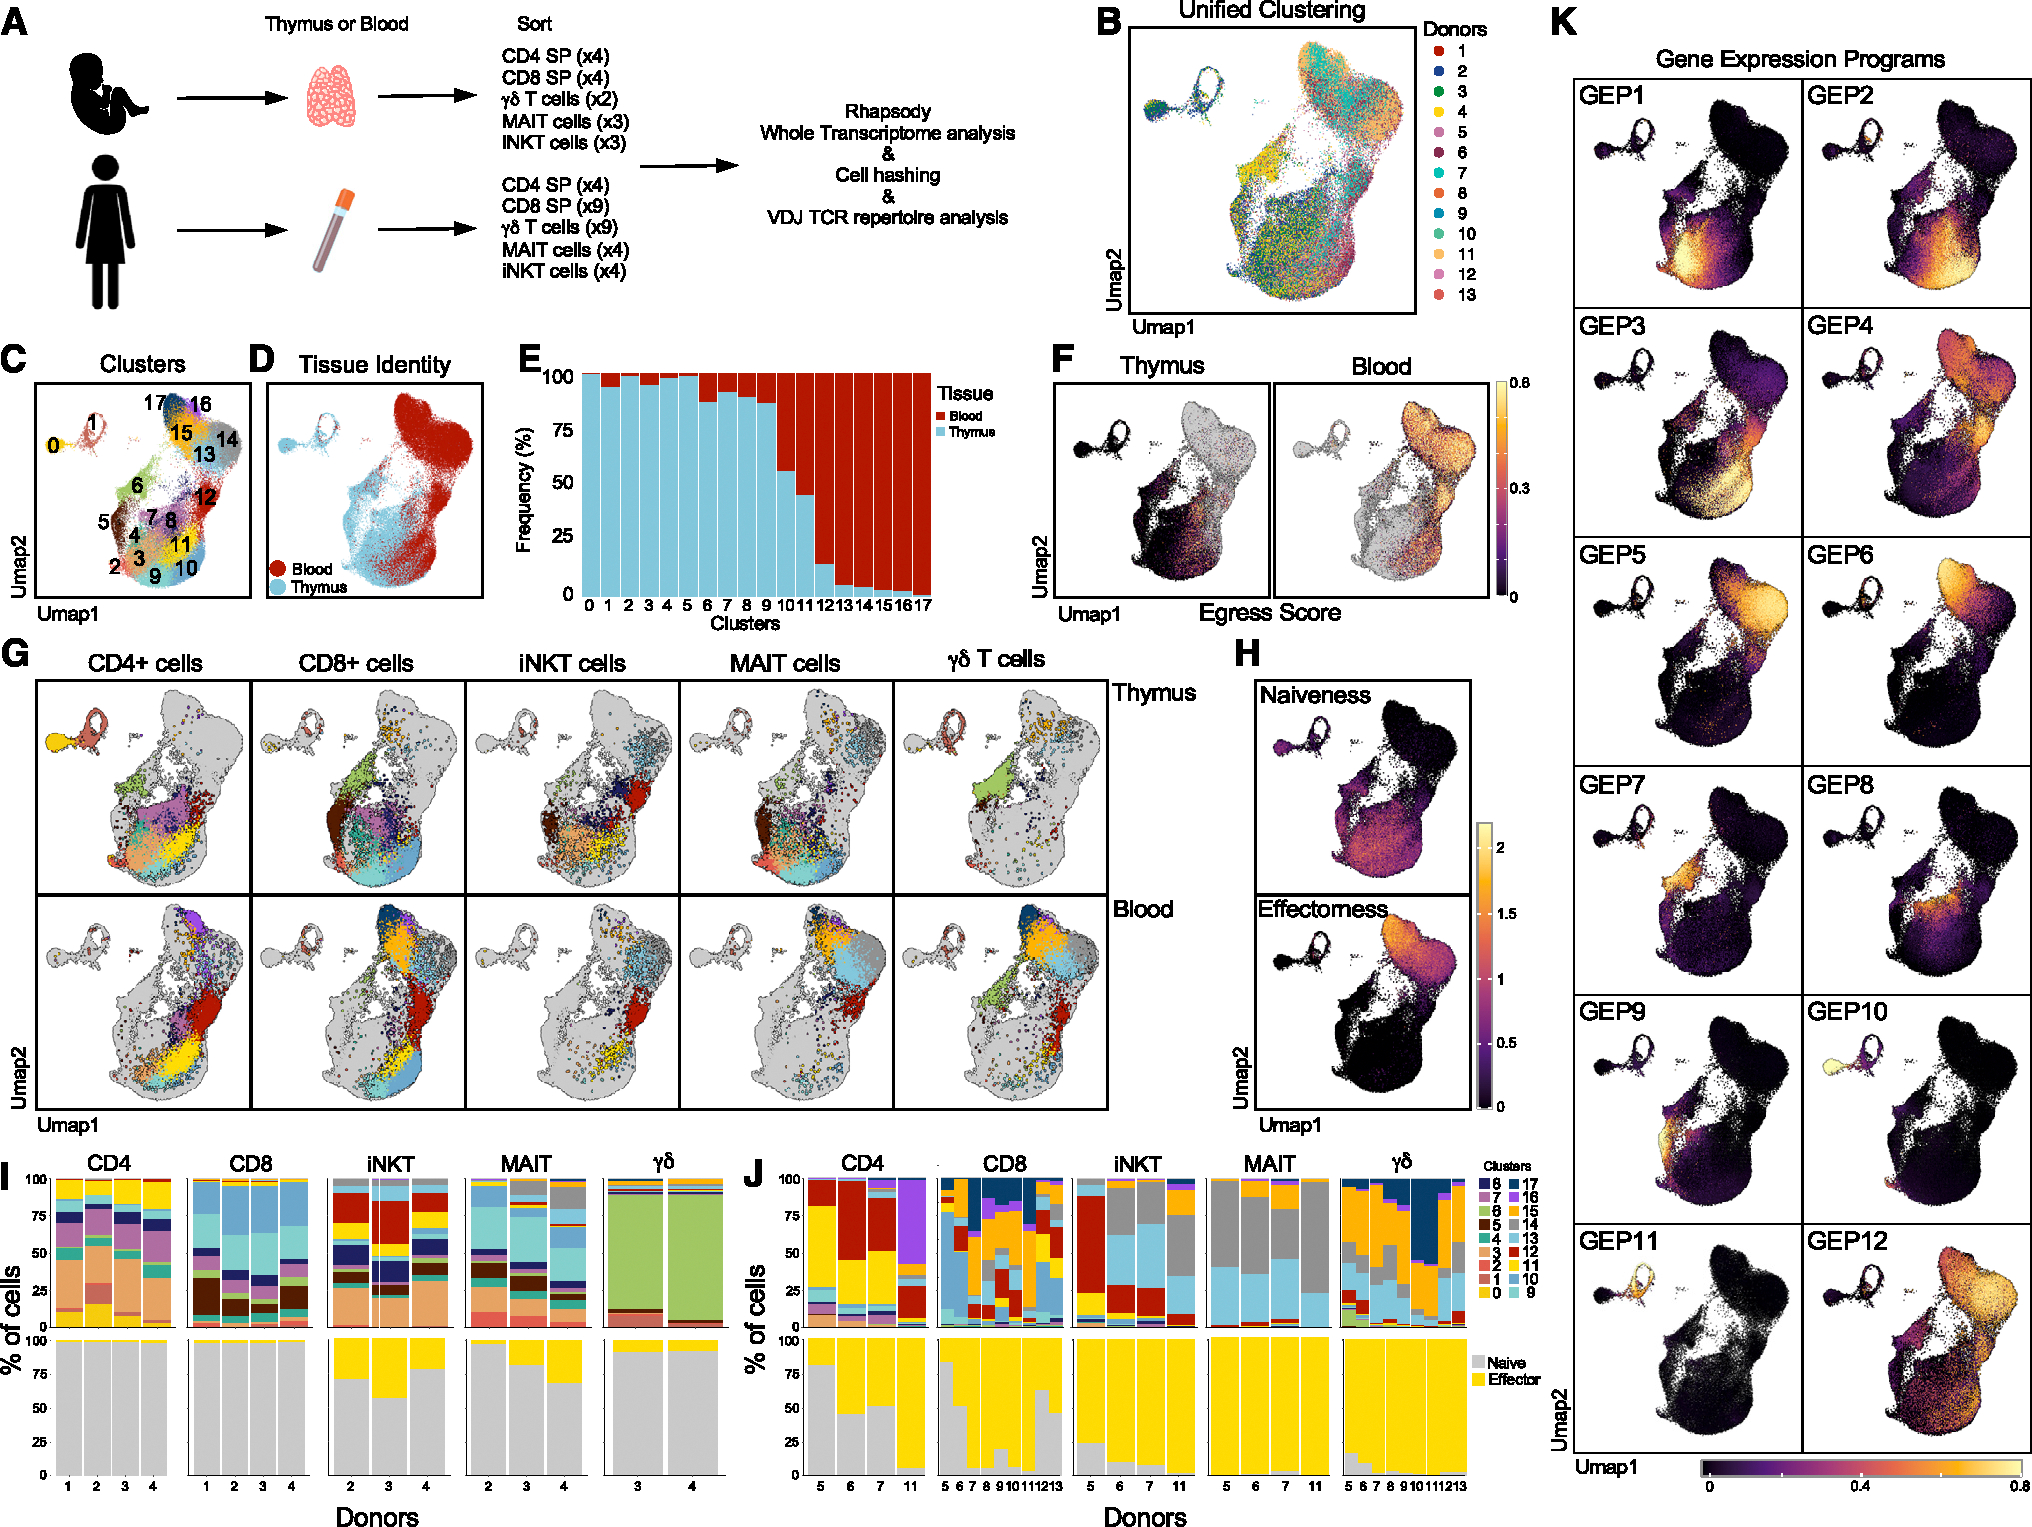
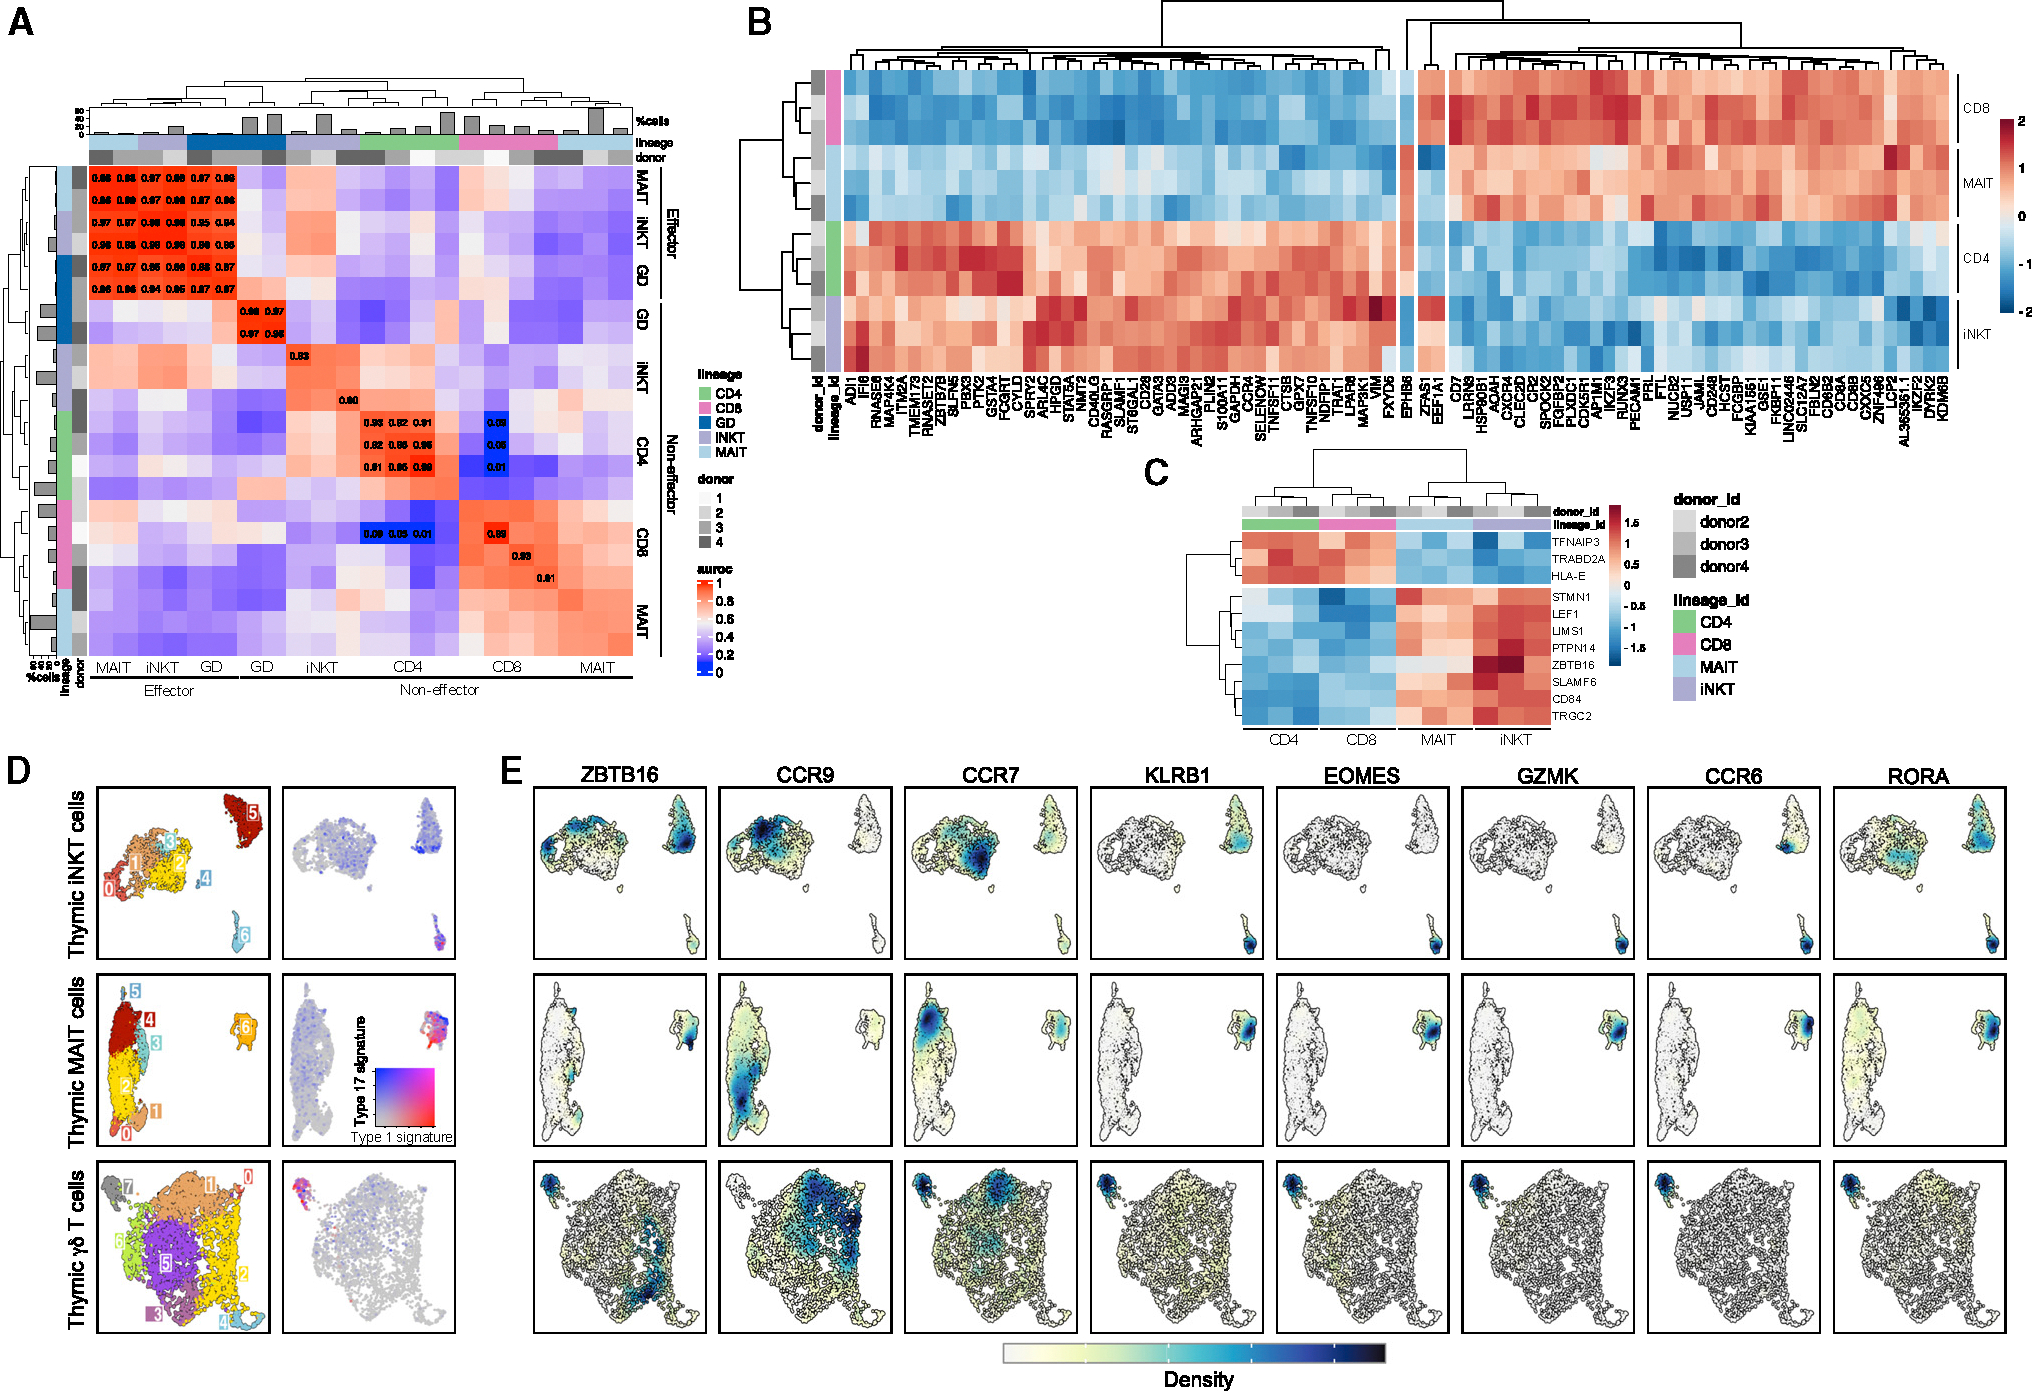
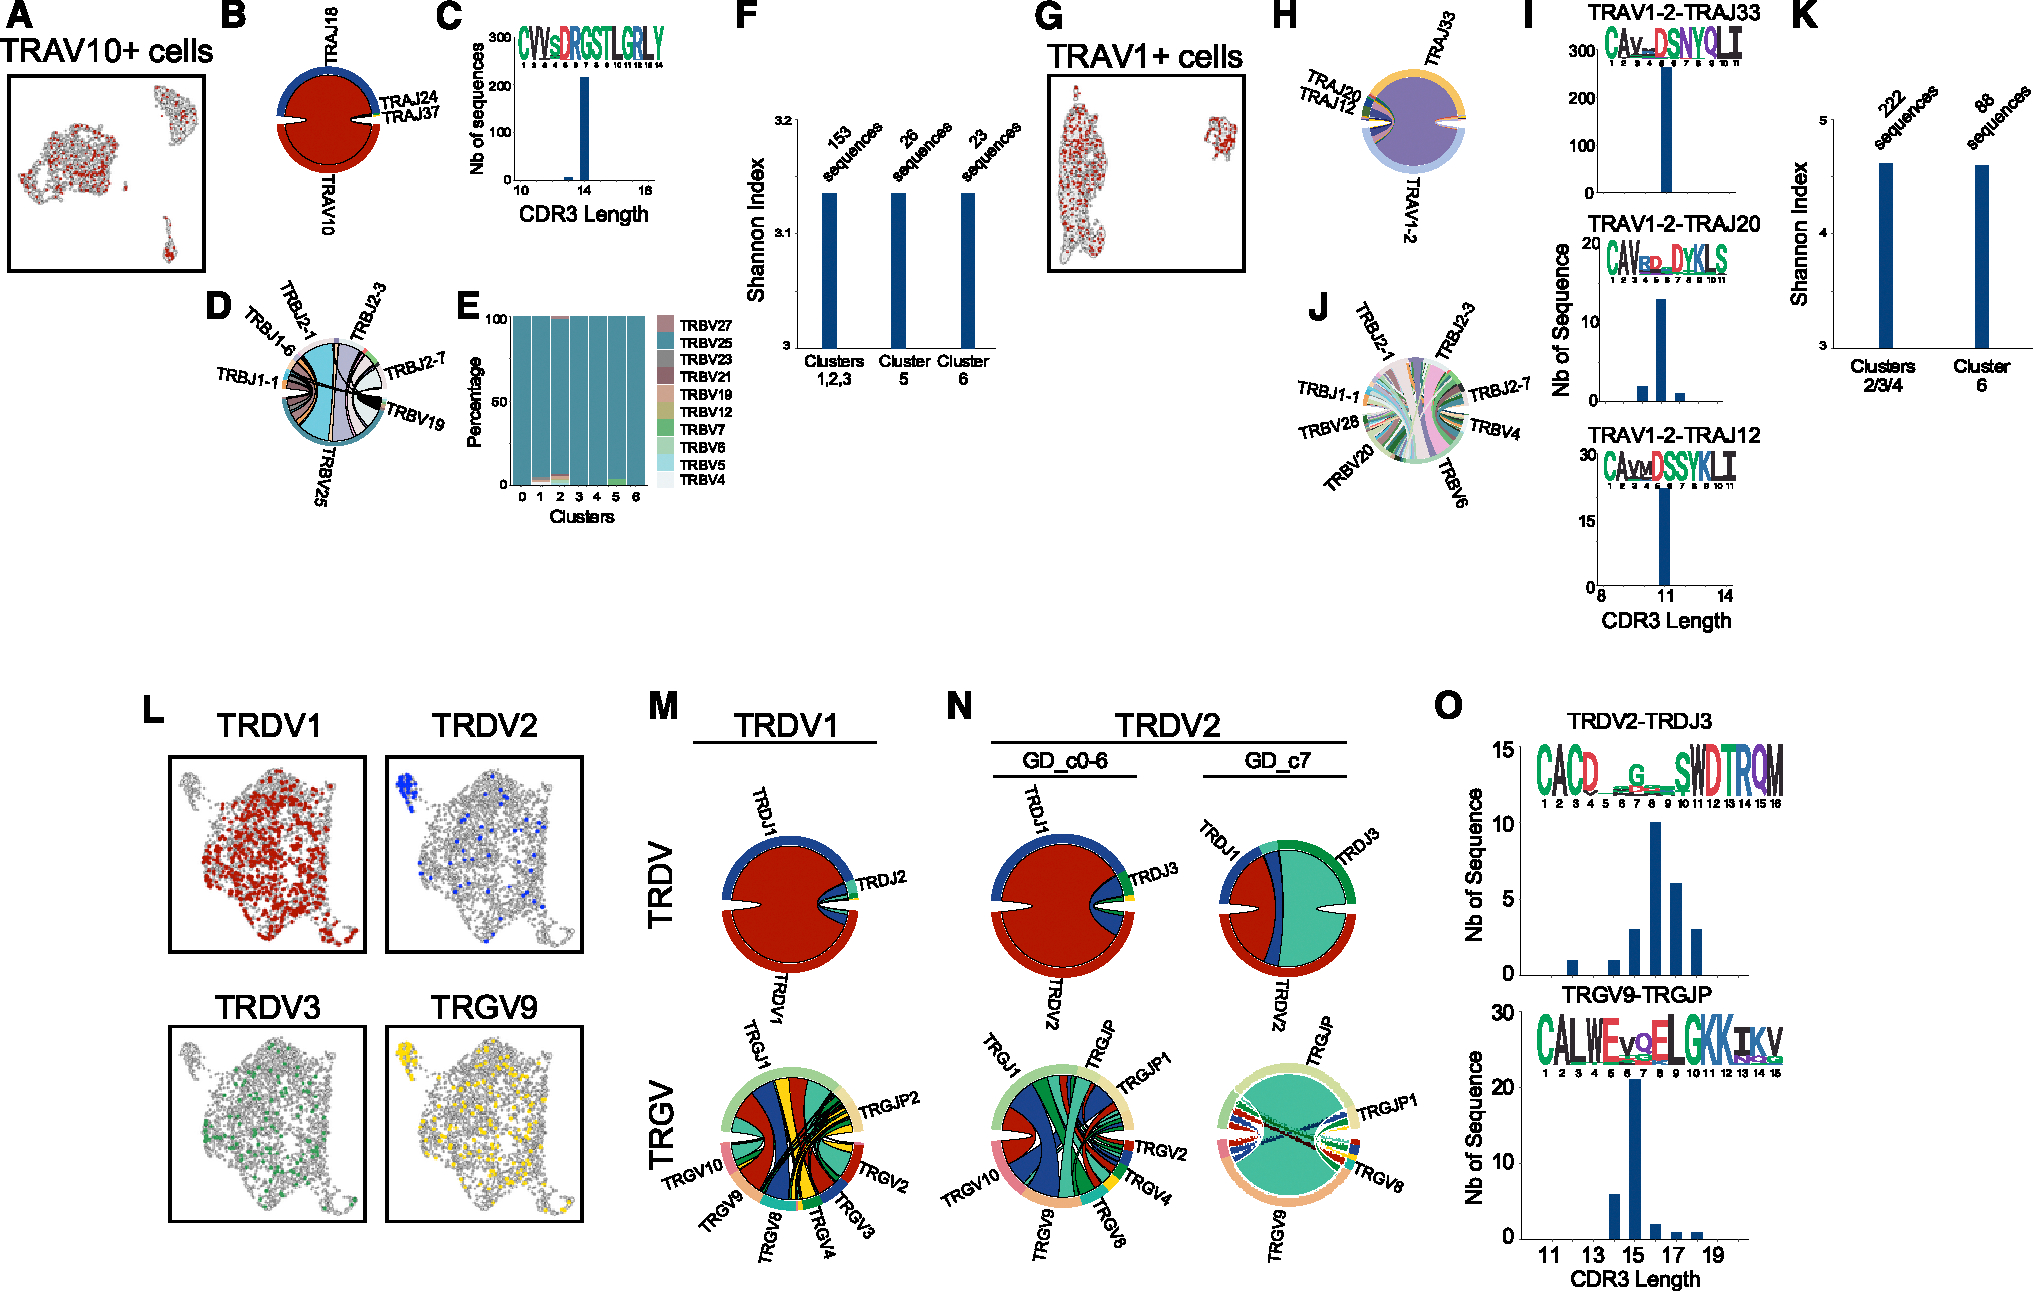
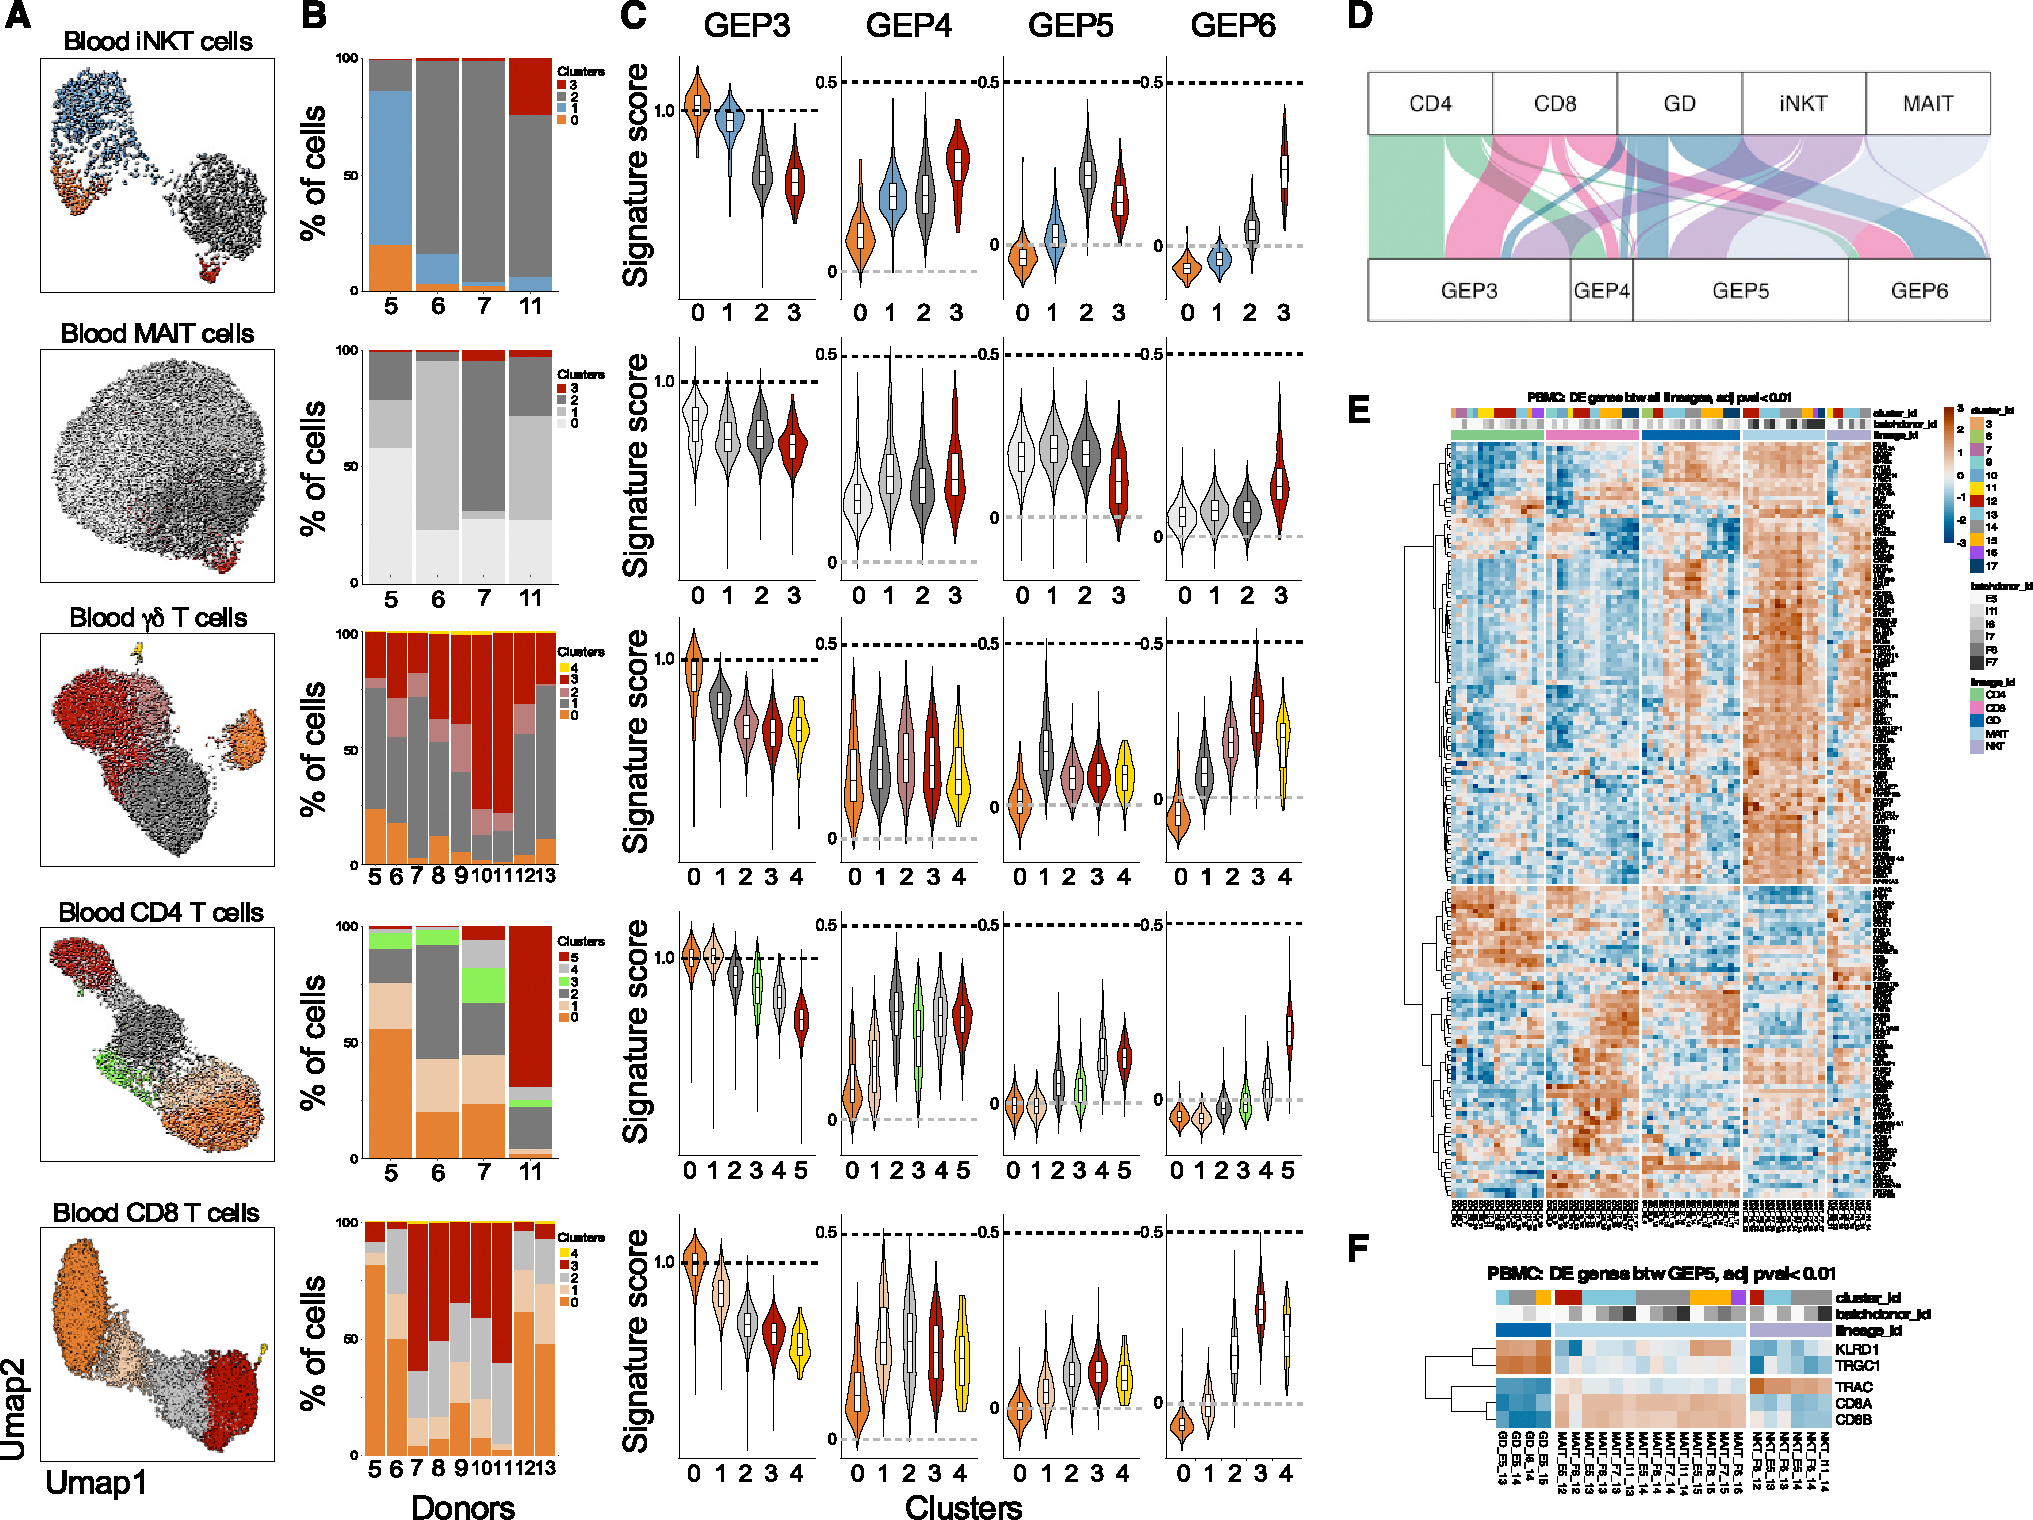
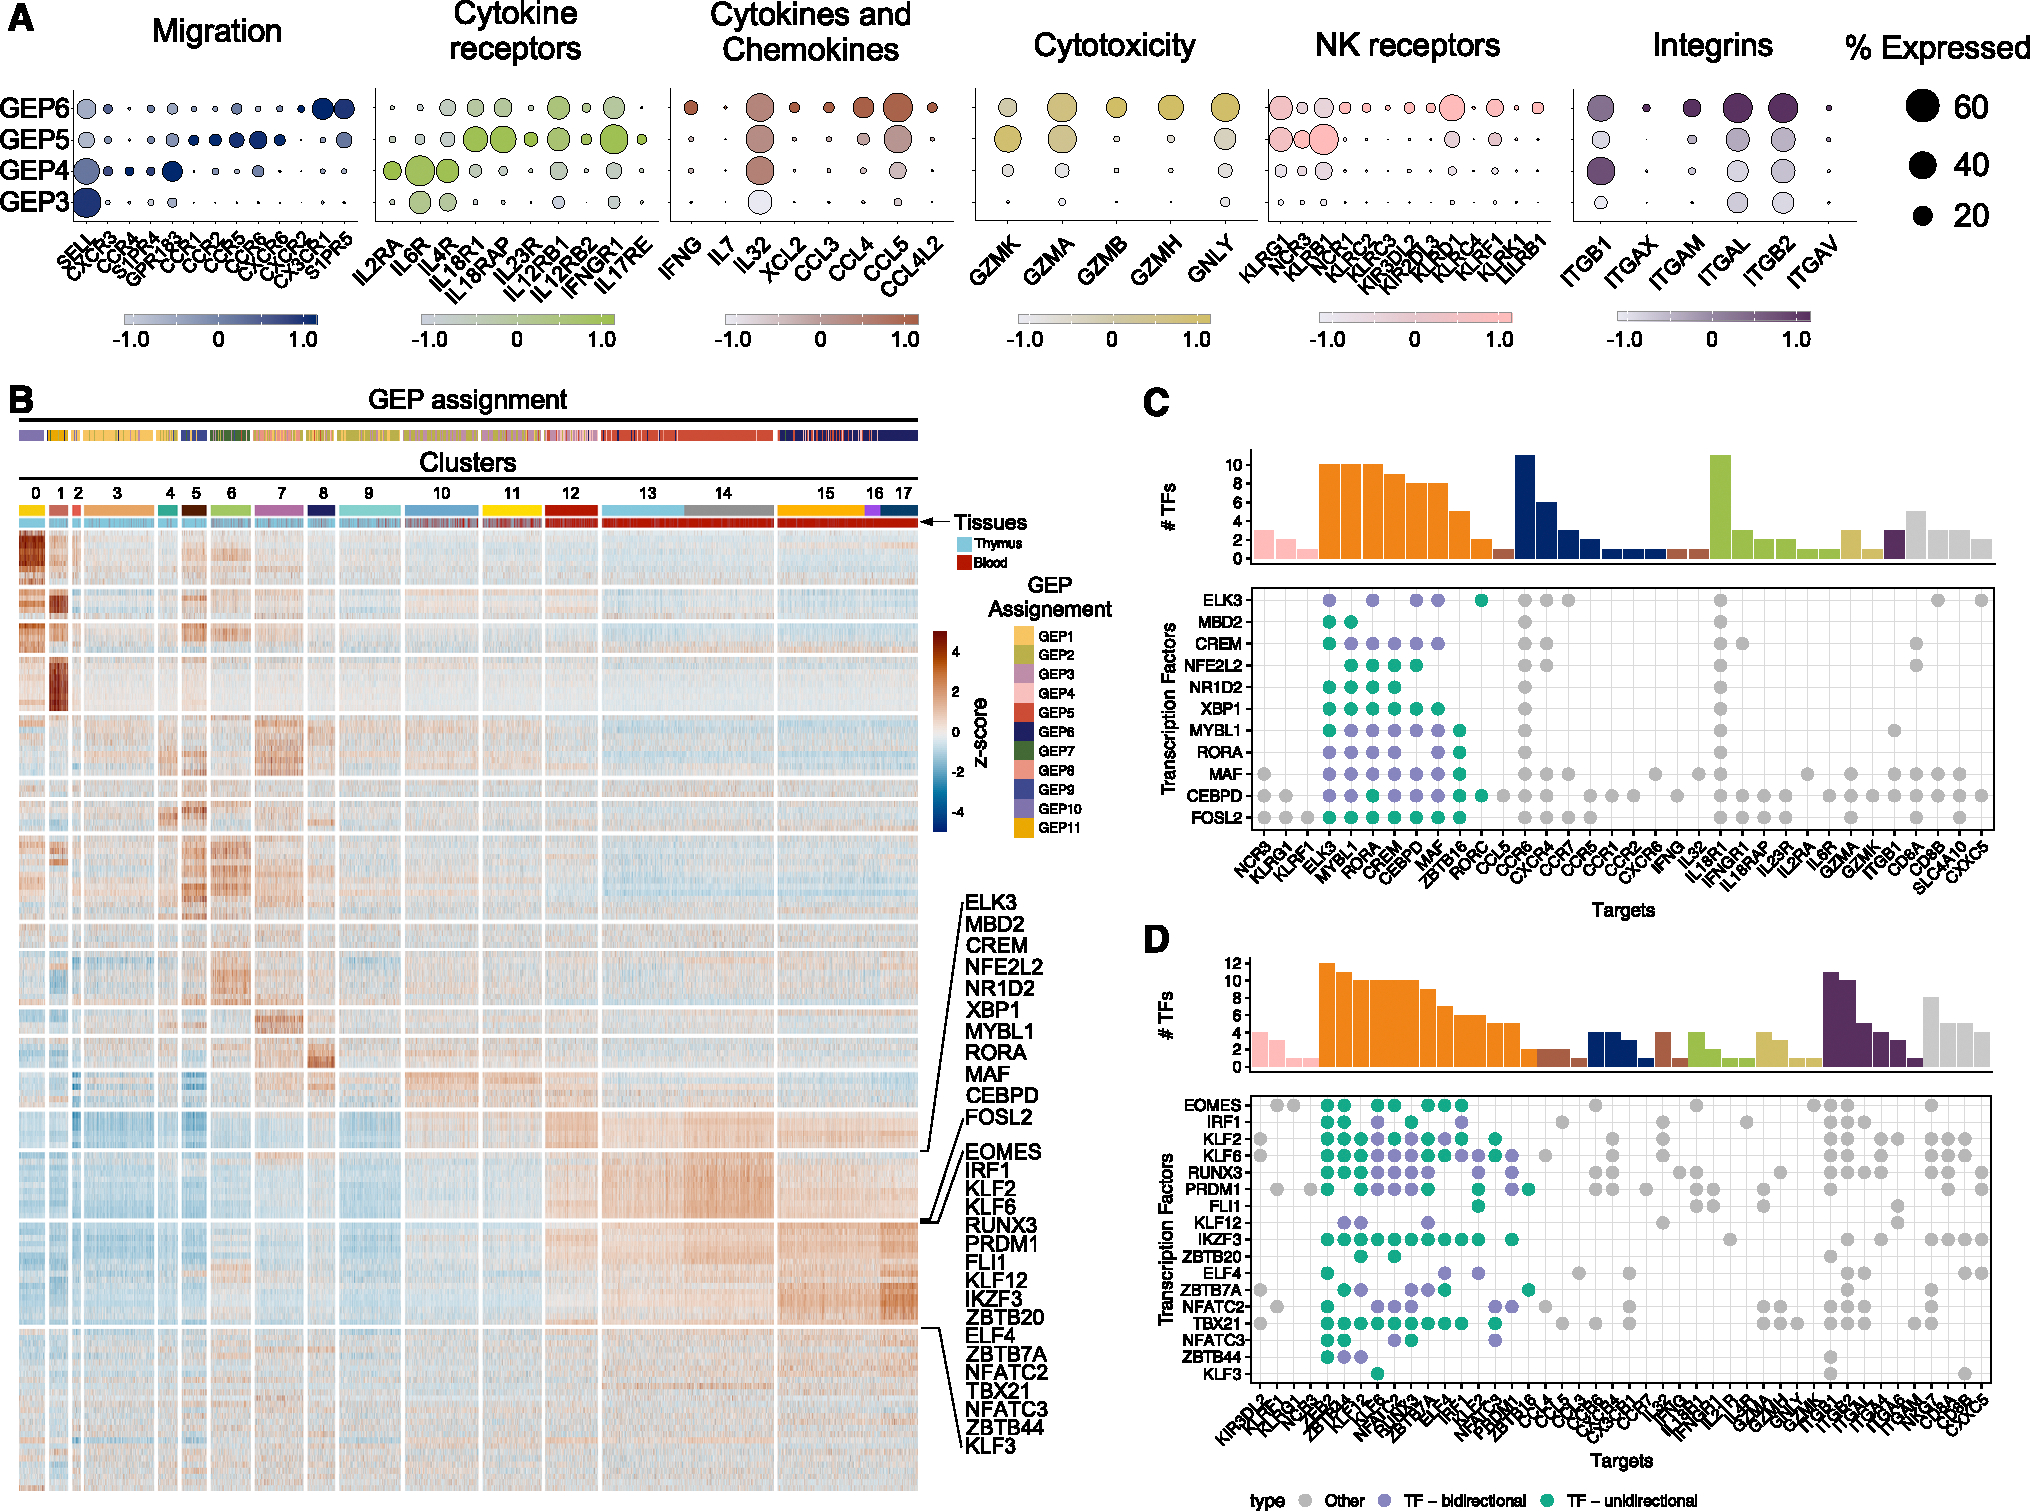
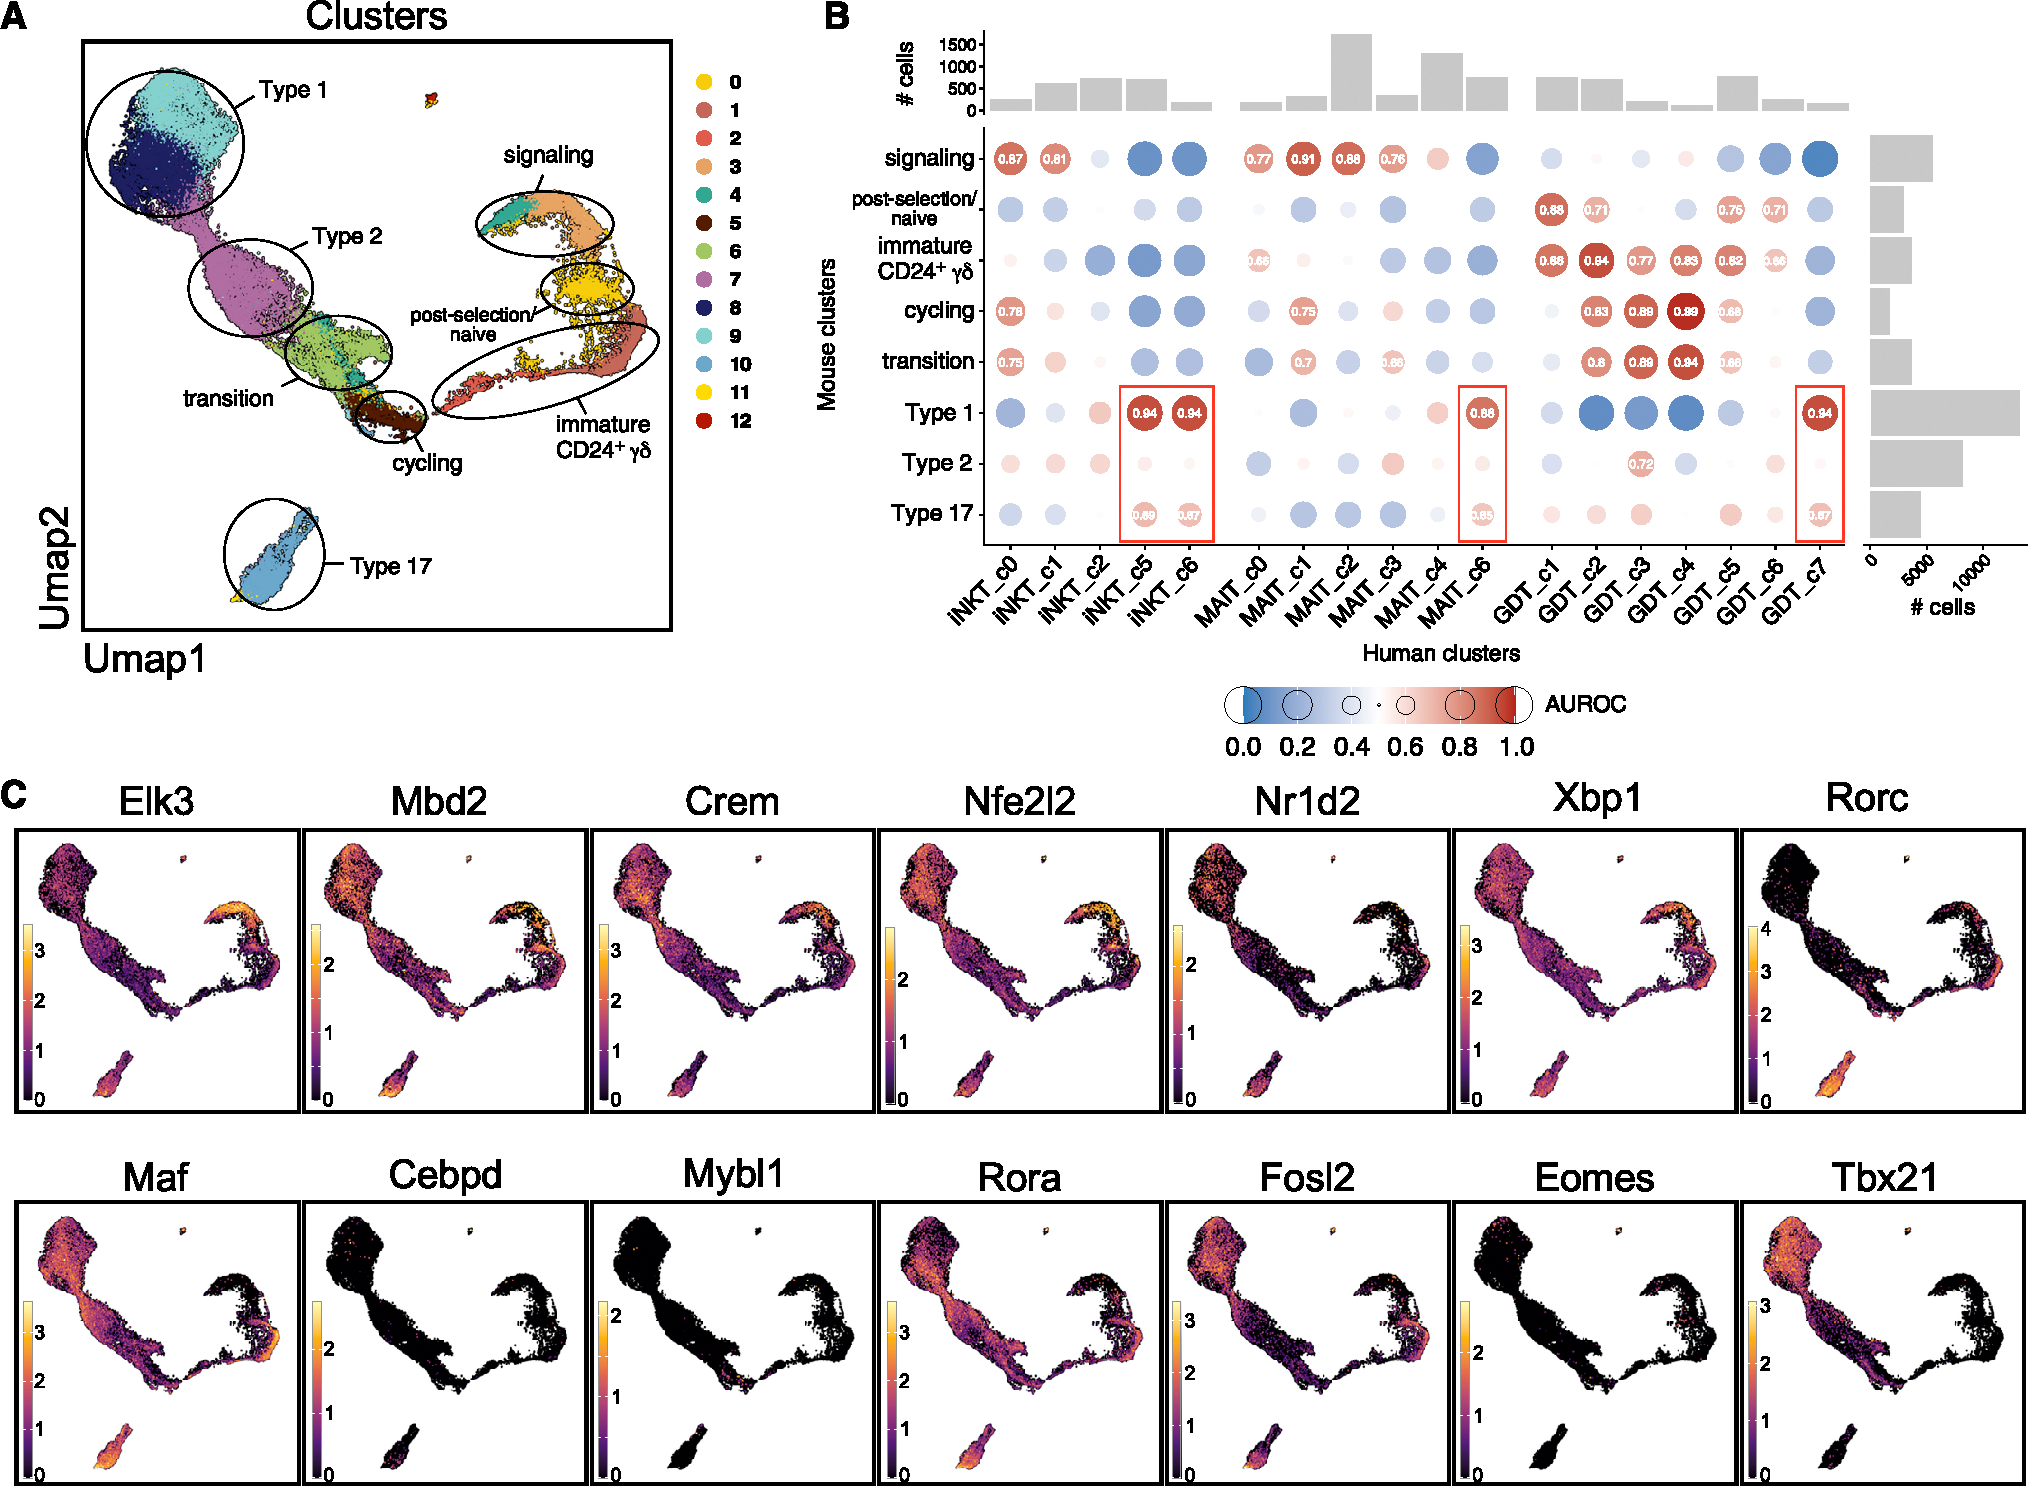
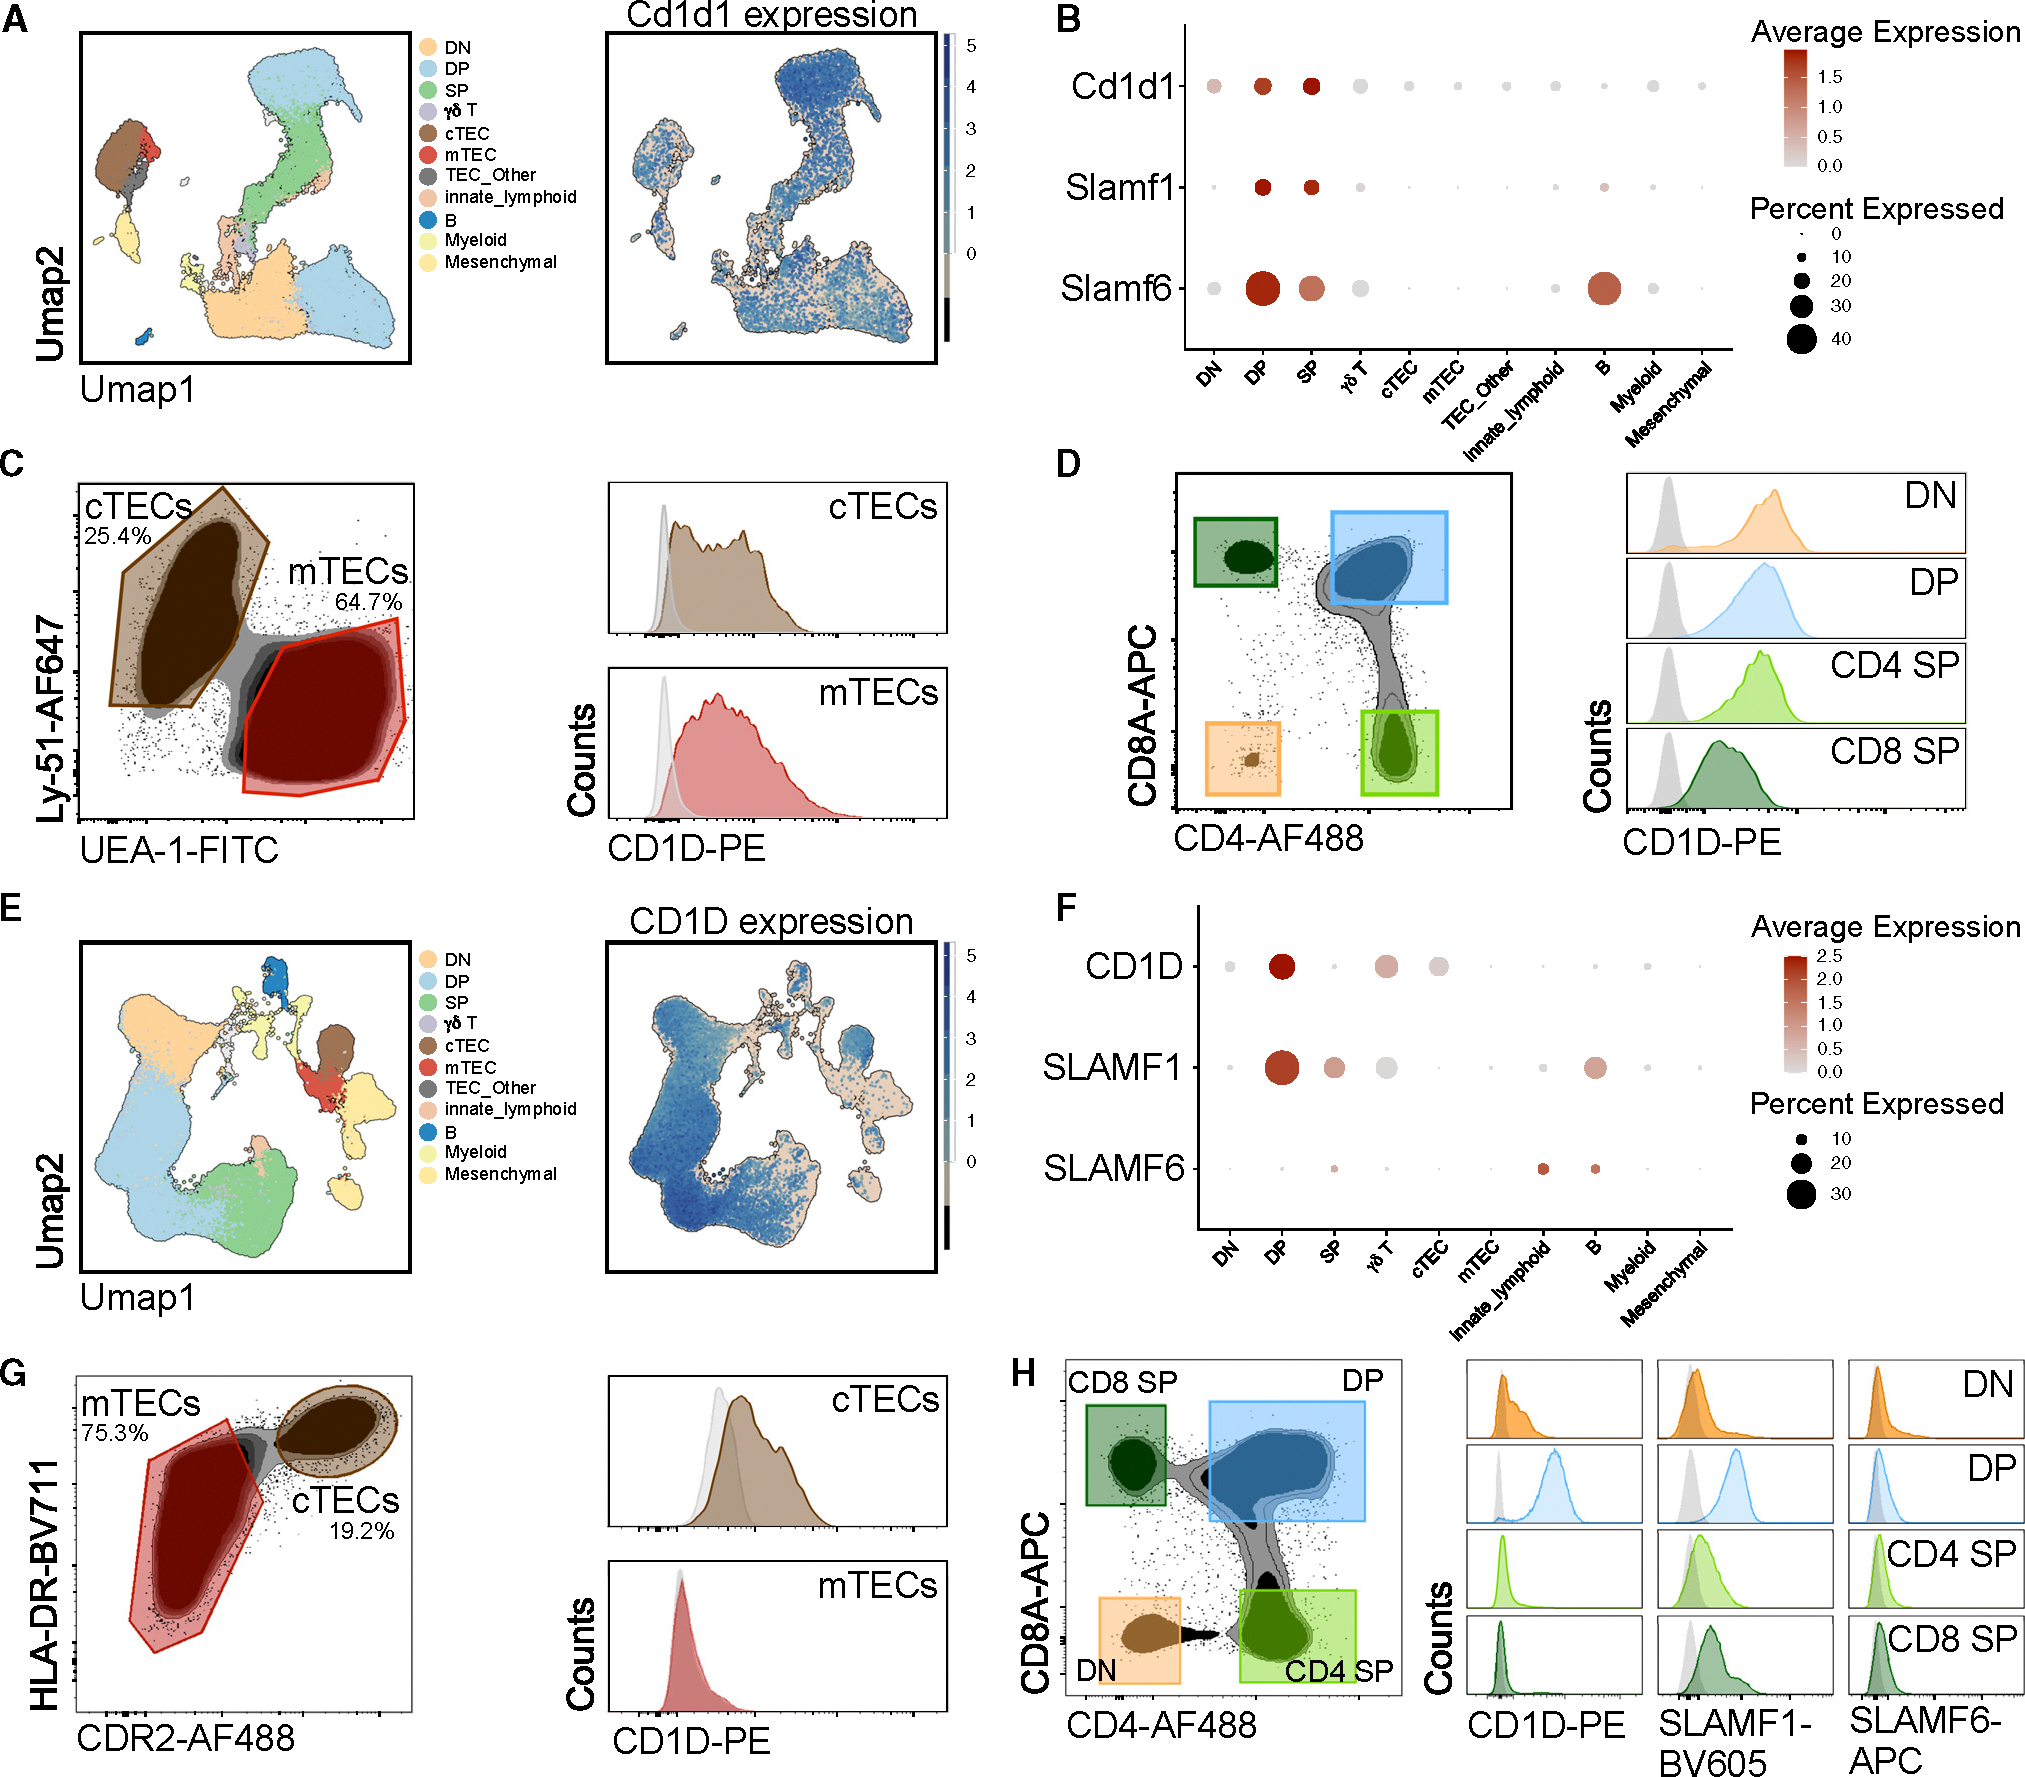
The "innate-like" T cell compartment, known as Tinn, represents a diverse group of T cells that straddle the boundary between innate and adaptive immunity. We explore the transcriptional landscape of Tinn compared to conventional T cells (Tconv) in the human thymus and blood using single-cell RNA sequencing (scRNA-seq) and flow cytometry. In human blood, the majority of Tinn cells share an effector program driven by specific transcription factors, distinct from those governing Tconv cells. Conversely, only a fraction of thymic Tinn cells displays an effector phenotype, while others share transcriptional features with developing Tconv cells, indicating potential divergent developmental pathways. Unlike the mouse, human Tinn cells do not differentiate into multiple effector subsets but develop a mixed type 1/type 17 effector potential. Cross-species analysis uncovers species-specific distinctions, including the absence of type 2 Tinn cells in humans, which implies distinct immune regulatory mechanisms across species.

Keywords: CP: Immunology; MAIT; T cell development; gamma delta T cells; iNKT; thymus.


Conflict of interest statement

Declaration of interests The authors declare no competing interests.

Figures

Figure 1.
Figure 1.. Integrative view on Tinn and Tconv development and peripheral function
(A) Experimental setup specifying donor type (postnatal/adult), tissue, and sorted cell types. (B) Harmony batch-corrected and integrated dataset across donors, tissues, and cell types. (C–E) (C) Stable Louvain-derived cell clusters distributed across (D) both blood and thymus-derived cells and (E) their respective frequencies in these clusters. (F) “Egress” score on thymus- and blood-derived cells. (G) Cells color coded by cluster (as in C) visualized by their hashtag-sorted cell type (columns) and the tissue they originated from (rows). (H–J) (H) Projection of naive and effector scores and the proportion of (I) thymic and (J) blood cell types per donor, classified on the basis of these scores (bottom row); top row shows analogous proportions by cell cluster (as in C). (K) Gene-expression programs (GEPs) in thymus and blood identified using cNMF, with color scale representing GEP usage. Sample numbers for all panels as depicted in (A). Score defining genes as described in text.
Figure 2.
Figure 2.. Gene-expression patterns in thymocyte lineages
(A) Heatmap showing MetaNeighbor’s AUROC scores between thymocytes split by donor, lineage, and non-effector (c0–11) versus effector (c12–17) clusters. Barplots indicate thymocyte proportions per lineage. (B) Pseudo-bulk differential expression analysis between CD4+/iNKT and CD8+/MAIT thymocytes in naive clusters (3, 9, 10, 11). As a negative control, the only three genes that were differentially expressed between CD4+/MAIT and CD8+/iNKT thymocytes are displayed in the center of the heatmap. (C) Pseudo-bulk differential expression analysis between CD4+/CD8+ and iNKT/MAIT thymocytes in naive clusters (3, 9, 10, 11). For both (B) and (C), heatmap displays the expression level of genes (represented with color scale as a Z score of the average normalized expression) that are significantly differentially expressed (padj < 0.01). (D) Clustering of hashtag-separated thymic iNKT cells (top), MAIT cells (middle), and γδ T cells (bottom). Right panel shows the score of type I and type III effector gene signature for the corresponding thymic lineage. (E) Kernel density estimates of the normalized expression level of genes of interest. The expression level distribution varies between genes and lineage. The range of kernel density estimate values also varies between each panel (from 0 to 0.04 for the smallest range and 0 to 0.4 for the largest range). A unique color scale was represented to indicate the direction of the values.
Figure 3.
Figure 3.. Innate T cell TCR diversity during development
Cells with VDJ sequencing and their cell-type-specific characteristic chain arrangement for thymic iNKT cells (A), MAIT cells (G), and γδ T cells (L). For each cell type, the respective proportions of gene segment usage in each chain (B and D; H and J; M and N) are shown together with their CDR3 length and sequence logo (C, I, O) and their cluster-specific usage (E, with clusters as in Figure 2A). Shannon index as an estimation of TCR diversity in the naive-like and effector-like iNKT (F) and MAIT (K) cells, based on clusters in Figure 2D. n = 1 human thymus sample for all panels.
Figure 4.
Figure 4.. Gene-expression programs in circulating Tinn and Tconv
(A–C) (A) Clustering of hashtag-separated blood iNKT, MAIT, γδ T, CD4, and CD8 T cells, (B) the respective proportion of cells per cluster and donor, and (C) the effector GEP signature scores (as in Figure 1K) per cell type and cluster. (D) Top GEP usage for each cell type, based on cNMF-derived usage matrix. (E) Pseudo-bulk, pairwise differential gene expression between cell types. (F) Cell-type-specific genes among Tinn cells using GEP5. For both (E) and (F), heatmaps depict the expression level of genes (represented with color scale as a Z score of the average normalized expression) that are significantly differentially expressed (padj < 0.01). n = 4, 4, 9, 4, and 9 for iNKT, MAIT, γδ, CD4, and CD8 cells, respectively.
Figure 5.
Figure 5.. Effector gene-expression programs in Tinn and Tconv
(A) Key genes categorized by function and depicted by their expression level (Z-score color scale) and percentage of expression in cells belonging to the indicated GEPs. (B–D) (B) Single-cell regulatory network inference and clustering of TFs and enrichment score per cell (as row-scaled Z scores), ordered by cluster (as in Figure 1C), with tissue of origin and GEP assignment (based on cNMF usage) indicated by color bar. Two row clusters are marked, which are preferentially enriched in Tinn (upper bracket) and Tconv (lower bracket). (C and D) TFs with pronounced activity in (C) Tinn and (D) Tconv (corresponding to brackets in B) and their targets. Green dots indicate TFs (y axis) that have other TFs as their target (x axis), where purple labels TFs that can interact in either direction. The marginal bar chart shows the number of TFs per target, color coded by their functional categorization (as in A).
Figure 6.
Figure 6.. Cross-species comparison of mouse and human Tinn development
(A) Mouse Tinn reference atlas with seven characteristic cell states highlighted, which are found across lineages (as in Figure S15). (B) MetaNeighbor analyses showing pairwise correspondence (AUROC scores) between murine Tinn (as in A) and human iNKT, MAIT, and γδ T cell clusters (as in Figure 2D). Marginal bar charts indicate number of cells in the corresponding clusters. (C) Expression of human regulon-driving TFs (as in Figure 5) together with murine TFs of importance in Tinn development (Rorc, Tbx21) projected on mouse Tinn reference atlas (as in A).
Figure 7.
Figure 7.. CD1D, SLAMF1, and SLAMF6 gene and protein expression in mouse and human thymus
(A) Clustering of thymic cell populations and (E) their expression of Cd1d1 (mouse)/CD1D (human) derived from the mouse and human thymus cell atlas, respectively. (B and F) Normalized expression of Cd1d1/CD1D and Slam/SLAM transcripts across thymic cell populations. Flow cytometry of (C and G) mouse and human TECs and (D and H) thymocyte subsets.

Update of

References

    1. Sallusto F, Lenig D, Förster R, Lipp M, and Lanzavecchia A (1999). Two subsets of memory T lymphocytes with distinct homing potentials and effector functions. Nature 401, 708–712. 10.1038/44385. - DOI - PubMed
    1. Kaech SM, and Cui W (2012). Transcriptional control of effector and memory CD8+ T cell differentiation. Nat. Rev. Immunol. 12, 749–761. 10.1038/nri3307. - DOI - PMC - PubMed
    1. Jameson SC, and Masopust D (2018). Understanding Subset Diversity in T Cell Memory. Immunity 48, 214–226. 10.1016/j.immuni.2018.02.010. - DOI - PMC - PubMed
    1. Godfrey DI, Uldrich AP, McCluskey J, Rossjohn J, and Moody DB (2015). The burgeoning family of unconventional T cells. Nat. Immunol. 16, 1114–1123. 10.1038/ni.3298. - DOI - PubMed
    1. Mayassi T, Barreiro LB, Rossjohn J, and Jabri B (2021). A multilayered immune system through the lens of unconventional T cells. Nature 595, 501–510. 10.1038/s41586-021-03578-0. - DOI - PMC - PubMed

Publication types