. 2024 Sep 26;67(18):16107-16127.
doi: 10.1021/acs.jmedchem.3c02084. Epub 2024 Sep 12.

CETZOLE Analogs as Potent Ferroptosis Inducers and Their Target Identification Using Covalent/Affinity Probes

Affiliations

CETZOLE Analogs as Potent Ferroptosis Inducers and Their Target Identification Using Covalent/Affinity Probes

Samkeliso Dlamini et al. J Med Chem. .

Abstract

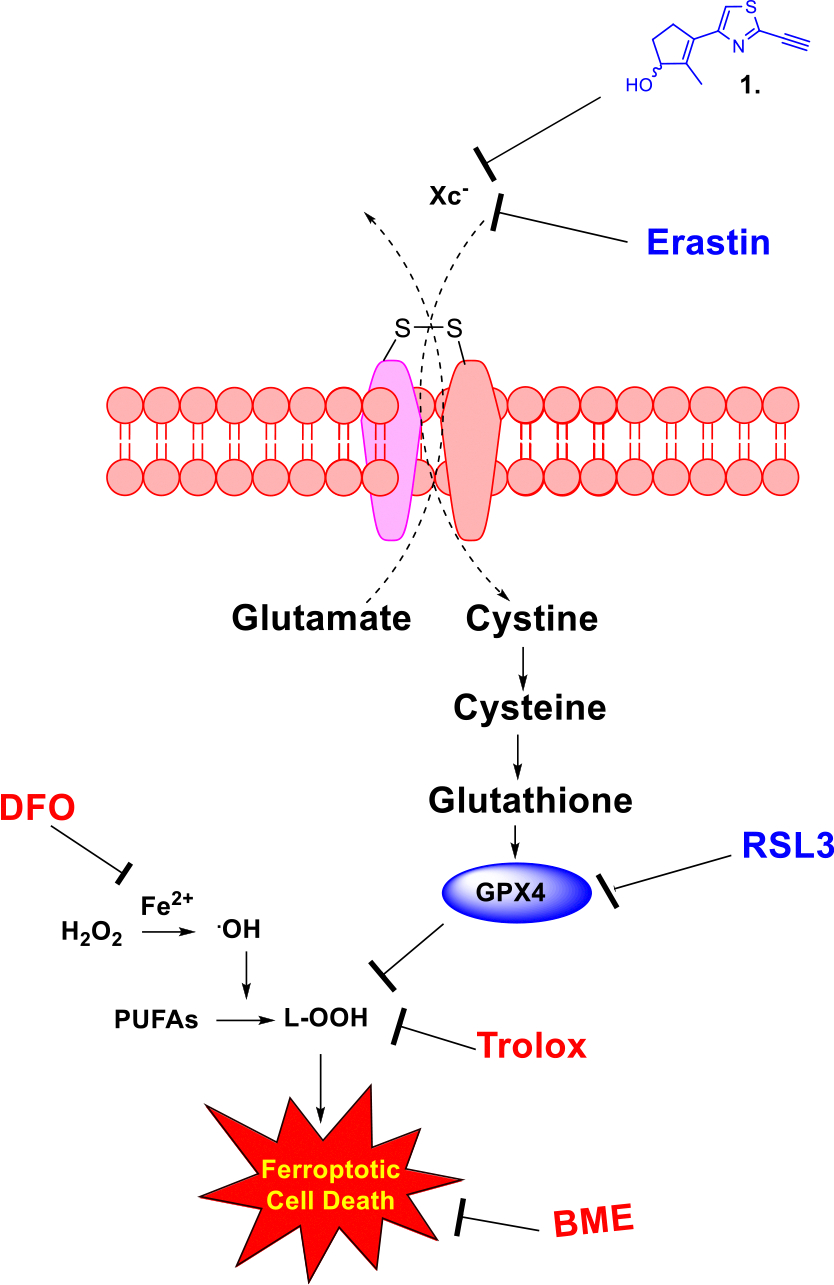
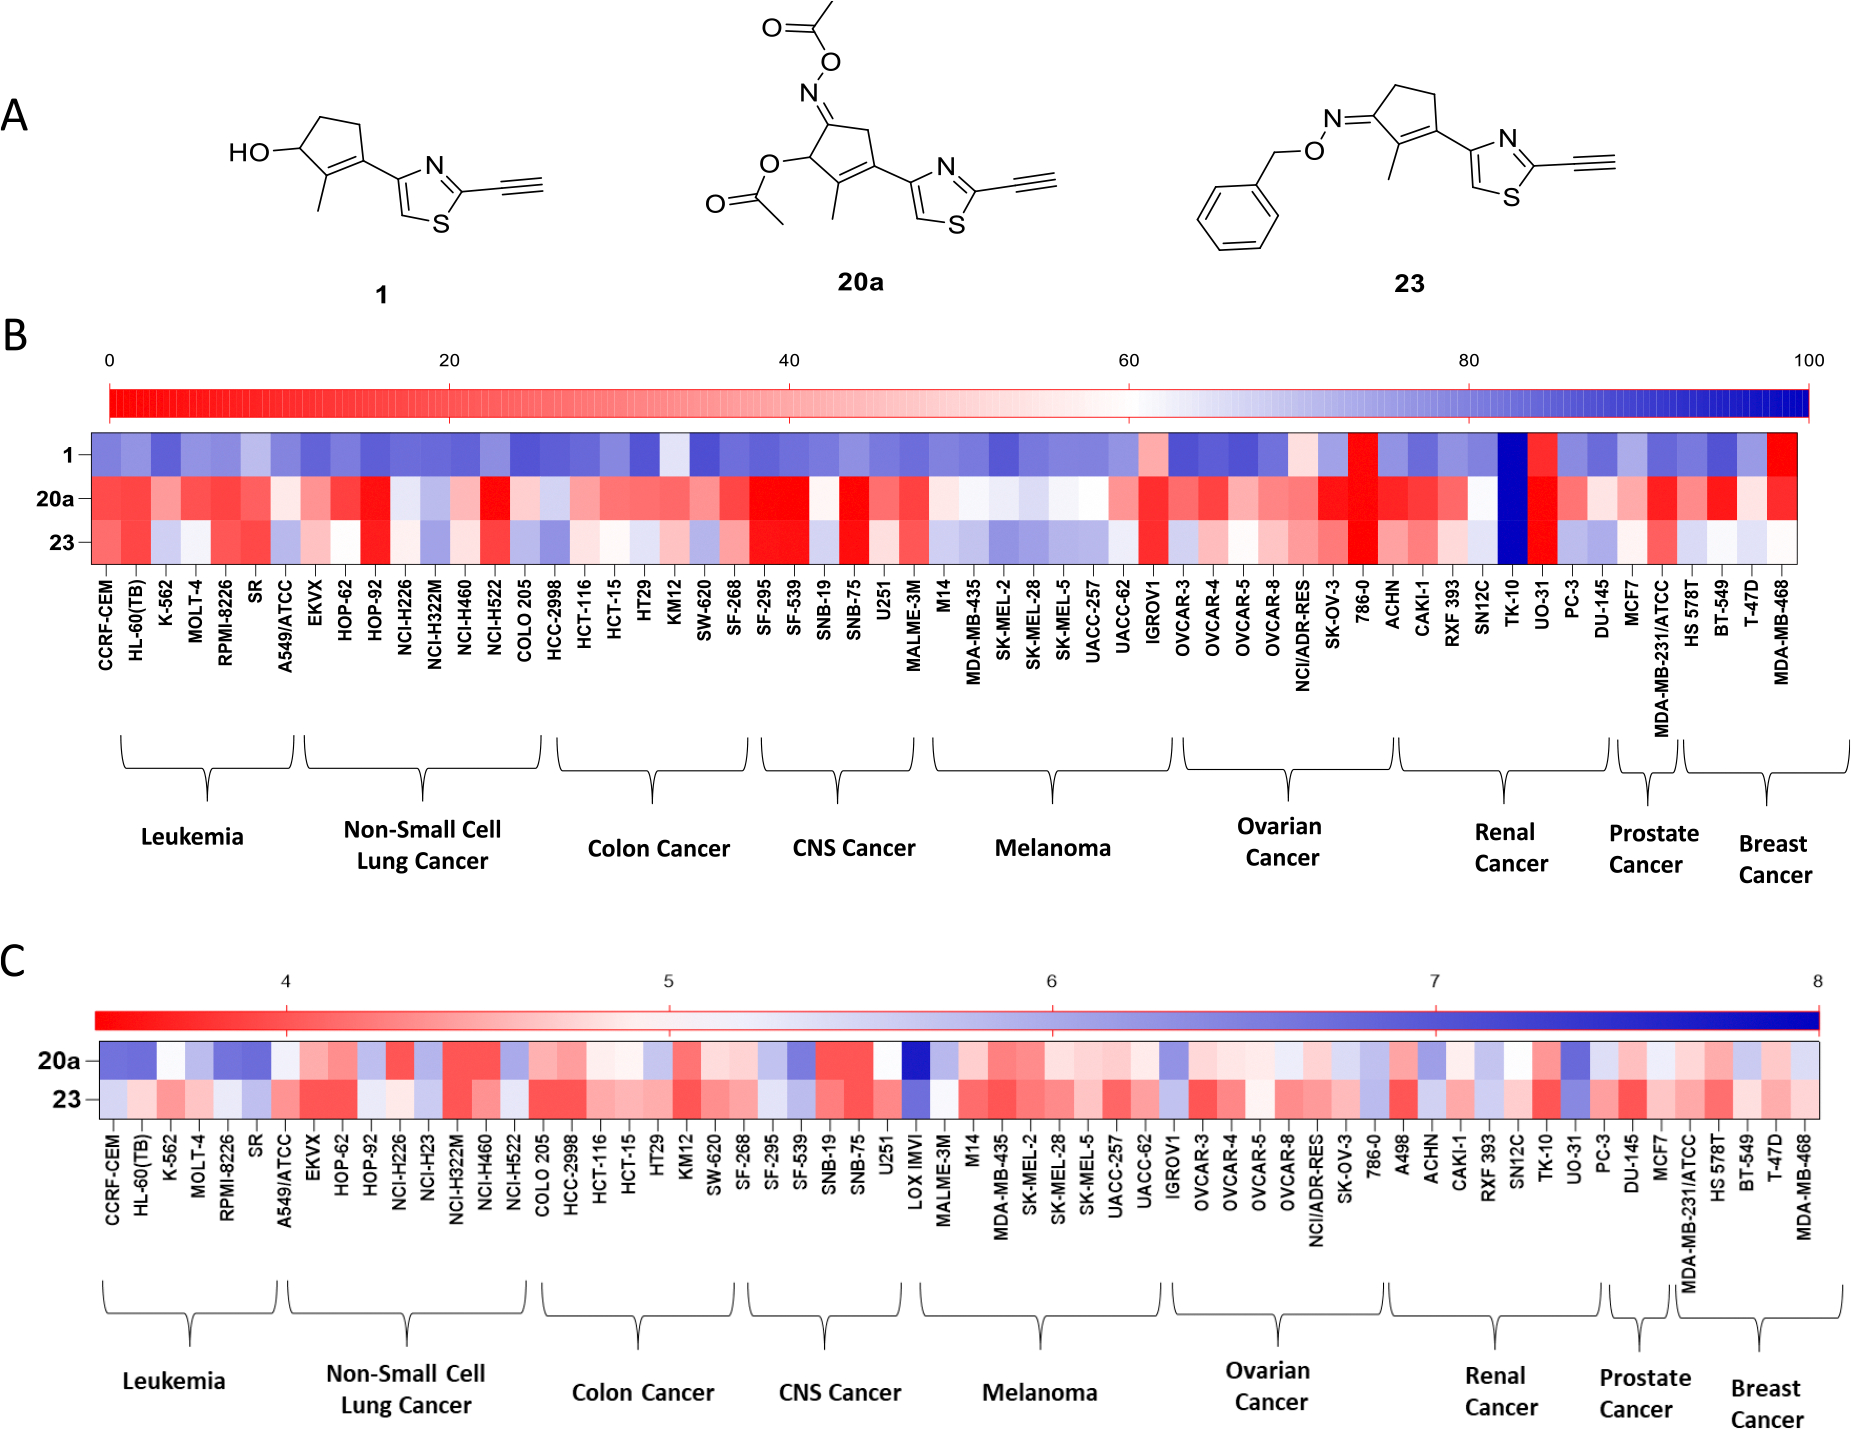
Ferroptosis is a recently discovered cell death mechanism triggered by iron-dependent elevation of reactive oxygen species leading to lipid membrane peroxidation. We previously reported the development of a new class of ferroptosis inducers referred to as CETZOLEs with CC50 values in the low micromolar range. Structure-activity relationship study of these compounds led to the development of more potent analogs with CC50 values in the nanomolar range. Cells exposed to these compounds displayed the hallmarks of ferroptosis including cell death through ROS accumulation. Cancer cells were found to be more sensitive to these compounds than normal cells. Proteomic studies using covalent and affinity probes led to the identification of cystathionine β-synthase, peroxiredoxins, ADP/ATP carriers, and glucose dehydrogenase as enriched proteins. The binding of CETZOLEs to these proteins as well as GPX4 was validated by Western blotting. This group of proteins is known to be associated with cellular antioxidant pathways.


Conflict of interest statement

The authors declare no competing financial interest.

Figures

Figure 1.
Figure 1.
Ferroptosis agents: erastin, RSL3, and CETZOLE (1).
Figure 2.
Figure 2.
Tentative mechanistic pathway for CETZOLE’s induction of ferroptosis cell death. Shows Xc, a potential target of CETZOLE 1 and CETZOLE-induced ferroptosis inhibition by Trolox, DFO and BME.
Figure 3.
Figure 3.
Change in CC50 values of analogs 14, 1, 21, 20a with change in structure.
Figure 4.
Figure 4.
(A) Live cell time point picture montage of NCI-H522 cells treated with DMSO, CETZOLE 1 and CETZOLE analogs 20a and 23. 3-Fold CC50 drug concentration treatment was applied for RSL3 (3.3 μM), CETZOLE 1 (7.68 μM), 20a (0.51 μM) and 23 (4.08 μM). (B) Cell survival analysis using Kaplan–Meier plots (Asymmetrical method, CI = 95%) of NCI-H522 cells treated with DMSO, RSL3, CETZOLE 1 and analogs 20a, 23. The time (h) point at which cell death occurred was counted as an event. Rapid cell death occurred in RSL3 and 20a. (C) A three-day ferroptosis rescue assay of NCI-H522 cells treated with DMSO, CETZOLE 1, RSL3 and CETZOLE analogs 20a and 23 compared to cotreatment with liproxstatin-1. Presented as the relative difference from DMSO, data (mean (x)±SD, n = 3) was quantified using the one-way ANOVA statistical test with *P < 0.05, **P < 0.01, and ***P < 0.001. ns.: not significant.
Figure 5.
Figure 5.
(A–E) Flow cytometry and BODIPY-C11 dye analysis of cellular ROS levels in NCI-H522 cells treated with 3-fold CC50 concentration of CETZOLE analogs 20a (0.51 μM), 20b (0.36 μM), 20c (0.39 μM), 23 (4.08 μM), and CETZOLE 1 (7.68 μM) for 3 h. CETZOLE analogs (A–D) induced lipid peroxidation in NCI-H522. Presented as the relative difference from DMSO, data (mean (x)±SD, n = 3) was statistically quantified using the Student’s t test with *P < 0.05, **P < 0.01, and ***P < 0.001. ns.: not significant.
Figure 6.
Figure 6.
Selective cytotoxicity assay of analogs 20a–c, and 23 relative to DMSO, CETZOLE 1 and RSL3 (controls) at 1 μM concentration against NCI-H522 and HT-1080 cancer cell lines, and WI38 and MEFs normal cell lines. Analogs 20a, 20b, and 20c show higher selectivity toward cancer cell lines than RSL3.
Figure 7.
Figure 7.
Growth inhibitory activity of CETZOLE 1 and analogs 20a and 23 in the National Cancer Institute 60 cell line assay. (A) Structures of analogs tested. (B) Heat map of growth inhibitory activity of CETZOLE 1 and analogs 20a and 23 at 10 μM. (C) Heat map of GI50 values of analogs 20a and 23 in the dose response assay.
Figure 8.
Figure 8.
Structures of CETZOLE probes (41–46) and their corresponding negative controls (41a–46a) designed for synthesis. Colors represent: blue = biorthogonal handle; magenta = fluorescent tag; green = affinity tag; orange: photoaffinity group.
Figure 9.
Figure 9.
Evaluation of ferroptosis-inducing character of CETZOLE probes. A three-day ferroptosis rescue assay of NCI-H522 cells treated with DMSO, 3-fold the CC50 concentration of CETZOLE 1 (7.68 μM), RSL3 (3.3 μM), CETZOLE probes 45 (13.68 μM), 41 (6.93 μM), 43 (7.8 μM) compared to liproxstatin-1 (1 μM.) cotreatment showing significant ferroptosis inducing properties. Presented as the relative difference from DMSO, data (mean (x)±SD, n = 3) was quantified using the one-way ANOVA statistical test with *P < 0.05.
Figure 10.
Figure 10.
Cellular localization of CETZOLE probes. (A) Workflow diagram of live cell imaging of HeLa cells treated with DMSO, 41 and the corresponding negative probe 41a. Cells were incubated with the respective agent, permeabilized, subjected to TAMRA-PEG3 azide ligation, and viewed under microscope. (B) Probes employed in bioimaging. (C) Live cell bioimages of cells treated with DMSO, 41 and 41a. (D) Single cell image of 41-treated cells showing fluorescing intracellular cell organelles. (E) Single cell image of 41-treated cells showing fluorescing chromosomes.
Figure 11.
Figure 11.
(A) Workflow diagram for dose-dependent competitive binding assay of 41 and negative control 41a with increasing concentrations of CETZOLE 1. (B) Binding assay screening of NCI-H522, HT-1080 and MDA-MB231 cancer cell lines. (C) Competitive binding assay of 41 against increasing concentrations (5–40 μM) of CETZOLE 1. (D) Competitive binding study against selected known ferroptosis inducers (CETZOLE 1, RSL3, erastin, ML210, ML160 and SSZ) (20 μM). (E) TAMRA-PEG-3-Azide used for ligation.
Figure 12.
Figure 12.
(A) Workflow diagram for protein target pull down assay with 41 and corresponding negative probe 41a. (B) Fluorescence gel of the pull-down assay with 41 and corresponding negative probe 41a with target band highlighted with red asterisk. (C) A Venn diagram showing 489 proteins unique to 41, 250 proteins unique to 41a and common proteins from both treatments (911 proteins). (D) Venn diagram showing highly enriched proteins and sub-Venn diagram showing enriched antioxidation related proteins. (E)(i) Validation of target proteins CBS, (ii) GPX4, and (iii) PRDX4 by Western blot using antibodies. (F) Biotin-TAMRA-PEG-3-Azide used for ligation.
Figure 13.
Figure 13.
GPX4 inhibitor assay. Assay was conducted in cell free media and ML162 (25 μM), CETZOLE 1 (100 μM), 20a (100 μM), or 20b (100 μM) were used in the assay. DMSO used as the vehicle and the GPX4 inhibitor ML162 as a positive control for comparison. CETZOLE 1, ML162, 20a and 20b significantly reduced GPX4 activity. Presented as the relative difference from DMSO, Data (mean (x)±SD, n = 3) was quantified using the student t test with *P < 0.05.
Figure 14.
Figure 14.
G6PD inhibitor assay. Assay was conducted in cell free media and ML162 (25 μM), CETZOLE 1 (100 μM), 20a (100 μM), or 20b (100 μM) were used in the assay. DMSO was used as the vehicle. 20a and 20b significantly reduced G6PD activity. Presented as the relative difference from DMSO, Data (mean (x)±SD, n = 3) was quantified using the student t test with *P < 0.05.
Scheme 1.
Scheme 1.. Previous Synthesis Approach of CETZOLE 1a
aReagents and conditions: (a) Pd(Ph)4 (5 mol%), CuI (5 mol%), TEA, trimethylsilyl acetylene, toluene, 80 °C. (b) Me3SnCl, tert-BuLi, ether, −78 °C, 1 h. (c) Pd(Ph3)4, DMF, ΜW, 145 °C, 2 h, 47%. (d) K2CO3, MeOH, 5 min, rt, 97% (e) R-2-methyl-CBS-borane-Me2S, THF, 0 °C, 25 min. 75% ee.
Scheme 2.
Scheme 2.. Optimized Synthesis of CETZOLE 1a
Reagents and conditions: (a) 3-ethyl-5-(2-hydroxyethyl)-4-methylthiazol-3-ium bromide (10), THF, TEA, 95% (b) NaOH, THF 99% (c) Pd(PPh3)4 (5 mol%), CuI (5 mol%), TEA, trimethylsilyl acetylene, toluene, 80 °C, 63% (d) K2CO3, MeOH, 99% (e) NaBH4, MeOH, 0 °C → rt, 99% (f) NaBH4, MeOH, 0 °C → rt, 99%.
Scheme 3.
Scheme 3.. Approaches to Functionalize α-Carbon of CETZOLE Ketone 7a
aReagents and conditions: (a) LDA, BnBr (15) THF, 0°C → rt. (b) tert-butyl nitrite, HCl (5%), MeOH.
Scheme 4.
Scheme 4.. Synthesis of CETZOLE Analogs 20a–ha
a Reagents and conditions: (a) O-benzylhydroxylamine (22), NaOAc, MeOH, reflux, 30% (b) tert-butyl nitrite, HCl (5%), MeOH, 99% (c) DMAP, 17 a, TEA, DCM, rt, 99% (d) NaBH4, MeOH 0 °C → rt, 90% (e) DMAP, 17a–g, TEA, DCM, rt, 85–90% (f) Cs2CO3, MeCN, rt, 46% (g) NH2OH·HCl, NaOAc, MeOH, reflux (h)) NH2OH·HCl, NaOAc, MeOH/H2O, (3:1), reflux, 40% (i) cyanuric chloride, DMF, rt, overnight, 18%.
Scheme 5.
Scheme 5.. Synthesis of CETZOLE Amides (44,45), Fluorescent, Propargyl (41,42) and Photo-Reactive Probes (43,46)a
aCETZOLE oxime-ether probes and their corresponding negative controls (41a–46a) using the alkylation agents (28c–f). Reagents and conditions: (a) tert-butyl nitrite, HCl (5%), MeOH, 70–99%; (b) NaBH4, MeOH, 0°C → rt, 99%; (c) Cs2CO3, 28d,e,f, MeCN, 45–60%; (d) Cs2CO3, 28c, MeCN, 5–10%; (e) titanium isopropoxide, NH4OH (7N), MeOH, NaBH4, 0°C → rt, 8%; (f) 25a,b, EDC-HCl, DMAP, TEA, DCM, 70–95%; (g) (1) Pd(PPh3)4 (10 mol%), trimethylsilyl acetylene, CuI (10 mol%), TEA, toluene; (2) K2CO3, MeOH, 40%.
Scheme 6.
Scheme 6.. Synthesis of Alkylating Agents 28c,e,fa
a(ii) Coumarin 2-bromoacetamide 28c synthesis. (iii) Benzophenone bromoacetamide 28e synthesis. (iv) Aryl azide propargyl 2-bromoacetamide 28f synthesis. Reagents and conditions: (a) 2-bromoacetyl bromide (30), TEA, DCM, 0°C → rt, 60%; (b) pent-4-ynoic acid (32), EDC-HCl, DMAP, DCM, 80%; (c) 2-bromoacetyl bromide (30), TEA, DCM, 0°C → rt, 50%; (d) (1) Boc-anhydride, DMAP, DCM, 99%; (2) CuI2 (10 mol %), DMEDA, NaN3, sodium ascorbate, EtOH/H2O (7:1), reflux, 80%; (e) (1) NaOH, MeOH; (2) prop-2-yn-1-amine (38), EDC-HCl, DCM, DMAP, 99%; (f) (1) TFA/DCM; (2) 2-bromoacetyl bromide (30), TEA, DCM, 0°C → rt, 99%.

Similar articles

References

    1. Biancur DE; Paulo JA; Małachowska B; del Rey MQ; Sousa CM; Wang X; Sohn ASW; Chu GC; Gygi SP; Harper JW; Fendler W; Mancias JD; Kimmelman AC Compensatory Metabolic Networks in Pancreatic Cancers upon Perturbation of Glutamine Metabolism. Nat. Commun. 2017, 8, No. 15965. - PMC - PubMed
    1. American Cancer Society. Facts & Figures. Ca-Cancer J. Clin. 2019, 76.
    1. Siegel RL; Miller KD; Fuchs HE; Jemal A Cancer Statistics, 2021. CA Cancer J. Clin. 2021, 71 (1), 7–33. - PubMed
    1. Dixon SJ; Lemberg KM; Lamprecht MR; Skouta R; Zaitsev EM; Gleason CE; Patel DN; Bauer AJ; Cantley AM; Yang WS; Morrison B; Stockwell BR Ferroptosis: An Iron-Dependent Form of Nonapoptotic Cell Death. Cell J. 2012, 149 (5), 1060–1072. - PMC - PubMed
    1. Dächert J; Schoeneberger H; Rohde K; Fulda S RSL3 and Erastin Differentially Regulate Redox Signaling to Promote Smac Mimetic-Induced Cell Death. Oncotarget 2016, 7 (39), 63779. - PMC - PubMed

MeSH terms

LinkOut - more resources