. 2024 Sep 12;9(20):e180992.
doi: 10.1172/jci.insight.180992.

Characterization of SMA type II skeletal muscle from treated patients shows OXPHOS deficiency and denervation

Affiliations

Characterization of SMA type II skeletal muscle from treated patients shows OXPHOS deficiency and denervation

Fiorella Carla Grandi et al. JCI Insight. .

Abstract

Spinal muscular atrophy (SMA) is a recessive developmental disorder caused by the genetic loss or mutation of the gene SMN1 (survival of motor neuron 1). SMA is characterized by neuromuscular symptoms and muscle weakness. Several years ago, SMA treatment underwent a radical transformation, with the approval of 3 different SMN-dependent disease-modifying therapies. This includes 2 SMN2 splicing therapies - risdiplam and nusinersen. One main challenge for type II SMA patients treated with these drugs is ongoing muscle fatigue, limited mobility, and other skeletal problems. To date, few molecular studies have been conducted on SMA patient-derived tissues after treatment, limiting our understanding of what targets remain unchanged after the spinal cord-targeted therapies are applied. Therefore, we collected paravertebral muscle from 8 type II patients undergoing spinal surgery for scoliosis and 7 controls. We used RNA-seq to characterize their transcriptional profiles and correlate these molecular changes with muscle histology. Despite the limited cohort size and heterogeneity, we observed a consistent loss of oxidative phosphorylation (OXPHOS) machinery of the mitochondria, a decrease in mitochondrial DNA copy number, and a correlation between signals of cellular stress, denervation, and increased fibrosis. This work provides new putative targets for combination therapies for type II SMA.

Keywords: Bioinformatics; Genetics; Muscle biology; Neuromuscular disease; Skeletal muscle.


Conflict of interest statement

Conflict of interest: The authors have declared that no conflict of interest exists.

Figures

Figure 1
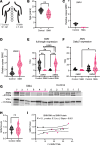
Figure 1. SMN RNA and protein levels are comparable between SMA type II and control paravertebral muscle.
(A) Diagram of the cohort with the sex balance for each group. (B) Age, in years, for the SMA (n = 8) and control (n = 7) groups. Each data point represents 1 patient. Groups were compared with a 2-sided Student’s t test. **P < 0.001. (C and D) Relative quantification (qPCR) of the copy number of SMN1 (C) or SMN2 (D) in gDNA (n = 5 controls, n = 8 SMA). Relative quantification was calculated with RPPH1 as a loading control. Each data point represents the average of 2 technical replicates of the measurement per patient. (E and F) Reads, represented as transcripts per million (TPM) mapping to the SMN full-length transcript (E), and the SMNΔ7 transcript missing exon 7 (F). The origin of the full-length transcript, either the SMN1 or SMN2 locus, is designated below each pair of violin plots. Each data point represents 1 sample: n = 7 for controls, n = 8 for SMA. Adjusted P values are derived from an ordinary 1-way ANOVA with Dunnett’s multiple-hypothesis testing. **Padj < 0.001, ***Padj < 0.0001, ****Padj < 0.00001. (G) Western blot for the approximately 37 kDa SMN protein and approximately 117 kDa vinculin protein. Each patient is labeled on the top. (H) Quantification of the blot in G. Each data point represents the normalized SMN/vinculin value for each sample (n = 6 controls, n = 6 SMA samples). The mean of the group was compared with a 2-sided Student’s t test. NS, not significant (P = 0.8). (I) Correlation between the TPM values of the full-length (FL) SMN transcripts in each sample in E and F compared to the normalized protein quantification in H (n = 6 controls in black, n = 6 SMA in pink). Pearson’s R2 value and it’s associated P value are reported. The solid line represents the simple linear regression and the dashed lines represent the 95% confidence internal.
Figure 2
Figure 2. SMA type II paravertebral muscle after treatment is characterized by abnormal myofiber size distribution.
(A) H&E staining of muscle tissues from control and SMA patient samples. Representative images (3–5 images were acquired per sample) are shown for each group. Original magnification, ×200. Scale bars: 50 μm. (B) Histogram of the fiber area. The frequency distribution represents the percentage of all fibers per group that falls within the bin area. Fiber area was measured in arbitrary units. n = 6 controls and n = 5 SMA, with multiple fiber measurements per sample, taken from 1 representative image per sample. (C) The range (highest to lowest) of fiber area measurements per patient. Each data point represents 1 image of 1 patient sample (n = 6 controls, n = 5 SMA). Group averages were compared using a 2-sided Student’s t test. *P < 0.05. (D) The maximum fiber area measured for each patient from 1 representative image. Each data point represents 1 patient (n = 6 controls and n = 5 SMA). Group averages were compared using a 2-sided Student’s t test. *P < 0.05. (E) Representative cropped and enlarged myofibers from images showing myofibers with multiple internalized nuclei from the 2 patients where we observed this phenomenon. Internalized nuclei are designated by white arrows. (F and G) Quantification of single centralized (F) or multiple internalized nuclei (G) in SMA (n = 5) and controls (n = 6). Each data point represents the percentage of such nuclei in the fibers counted in 1 image from each patient sample. Group averages were compared using a 2-sided Student’s t test. NS, not significant (P > 0.05).
Figure 3
Figure 3. Transcriptional characterization of treated SMA and control muscle samples.
(A) Diagram of the RNA-seq library generation process used for the samples. (B) Principal component analysis (PCA) plot obtained using the top 2,000 variably expressed genes in each muscle RNA-seq library. Each data point represents the cDNA library of a single sample. The variance explained for each principal component (PC) is plotted on the axes. (C) Heatmap of the genes that are differentially expressed (DEGs) between SMA and control samples. Each column represents the DEGs from 1 sample, which have been hierarchically clustered. Diagnosis and sex are designated by the colored bars on the top. Transcripts on the heatmap are presented as z-scored transcripts per million (TPM) counts. DEGs include 166 downregulated and 396 upregulated genes comparing SMA- versus control-derived samples using DESeq2 using the parameters log2(fold change) > 0.5, Padj < 0.05, and standard error estimate for the log(fold change) standard error (lfcSE) of 1. Genes, fold change, and the Padj values for all DEGs can be found in Supplemental Table 1. (D) GO terms associated with the upregulated and downregulated genes. The terms are plotted according to their Padj value of enrichment. (E) TPM of 3 well-known SMA modifier genes, NCALD, NAIP, and PLS3. Each data point represents a single patient. The means of each group were compared with a 2-sided Student’s t test. *P < 0.05. NS, not significant (P > 0.05).
Figure 4
Figure 4. SMA type II muscle shows histological and transcriptional hallmarks of denervation.
(A) Schematic of how the denervation score was calculated for each sample, using the expression (in TPM) of the highlighted genes. MF, myofiber. (B) The denervation score for each sample represented on a number line. (C) H&E images of selected control and SMA samples. (D) Cytochrome oxidase activity staining. Fibers with dark brown staining represent areas with high enzymatic activity, generally associated with type I fibers. Example fibers are highlighted by black arrows for those with dark staining (type I) and light staining (type II). (E) Sirius red–stained images of control and SMA muscle samples. Red staining occurs predominantly on areas with large amounts of collagen I, i.e., fibrotic areas. Scale bars: 100 μm (CE).
Figure 5
Figure 5. Mitochondrial electron transport chain (ETC) complex expression and mtDNA copy number are altered in type II SMA muscle.
(A) Schematic of how the mito-score was calculated for each sample, using the expression (in TPM) of the highlighted oxidative phosphorylation (OXPHOS) genes. (B) The mito-score for each sample represented on a number line. (C) Western blots of control (n = 6) and SMA (n = 6) muscle samples incubated with the anti-OXPHOS antibody cocktail and vinculin as the housekeeping gene. The dotted line represents the 2 individual Western blots, imaged at the same time. Each band represents an ETC complex, which is labeled. Complex IV was not detected in either blot. Complex I was not detected in the blot on the right. The proteins designating each complex are as follows: complex I, NDUFB8; complex II, SDHB; complex III, UQCRC2; complex IV, MTCO1; and complex V, ATP5A. (DG) Quantification of the blots in C. Each data point represents the normalized complex/vinculin value for each sample (n = 6 controls, n = 8 SMA samples). (D) Complex I, where n = 3 control and n = 4 SMA samples. (E) Complex II. (F) Complex III. (G) Complex V. The means of each group were compared with a 2-sided Student’s t test. *P < 0.05. NS, not significant (P > 0.05). (H) Relative quantification (qPCR) of the mtDNA copy number normalized to the numbers of gDNA copies using the β2-microglobulin gene in control (n = 5) and SMA (n = 8) paravertebral muscle gDNA samples. Each data point represents 1 sample. The means of the groups were compared with a 2-sided Student’s t test. *P < 0.01. (I) Same as in H, but from gDNA derived from the PBMCs of type III SMA patients. Each data point represents 1 sample (n = 22 controls, n = 14 SMA). Groups were compared with a 2-sided Student’s t test. ***P < 0.001.

Similar articles

Cited by

References

    1. Wirth B, et al. Twenty-five years of spinal muscular atrophy research: from phenotype to genotype to therapy, and what comes next. Annu Rev Genomics Hum Genet. 2020;21(1):231–261. doi: 10.1146/annurev-genom-102319-103602. - DOI - PubMed
    1. Mercuri E, et al. Diagnosis and management of spinal muscular atrophy: part 1: recommendations for diagnosis, rehabilitation, orthopedic and nutritional care. Neuromuscul Disord. 2022;28(2):103–115. doi: 10.1016/j.nmd.2017.11.005. - DOI - PubMed
    1. Singh RN, et al. Diverse role of survival motor neuron protein. Biochim Biophys Acta Gene Regul Mech. 2017;1860(3):299–315. doi: 10.1016/j.bbagrm.2016.12.008. - DOI - PMC - PubMed
    1. Chong LC, et al. Drug discovery of Spinal Muscular Atrophy (SMA) from the computational perspective: a comprehensive review. Int J Mol Sci. 2021;22(16):8962. doi: 10.3390/ijms22168962. - DOI - PMC - PubMed
    1. Prior TW, et al. A positive modifier of spinal muscular atrophy in the SMN2 gene. Am J Hum Genet. 2009;85(3):408–413. doi: 10.1016/j.ajhg.2009.08.002. - DOI - PMC - PubMed

Substances