Review
. 2024 Sep 12;20(9):e1012418.
doi: 10.1371/journal.ppat.1012418. eCollection 2024 Sep.

Turning the needle into the haystack: Culture-independent amplification of complex microbial genomes directly from their native environment

Affiliations
Review

Turning the needle into the haystack: Culture-independent amplification of complex microbial genomes directly from their native environment

Olivia A Pilling et al. PLoS Pathog. .

Abstract

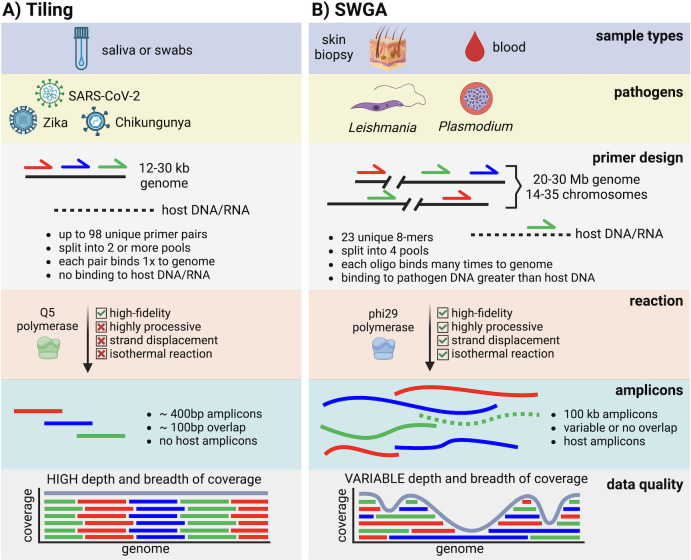
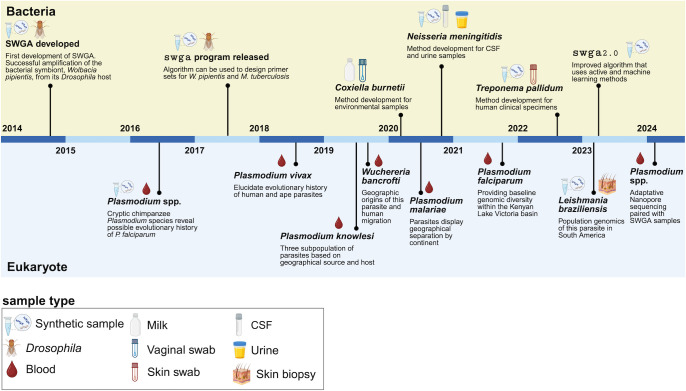
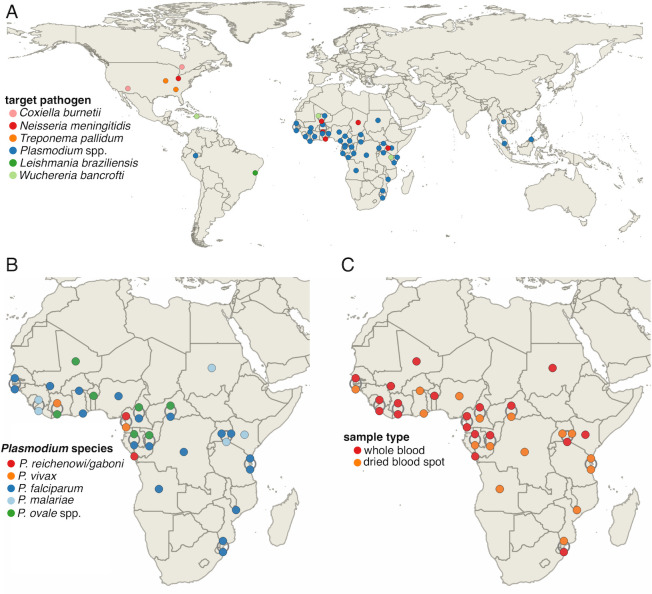
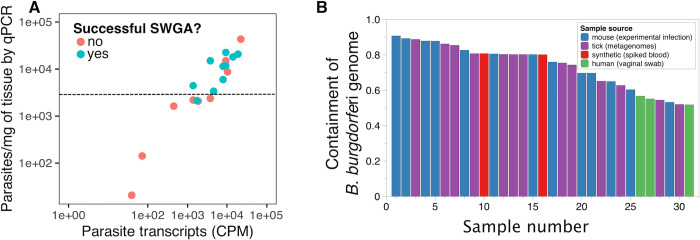
High-throughput sequencing (HTS) has revolutionized microbiology, but many microbes exist at low abundance in their natural environment and/or are difficult, if not impossible, to culture in the laboratory. This makes it challenging to use HTS to study the genomes of many important microbes and pathogens. In this review, we discuss the development and application of selective whole genome amplification (SWGA) to allow whole or partial genomes to be sequenced for low abundance microbes directly from complex biological samples. We highlight ways in which genomic data generated by SWGA have been used to elucidate the population dynamics of important human pathogens and monitor development of antimicrobial resistance and the emergence of potential outbreaks. We also describe the limitations of this method and propose some potential innovations that could be used to improve the quality of SWGA and lower the barriers to using this method across a wider range of infectious pathogens.


Conflict of interest statement

The authors have declared that no competing interests exist.

Figures

Fig 1
Fig 1. SWGA unlocks population genomics for nonviral pathogens.
Schematic comparison of (A) tiling-based methods for viral genomic surveillance studies and (B) SWGA for bacterial and eukaryotic pathogens. Comparisons are made for sample type, pathogens targeted, primer design, PCR reactions, amplicons produced, and the quality of data produced by these 2 approaches. Created with Biorender.com.
Fig 2
Fig 2. SWGA development over the past decade.
Schematic showing major milestones in the development and application of SWGA across bacterial (top; yellow) and eukaryotic (bottom; blue) microbes in multiple sample types. Citations for milestones on top of timeline, from left to right are [,,–30,35], and for bottom are [32,34,37,51,52,56,75,94]. Created with Biorender.com.
Fig 3
Fig 3. Geographic distribution of genome sequences derived from samples subjected to SWGA from the literature.
(A) Geographic distribution colored by the pathogen targeted for study; (B) by Plasmodium species targeted; and (C) by sample type used for SWGA. Each point represents one or more samples from the same study for 21 or 14 published manuscripts (panels A and B/C, respectively). Data points are linked by curved lines if the points have the same GPS coordinates. Maps were created in QGIS software [95].
Fig 4
Fig 4. Overcoming limitations of low microbial load for SWGA.
(A) Quantifying microbial load to prioritize samples for SWGA. Absolute quantification by qPCR (y-axis) of L. braziliensis from patient skin biopsies compared to relative quantification by RNA-seq (x-axis), from Pilling and colleagues [37]. Each point represents a single patient sample. Points are colored based on whether genomes were successful generated by SWGA for each patient. Dotted line indicates a potential qPCR quantification cutoff that could be used for prioritizing samples for SWGA. Below this threshold, SWGA failed for 6/7 samples but succeeded for 9/12 above. (B) Results from searching approximately 500,000 metagenomes from SRA using the B. burgdorferi strain B31 reference genome with Sourmash Branchwater software [65]. Each bar represents a sample colored by source.

Similar articles

References

    1. Tyson GW, Chapman J, Hugenholtz P, Allen EE, Ram RJ, Richardson PM, et al.. Community structure and metabolism through reconstruction of microbial genomes from the environment. Nature. 2004;428:37–43. doi: 10.1038/nature02340 - DOI - PubMed
    1. Li D, Luo R, Liu C-M, Leung C-M, Ting H-F, Sadakane K, et al.. MEGAHIT v1.0: A fast and scalable metagenome assembler driven by advanced methodologies and community practices. Methods. 2016;102:3–11. doi: 10.1016/j.ymeth.2016.02.020 - DOI - PubMed
    1. Eren AM, Kiefl E, Shaiber A, Veseli I, Miller SE, Schechter MS, et al.. Community-led, integrated, reproducible multi-omics with anvi’o. Nat Microbiol. 2021;6:3–6. doi: 10.1038/s41564-020-00834-3 - DOI - PMC - PubMed
    1. Eren AM, Esen ÖC, Quince C, Vineis JH, Morrison HG, Sogin ML, et al.. Anvi’o: an advanced analysis and visualization platform for ‘omics data. PeerJ. 2015;3:e1319. doi: 10.7717/peerj.1319 - DOI - PMC - PubMed
    1. Alneberg J, Bjarnason BS, de Bruijn I, Schirmer M, Quick J, Ijaz UZ, et al.. Binning metagenomic contigs by coverage and composition. Nat Methods. 2014;11:1144–1146. doi: 10.1038/nmeth.3103 - DOI - PubMed

MeSH terms

LinkOut - more resources