. 2024 Sep 12;19(9):e0308797.
doi: 10.1371/journal.pone.0308797. eCollection 2024.

Peak amplitude of the normalized power spectrum of the electromyogram of the uterus in the low frequency band is an effective predictor of premature birth

Affiliations

Peak amplitude of the normalized power spectrum of the electromyogram of the uterus in the low frequency band is an effective predictor of premature birth

Žiga Pirnar et al. PLoS One. .

Abstract

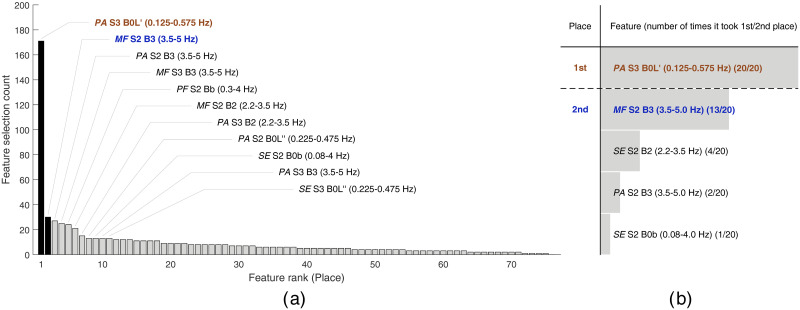
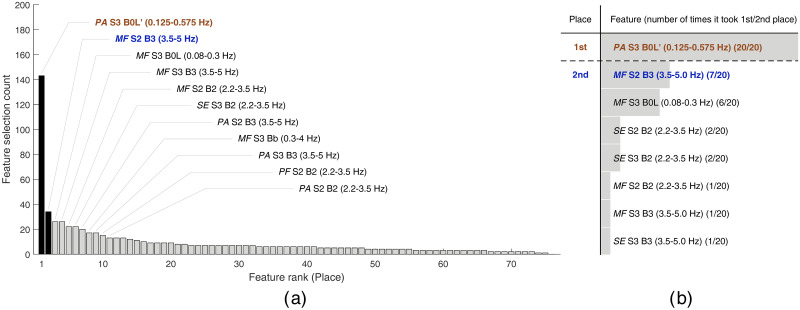
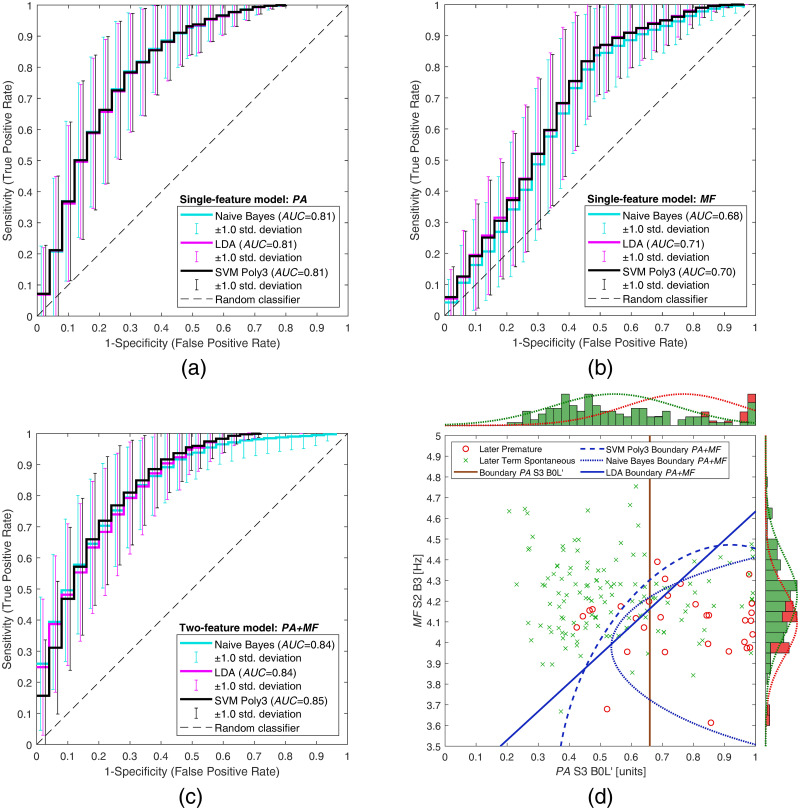
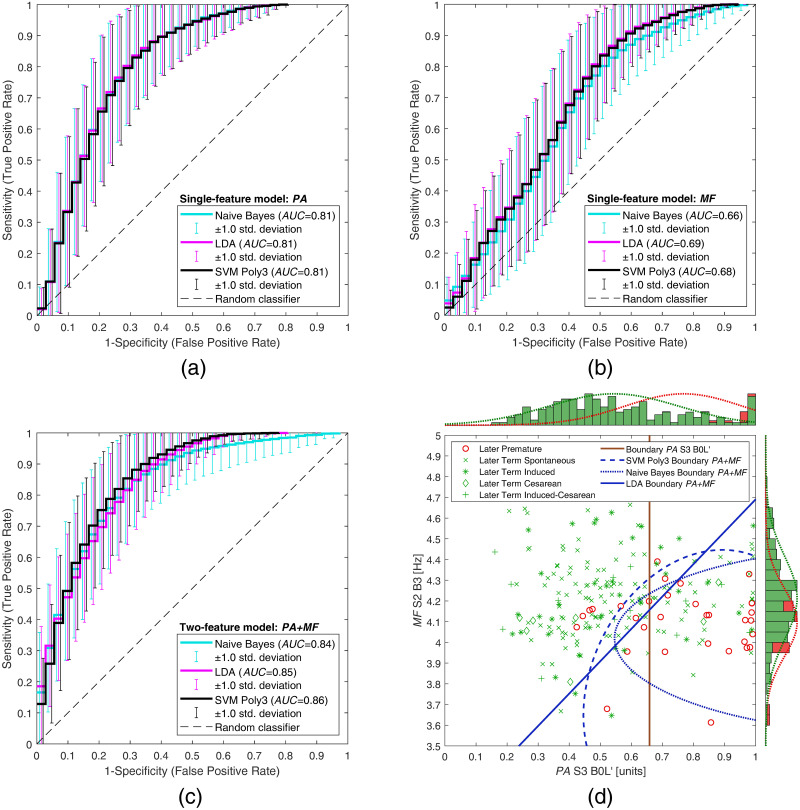
The current trends in the development of methods for non-invasive prediction of premature birth based on the electromyogram of the uterus, i.e., electrohysterogram (EHG), suggest an ever-increasing use of large number of features, complex models, and deep learning approaches. These "black-box" approaches rarely provide insights into the underlying physiological mechanisms and are not easily explainable, which may prevent their use in clinical practice. Alternatively, simple methods using meaningful features, preferably using a single feature (biomarker), are highly desirable for assessing the danger of premature birth. To identify suitable biomarker candidates, we performed feature selection using the stabilized sequential-forward feature-selection method employing learning and validation sets, and using multiple standard classifiers and multiple sets of the most widely used features derived from EHG signals. The most promising single feature to classify between premature EHG records and EHG records of all other term delivery modes evaluated on the test sets appears to be Peak Amplitude of the normalized power spectrum (PA) of the EHG signal in the low frequency band (0.125-0.575 Hz) which closely matches the known Fast Wave Low (FWL) frequency band. For classification of EHG records of the publicly available TPEHG DB, TPEHGT DS, and ICEHG DS databases, using the Partition-Synthesis evaluation technique, the proposed single feature, PA, achieved Classification Accuracy (CA) of 76.5% (AUC of 0.81). In combination with the second most promising feature, Median Frequency (MF) of the power spectrum in the frequency band above 1.0 Hz, which relates to the maternal resting heart rate, CA increased to 78.0% (AUC of 0.86). The developed method in this study for the prediction of premature birth outperforms single-feature and many multi-feature methods based on the EHG, and existing non-invasive chemical and molecular biomarkers. The developed method is fully automatic, simple, and the two proposed features are explainable.


Conflict of interest statement

The authors have declared that no competing interests exist.

Figures

Fig 1
Fig 1. The results of feature selection using later premature (group PL) and later term spontaneous (group TL) records.
The left histogram (a) shows the counts of feature occurrences and the optimal set of features yielded by the feature selection procedure if using feature set 1 and LDA classifier. Features are ranked according to the feature occurrence count. The features from the optimal set are annotated, and the bars for the top two features (i.e. the features taking the first and second place) are shown in black. The right histogram (b) shows the total number of times that a feature took first place (above the dashed separator line) and second place (below the dashed separator line) out of 20 runs (i.e. using five classifiers and four feature sets) of the feature selection procedure.
Fig 2
Fig 2. The results of feature selection using later premature (group PL) and later term spontaneous, induced, cesarean, and induced-cesarean (groups TL, IL, CL, and ICL) records.
The left histogram (a) shows the counts of feature occurrences and the optimal set of features yielded by the feature selection procedure if using feature set 1 and LDA classifier. Features are ranked according to the feature occurrence count. The features from the optimal set are annotated, and the bars for the top two features (i.e. the features taking the first and second place) are shown in black. The right histogram (b) shows the total number of times that a feature took first place (above the dashed separator line) and second place (below the dashed separator line) out of 20 runs (i.e. using five classifiers and four feature sets) of the feature selection procedure.
Fig 3
Fig 3. Average ROC curves and decision boundaries for classification between later premature records (group PL) and later term spontaneous records (group TL).
The average ROC curves are shown for classification (a) using only feature PA, (b) using only feature MF, and (c) using two features PA+MF, for the Naive Bayes (shown in cyan), LDA (shown in magenta), and SVM Poly3 (shown in black) classifiers. The error bars for each ROC curve show the standard deviations at different false positive rates. In the scatter plot (d), the average classification decision boundaries are shown for the single-feature model (PA), averaged across all classifiers (vertical brown boundary), and for two-feature models (PA+MF) using Naive Bayes (dotted blue boundary), LDA (solid blue boundary), and SVM Poly3 (dashed blue boundary) classifiers. The histograms on the top and right sides of the scatter plot show the normalized distribution of the feature values for premature (in red) and term records (in green). The red and green dotted lines on the histograms show the fit to the normal distribution according to the feature values for premature and term records, respectively.
Fig 4
Fig 4. Average ROC curves and decision boundaries for classification between later premature records (group PL) and all later term records (groups TL, IL, CL, ICL).
The average ROC curves are shown for classification (a) using only feature PA, (b) using only feature MF, and (c) using two features PA+MF, for the Naive Bayes (shown in cyan), LDA (shown in magenta), and SVM Poly3 (shown in black) classifiers. In the scatter plot (d), the average classification decision boundaries are shown for the single-feature model (PA), averaged across all classifiers (vertical brown boundary), and for two-feature models (PA+MF) using Naive Bayes (dotted blue boundary), LDA (solid blue boundary), and SVM Poly3 (dashed blue boundary) classifiers. The histograms on the top and right sides of the scatter plot show the normalized distribution of the feature values for premature (in red) and term records (in green). The red and green dotted lines on the histograms show the fit to the normal distribution according to the feature values for premature and term records, respectively.

Similar articles

References

    1. World Health Organization. Born Too Soon—The Global Action Report on Preterm Birth. Geneva: World Health Organization; 2012. Available from: https://www.who.int/publications/i/item/9789241503433.
    1. Perin J, Mulick A, Yeung D, Villavicencio F, Lopez G, Strong KL, et al.. Global, regional, and national causes of under-5 mortality in 2000-19: an updated systematic analysis with implications for the Sustainable Development Goals. Lancet Child Adolesc Health. 2022;6:106–115. doi: 10.1016/S2352-4642(21)00311-4 - DOI - PMC - PubMed
    1. Goldenberg RL, Culhane JF, Iams JD, Romero R. Epidemiology and causes of preterm birth. Lancet. 2008;371(9606):75–84. doi: 10.1016/S0140-6736(08)60074-4 - DOI - PMC - PubMed
    1. Kenny LC, Myers JE, editors. Obstetrics by ten teachers. 20th ed. Boca Raton, Florida: CRC Press; 2017. 10.1201/9781315382401 - DOI
    1. Maner WL, Garfield RE, Maul H, Olson G, Saade G. Predicting term and preterm delivery with transabdominal uterine electromyography. Obstet Gynecol. 2003;101(6):1254–1260. doi: 10.1016/S0029-7844(03)00341-7 - DOI - PubMed

LinkOut - more resources