. 2024 Sep 12;22(9):e3002809.
doi: 10.1371/journal.pbio.3002809. eCollection 2024 Sep.

Alveolin proteins in the Toxoplasma inner membrane complex form a highly interconnected structure that maintains parasite shape and replication

Affiliations

Alveolin proteins in the Toxoplasma inner membrane complex form a highly interconnected structure that maintains parasite shape and replication

Peter S Back et al. PLoS Biol. .

Abstract

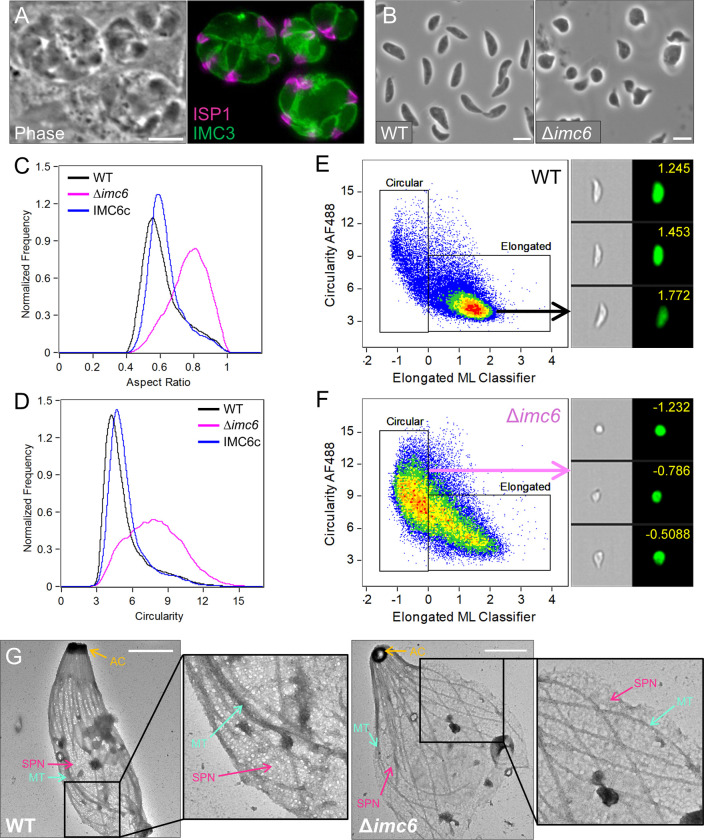
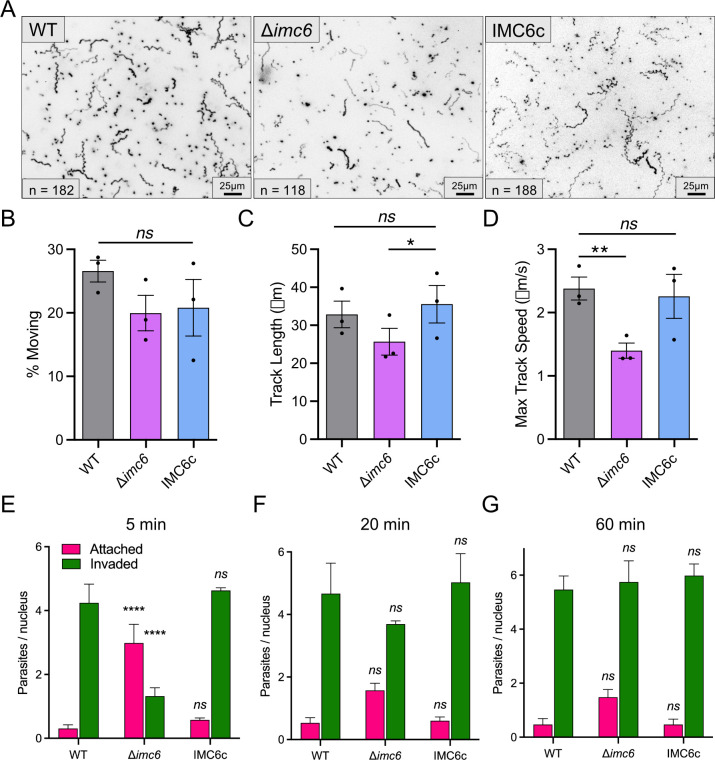
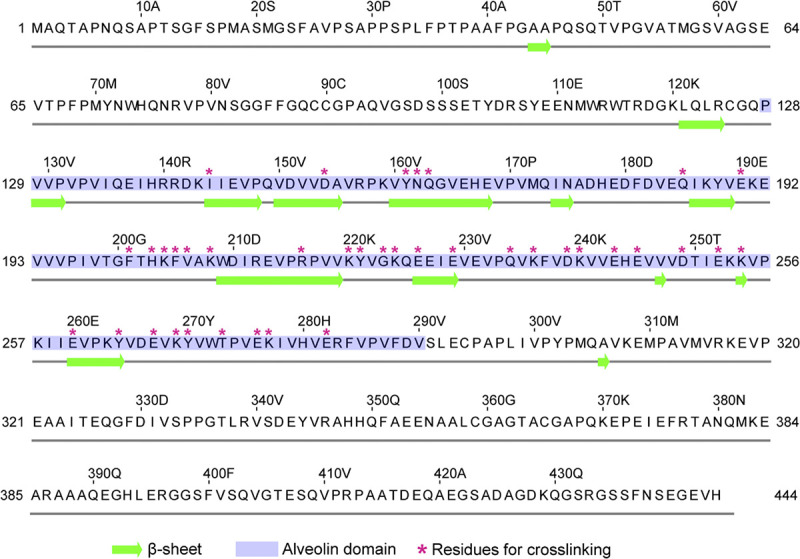
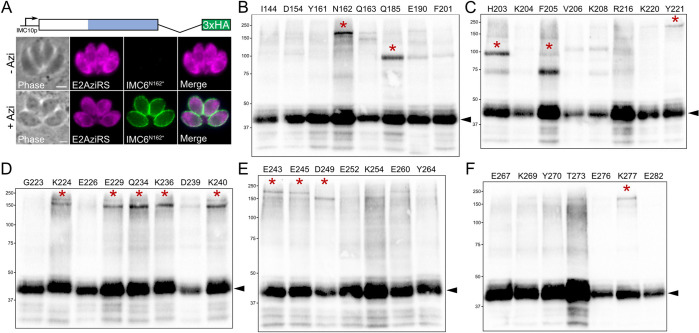
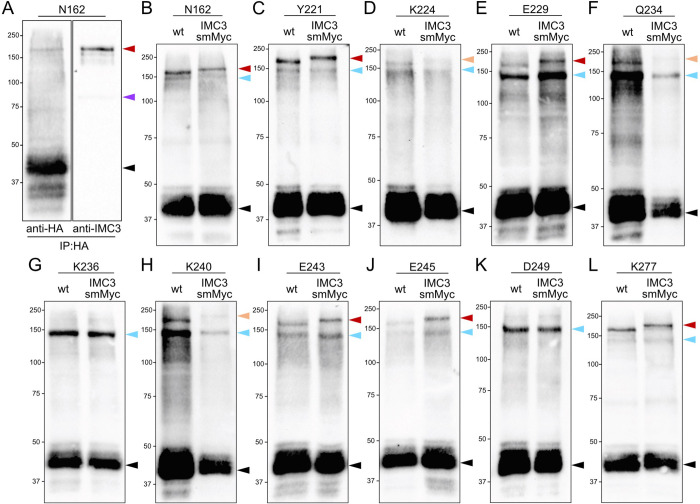
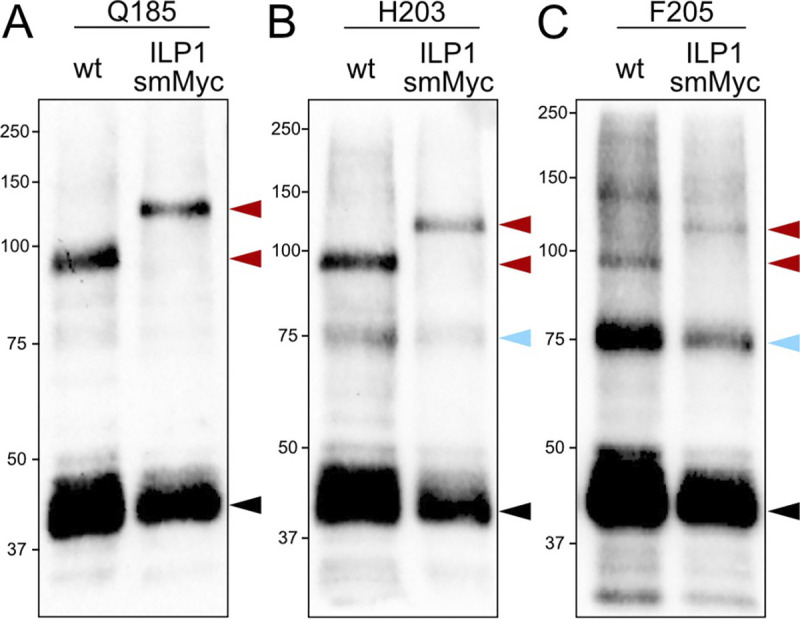
Apicomplexan parasites possess several specialized structures to invade their host cells and replicate successfully. One of these is the inner membrane complex (IMC), a peripheral membrane-cytoskeletal system underneath the plasma membrane. It is composed of a series of flattened, membrane-bound vesicles and a cytoskeletal subpellicular network (SPN) comprised of intermediate filament-like proteins called alveolins. While the alveolin proteins are conserved throughout the Apicomplexa and the broader Alveolata, their precise functions and interactions remain poorly understood. Here, we describe the function of one of these alveolin proteins in Toxoplasma, IMC6. Disruption of IMC6 resulted in striking morphological defects that led to aberrant invasion and replication but surprisingly minor effects on motility. Deletion analyses revealed that the alveolin domain alone is largely sufficient to restore localization and partially sufficient for function. As this highlights the importance of the IMC6 alveolin domain, we implemented unnatural amino acid photoreactive crosslinking to the alveolin domain and identified multiple binding interfaces between IMC6 and 2 other cytoskeletal IMC proteins-IMC3 and ILP1. This provides direct evidence of protein-protein interactions in the alveolin domain and supports the long-held hypothesis that the alveolin domain is responsible for filament formation. Collectively, our study features the conserved alveolin proteins as critical components that maintain the parasite's structural integrity and highlights the alveolin domain as a key mediator of SPN architecture.


Conflict of interest statement

The authors have declared that no competing interests exist.

Figures

Fig 1
Fig 1. Disrupting IMC6 causes severe fitness and virulence defects.
(A) IFA of WT parasites showing proper IMC6 localization in mature and budding parasites. (B) IFA of Δimc6 parasites showing absence of IMC6. (C) PCR verification of the genomic loci from WT (RHΔhxgprt) and Δimc6 parasites. Diagram illustrates primers used to amplify the IMC6 coding sequence (blue arrows) and the site of recombination for the knockout locus (magenta arrows). (D) Diagram of the full-length complementation construct, which includes the endogenous promoter and a V5 epitope tag. Full-length protein is 444 amino acids, with aa128-290 encompassing the alveolin domain. (E) IFA of IMC6c parasites showing restored localization of IMC6 (anti-V5). (F) Western blot of whole cell lysates depicting the absence (Δimc6) and rescue (IMC6c) of IMC6 expression. The difference in migration between WT and IMC6c is due to the V5 epitope tag in the complemented version. ROP13 was used as a loading control. (G) Quantification of plaque areas, where each point represents a biological replicate with 30–40 plaques measured per replicate. Data are plotted as the mean ± SD, and significance was determined using two-way ANOVA. ****: p < 0.0001. (H) Quantification of plaque efficiency, measured by counting the number of plaques relative to the total number of parasites added. Data are plotted as the mean ± SD, and significance was determined using multiple two-tailed t tests. ****: p < 0.0001. (I) Survival curve of mice (n = 4) injected with the indicated parasite strain. All scale bars are 2 μm. The raw data underlying this figure can be found in S1 Data. IFA, immunofluorescence assay; KO, knockout; WT, wild-type.
Fig 2
Fig 2. Δimc6 parasites are extremely misshapen.
(A) Phase contrast and IFA of a representative field of Δimc6 vacuoles. ISP1 stains the apical end, while IMC3 stains the body portion of the IMC. Scale bar is 5 μm. (B) Phase contrast field of WT and Δimc6 extracellular parasites. Scale bar is 5 μm. (C) ImageStream analysis of the aspect ratios for each population. Greater aspect ratios indicate rounder objects. Median aspect ratio for WT is 0.59, Δimc6 is 0.78, and IMC6c is 0.61. (D) ImageStream analysis using the circularity parameter, where greater values indicate rounder objects. Median circularity value for WT is 4.72, Δimc6 is 7.78, and IMC6c is 5.05. The raw data underlying these medians can be found in 10.5281/zenodo.13333981. (E, F) Bivariate plots of the Circularity feature vs. the Elongated ML classifier on the WT (E) and Δimc6 (F) samples. The WT population contains 85.3% elongated and 13.3% circular objects. The Δimc6 population contains 46.6% elongated and 46.5% circular objects. This population shift is highlighted by the density plots. The assigned values indicate confidence given by the Elongated ML classifier, where higher values indicate greater confidence of elongatedness. (G) TEM of detergent-extracted and negatively stained parasites. Insets are zoomed in 3-fold. Scale bar is 1 μm. AC, apical complex; IFA, immunofluorescence assay; IMC, inner membrane complex; ISP1, IMC sub-compartment protein 1; ML, Machine Learning; MT, microtubules; SPN, subpellicular network; TEM, transmission electron microscopy; WT, wild-type.
Fig 3
Fig 3. Δimc6 parasites are motile but invade less efficiently.
(A) Representative maximum intensity projections showing trajectories of parasites in Matrigel, imaged over 80 seconds. Greyscale images were inverted to better visualize trajectories. n indicates the number of tracks quantified for the technical replicates shown. Scale bars are 25 μm. (B-D) Quantifications of percent moving, track length, and maximum track speed. All trajectory data were acquired from 3 biological replicates, each consisting of 3 technical replicates. Data are plotted as the mean ± SEM, and significance was determined using two-way ANOVA. *: p = 0.0479. **: p = 0.0340. (E-G) Red-green invasion assays with 5-minute (E), 20-minute (F), and 60-minute (G) invasion permissive conditions. Magenta represents extracellular/attached parasites, and green represents invaded parasites. Triplicate experiments were performed by counting the number of parasites per host nucleus. Significance was calculated using two-way ANOVA. ****: p < 0.0001. The raw data underlying this figure can be found in S1 Data.
Fig 4
Fig 4. IMC6 is important for proper endodyogeny.
(A, B) Replication assays conducted at 24 (A) and 32 (B) hpi. Each category represents the number of parasites per vacuole. Triplicate experiments were performed by quantifying >300 total vacuoles across at least 15 different fields per replicate. Data are plotted as the mean ± SD, and significance was calculated using two-way ANOVA. (A) shows significance for 4 and 8 parasites per vacuole. (B) shows significance for 4, 8, and 16 parasites per vacuole. **: p = 0.0018. ****: p < 0.0001. (C-H) Representative IFAs depicting various replication defects, including asynchrony (C), multi-daughters (D), disorganization (E), breaks in IMC structure (F), and incomplete separation in mature (G) and budding (H) parasites. All IFAs were conducted about 30 hpi. All scale bars are 2 μm. (I) Quantification of abnormal vacuoles as defined by the presence of any one of the replication defects. Triplicate experiments were performed with >200 total vacuoles counted across at least 15 different fields per replicate. Data are plotted as the mean ± SD, and significance was calculated using two-tailed t tests. ****: p < 0.0001. (J) Phase contrast and IFA of a field of extracellular Δimc6 parasites. White arrows highlight incompletely separated parasites. Scale bar is 5 μm. (K) Quantification of the incomplete separation phenotype in extracellular parasites. Triplicates performed by counting >300 individual parasites across at least 15 different fields per replicate. Data are plotted as the mean ± SD, and significance was calculated using two-tailed t tests. ****: p < 0.0001. The raw data underlying this figure can be found in S1 Data. hpi, hours post infection; IFA, immunofluorescence assay; IMC, inner membrane complex.
Fig 5
Fig 5. Domain analysis of IMC6 correlates parasite form and function.
(A) Diagram and IFA of IMC62-290, showing proper localization. (B) Diagram and IFA of IMC6128-290, showing partial IMC localization with additional cytoplasmic staining. (C) Diagram and IFA of IMC6128-444, showing partial IMC localization with additional cytoplasmic staining. (D) Quantification of plaque areas for each deletion construct. The data for WT, Δimc6, and IMC6c were collected in the same experiment as those from Fig 1G and are shown here again to facilitate a direct comparison. Triplicates were performed by measuring 30–40 plaques per replicate, data are plotted as the mean ± SD, and significance was calculated using two-way ANOVA. ****: p < 0.0001. (E) Quantification of plaque efficiency. The data for WT, Δimc6, and IMC6c were collected in the same experiment as those from Fig 1H and are shown here again to facilitate a direct comparison. Data are plotted as the mean ± SD, and significance was calculated using two-tailed t tests. ****: p < 0.0001. (F, G) ImageStream analysis of each population, showing aspect ratio (F) and circularity (G). The data for WT, Δimc6, and IMC6c were collected in the same experiment as those from Fig 2C and 2D and are shown here again for ease of comparison. Median aspect ratio for IMC62-290 is 0.68, IMC6128-290 is 0.73, and IMC6128-444 is 0.73. Median circularity value for IMC62-290 is 6.04, IMC6128-290 is 6.63, and IMC6128-444 is 6.71. All scale bars are 2 μm. The raw data underlying these medians can be found in 10.5281/zenodo.13333981, and the raw data underlying the graphs can be found in S1 Data. IFA, immunofluorescence assay; IMC, inner membrane complex; WT, wild-type.
Fig 6
Fig 6. Diagram of the IMC6 sequence and predicted secondary structure.
β-sheets are shown in green, the alveolin domain is highlighted in blue, and magenta stars represent residues chosen for crosslinking. Short β-sheets of 1–2 amino acids are unlikely to be real but remain included in the diagram as predicted by JPred4.
Fig 7
Fig 7. The IMC6 alveolin domain is a major region of protein–protein interactions.
(A) The complementation construct used for photoreactive crosslinking consists of the IMC62-290 sequence, driven by the IMC10 promoter with a 3xHA epitope tag. IFA of parasites expressing the E2AziRS3xTy (tRNA synthetase), the Azi-specific tandem tRNA cassettes, and the IMC62-290-3xHA construct with N162 mutated to an amber stop codon. Without Azi added to the system, the N162* mutation results in premature stop in translation and no protein expression. Upon Azi addition, Azi is incorporated into the amber stop codon and results in proper expression. Scale bar is 2 μm. (B-F) Western blot of whole cell lysates following Azi incorporation and UV treatment. Black arrowheads represent uncrosslinked IMC62-290-3xHA that migrates at approximately 45 kDa. Red stars represent crosslinked upshifts that were chosen for further investigation (see S1 Table). All blots were detected with anti-HA. Azi, p-azidophenylalanine; HA, hemagglutinin; IFA, immunofluorescence assay.
Fig 8
Fig 8. IMC3 binds the IMC6 alveolin domain at multiple sites.
(A) Western blot of IMC6-N162* denaturing IP following Azi incorporation and UV treatment. Black arrowhead represents uncrosslinked IMC62-290-3xHA (about 45 kDa). Purple arrowhead represents uncrosslinked IMC3 nonspecifically captured in the IP (about 85 kDa). Red arrowhead represents the crosslink-of-interest, seen in both the HA and IMC3 blots (about 175 kDa). (B-L) Western blot of whole cell lysates following Azi incorporation and UV treatment. For each residue, both WT and IMC3-smMyc strains were subjected to photoreactive crosslinking and analyzed on the same blot for direct comparison. Black arrowheads represent uncrosslinked IMC62-290-3xHA (about 45 kDa). Blue arrowheads indicate the crosslinked product at about 140 kDa, which is not shifted further by the IMC3-smMyc tag. Red arrowheads represent the crosslinks-of-interest, which migrate even higher in the IMC3-smMyc sample (about 175 kDa in the WT vs. 200 kDa in the IMC3-smMyc). Orange arrowheads represent faint crosslinks-of-interest with similarly higher migration in the IMC3-smMyc sample. Every blot was detected with anti-HA. Azi, p-azidophenylalanine; HA, hemagglutinin; IP, immunoprecipitation; smMyc, spaghetti monster Myc; WT, wild-type.
Fig 9
Fig 9. ILP1 binds IMC6 in the alveolin domain.
(A-C) Western blot of whole cell lysates of the indicated residues following Azi incorporation and UV treatment. For each residue, both wild-type and ILP1-smMyc strains were subjected to photoreactive crosslinking and analyzed on the same blot for direct comparison. Black arrowheads represent uncrosslinked IMC62-290-3xHA (about 45 kDa). Blue arrowheads indicate crosslinked products at about 75 kDa, which is not shifted further by the ILP1-smMyc tag. Red arrowheads represent the crosslinks-of-interest, which migrate even higher in the ILP1-smMyc sample (approximately 95 kDa vs. approximately 120 kDa). Every blot was detected with anti-HA. Azi, p-azidophenylalanine; HA, hemagglutinin; ILP1, IMC localizing protein 1; smMyc, spaghetti monster Myc.
Fig 10
Fig 10. Proposed model of alveolin interactions.
(A) The IMC6 alveolin domain mediates binding to IMC3 and ILP1. Blue and red shades represent putative interactions with IMC3 and ILP1, although the precise binding interfaces on these interactors are unknown. Asterisks indicate residues in the IMC6 alveolin domain that are verified to interact with IMC3 or ILP1. The ILP1 coiled coil domain was previously shown to interact with IMC6 and IMC3 [22]. (B) Proposed diagram of a lattice of alveolin filaments made by IMC6, IMC3, and IMC10. IMC10 is included as a likely interactor due to its daughter-enriched localization. ILP1 is depicted as a reinforcing connection between IMC6 and IMC3, though it is possible that ILP1 is part of the major filament instead.

Similar articles

References

    1. Gould SB, Tham W-H, Cowman AF, McFadden GI, Waller RF. Alveolins, a New Family of Cortical Proteins that Define the Protist Infrakingdom Alveolata. Mol Biol Evol. 2008;25:1219–1230. doi: 10.1093/molbev/msn070 - DOI - PubMed
    1. Levine ND, Corliss JO, Cox FEG, Deroux G, Grain J, Honigberg BM, et al.. A Newly Revised Classification of the Protozoa*. J Protozool. 1980;27:37–58. doi: 10.1111/j.1550-7408.1980.tb04228.x - DOI - PubMed
    1. Mackintosh CL, Beeson JG, Marsh K. Clinical features and pathogenesis of severe malaria. Trends Parasitol. 2004;20:597–603. doi: 10.1016/j.pt.2004.09.006 - DOI - PubMed
    1. Hill DE, Chirukandoth S, Dubey JP. Biology and epidemiology of Toxoplasma gondii in man and animals. Anim Health Res Rev. 2005;6:41–61. doi: 10.1079/ahr2005100 - DOI - PubMed
    1. Bouzid M, Hunter PR, Chalmers RM, Tyler KM. Cryptosporidium Pathogenicity and Virulence. Clin Microbiol Rev. 2013;26:115–134. doi: 10.1128/CMR.00076-12 - DOI - PMC - PubMed

Substances

LinkOut - more resources