. 2024 Oct:76:103342.
doi: 10.1016/j.redox.2024.103342. Epub 2024 Sep 5.

Lipocalin-2 aggravates blood-brain barrier dysfunction after intravenous thrombolysis by promoting endothelial cell ferroptosis via regulating the HMGB1/Nrf2/HO-1 pathway

Affiliations

Lipocalin-2 aggravates blood-brain barrier dysfunction after intravenous thrombolysis by promoting endothelial cell ferroptosis via regulating the HMGB1/Nrf2/HO-1 pathway

Jie Liu et al. Redox Biol. 2024 Oct.

Abstract

Background: Disruption of the blood-brain barrier (BBB) is a major contributor to hemorrhagic transformation (HT) in patients with acute ischemic stroke (AIS) following intravenous thrombolysis (IVT). However, the clinical therapies aimed at BBB protection after IVT remain limited.

Methods: One hundred patients with AIS who underwent IVT were enrolled (42 with HT and 58 without HT 24 h after IVT). Based on the cytokine chip, the serum levels of several AIS-related proteins, including LCN2, ferritin, matrix metalloproteinase-3, vascular endothelial-derived growth factor, and X-linked inhibitor of apoptosis, were detected upon admission, and their associations with HT were analyzed. After finding that LCN2 was related to HT in patients with IVT, we clarified whether the modulation of LCN2 influenced BBB dysfunction and HT after thrombolysis and investigated the potential mechanism.

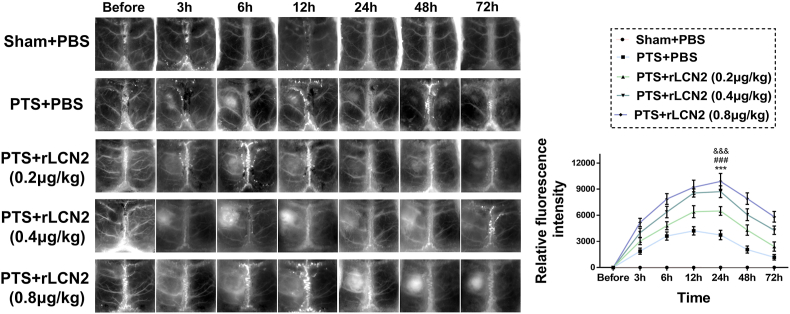
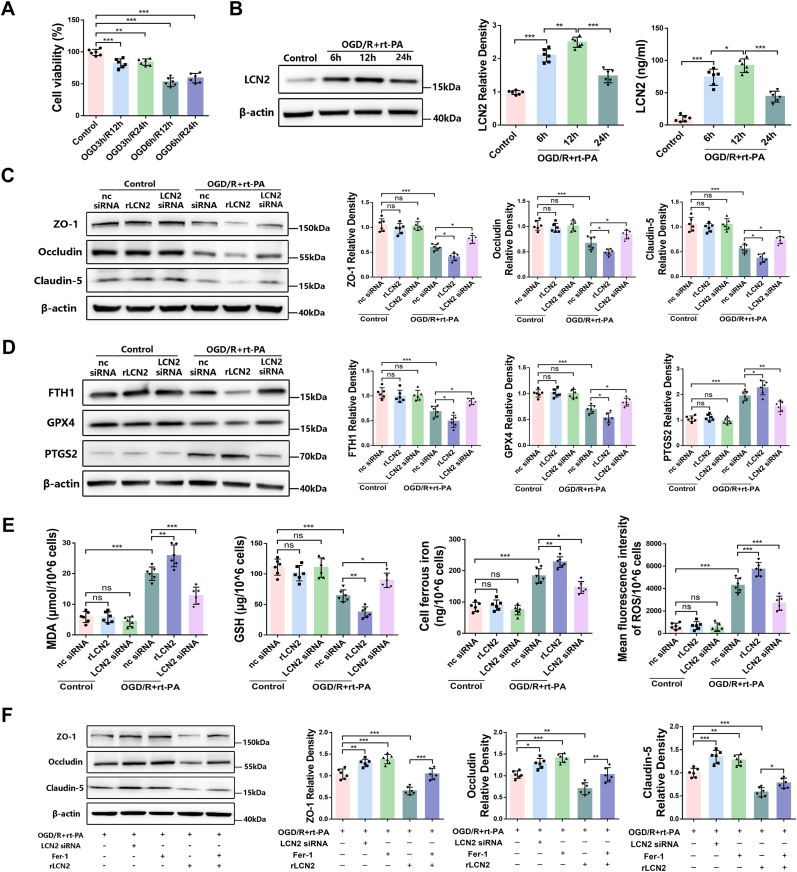
Results: In patients with AIS following IVT, logistic regression analysis showed that baseline serum LCN2 (p = 0.023) and ferritin (p = 0.046) levels were independently associated with HT. A positive correlation between serum LCN2 and ferritin levels was identified in patients with HT. In experimental studies, recombinant LCN2 (rLCN2) significantly aggravated BBB dysfunction and HT in the thromboembolic stroke rats after thrombolysis, whereas LCN2 inhibition by ZINC006440089 exerted opposite effects. Further mechanistic studies showed that, LCN2 promoted endothelial cell ferroptosis, accompanied by the induction of high mobility group box 1 (HMGB1) and the inhibition of nuclear translocation of nuclear factor E2-related factor 2 (Nrf2) and heme oxygenase-1 (HO-1) proteins. Ferroptosis inhibitor ferrostatin-1 (fer-1) significantly restricted the LCN2-mediated BBB disruption. Transfection of LCN2 and HMGB1 siRNA inhibited the endothelial cell ferroptosis, and this effects was reversed by Nrf2 siRNA.

Conclusion: LCN2 aggravated BBB disruption after thrombolysis by promoting endothelial cell ferroptosis via regulating the HMGB1/Nrf2/HO-1 pathway, this may provide a promising therapeutic target for the prevention of HT after IVT.

Keywords: Blood-brain barrier; Ferroptosis; Hemorrhagic transformation; High mobility group box 1; Intravenous thrombolysis; Lipocalin-2.


Conflict of interest statement

Declaration of competing interest None.

Figures

Image 1
Graphical abstract
Fig. 1
Fig. 1
The correlation between the serum levels of LCN2 and ferritin in patients with HT.
Fig. 2
Fig. 2
Increased LCN2 aggravated BBB disruption in PTS rats. Representative photographs of NIR-II imaging of rats and quantitative analyses of the fluorescent dye accumulation (μg/g tissue) before and at 3 h, 6 h, 12 h, 24 h, 48 h, and 72 h after surgery. n = 5–6/group. ***p < 0.001 PTS + rLCN2 (0.2 μg/kg) vs PTS + PBS; ###p < 0.001 PTS + rLCN2 (0.4 μg/kg) vs PTS + PBS; &&&p < 0.001 PTS + rLCN2 (0.8 μg/kg) vs PTS + PBS by two-way ANOVA (F = 543.35, p < 0.001 for different time points and F = 1221.36, p < 0.001 for different dosage of drugs).
Fig. 3
Fig. 3
Increased LCN2 aggravated cerebral damages and BBB disruption in the thromboembolic stroke rats after thrombolysis. (A) Expressions of LCN2 in the brain and serum of rats at different time points after surgery according to WB and ELISA analysis. n = 5–6/group. *p < 0.05, **p < 0.01, ***p < 0.001 by one-way ANOVA (F = 34.52, p < 0.001 for WB analysis of brain tissue; F = 45.22, p < 0.001 for ELISA analysis of brain tissue, and F = 148.78, p < 0.001 for ELISA analysis of serum respectively); (B) Neurological deficits of rats 24 h after thrombolysis. n = 5–6/group. *p < 0.05 by Kruskal-Wallis H test (H = 20.28, p < 0.001 for measurement of Zea Longa score; H = 20.3, p < 0.001 for measurement of modified Garcia score; H = 18.77, p < 0.001 for measurement of corner turn test; H = 20.67, p < 0.001 for measurement of forelimb placing test and H = 21.3, p < 0.001 for measurement of horizontal ladder walking task respectively); (C) Representative coronal sections of TTC staining and quantitative analyses of cerebral infarct volume 24 h after thrombolysis. n = 5–6/group. Scale bar: 5 mm ***p < 0.001 by one-way ANOVA (F = 179.21, p < 0.001); (D) Quantification of hematoma volume (μl) 24 h after thrombolysis. n = 5–6/group. **p < 0.01, ***p < 0.001 by one-way ANOVA (F = 43, p < 0.001); (E) Representative coronal sections of EB staining and quantitative analyses of EB dye extravasation (μg/g tissue) 24 h after thrombolysis. n = 5–6/group. Scale bar: 5 mm ***p < 0.001 by one-way ANOVA (F = 215.84, p < 0.001); (F) Expressions of ZO-1, occludin, and claudin-5 in the ipsilateral hemisphere of rats 24 h after thrombolysis. n = 6/group. *p < 0.05, ***p < 0.001 by one-way ANOVA (F = 36.82, p < 0.001 for WB analysis of ZO-1; F = 37.06, p < 0.001 for WB analysis of occludin and F = 41.32, p < 0.001 for WB analysis of claudin-5 respectively).
Fig. 4
Fig. 4
Inhibition of LCN2 alleviated cerebral damages and BBB disruption in the thromboembolic stroke rats after thrombolysis. (A) Expressions of LCN2 in the brain and serum of rats at different time points after surgery according to WB and ELISA analysis. n = 5–6/group. *p < 0.05, **p < 0.01, ***p < 0.001 by one-way ANOVA (F = 73.29, p < 0.001 for WB analysis of brain tissue; F = 60.3, p < 0.001 for ELISA analysis of brain tissue and F = 87.07, p < 0.001 for ELISA analysis of serum respectively); (B) Neurological deficits of rats 24 h after thrombolysis. n = 5–6/group. **p < 0.01, ***p < 0.001 by Kruskal-Wallis H test (H = 20.38, p < 0.001 for measurement of Zea Longa score; H = 20.62, p < 0.001 for measurement of modified Garcia score; H = 16.3, p = 0.001 for measurement of corner turn test; H = 20.62, p < 0.001 for measurement of forelimb placing test and H = 21.23, p < 0.001 for measurement of horizontal ladder walking task respectively); (C) Representative coronal sections of TTC staining and quantitative analyses of cerebral infarct volume 24 h after thrombolysis. n = 5–6/group. Scale bar: 5 mm ***p < 0.001 by one-way ANOVA (F = 187.87, p < 0.001); (D) Quantification of hematoma volume (μl) 24 h after thrombolysis. n = 6/group. **p < 0.01, ***p < 0.001 by one-way ANOVA (F = 65.51, p < 0.001); (E) Representative coronal sections of EB staining and quantitative analyses of EB dye extravasation (μg/g tissue) 24 h after thrombolysis. n = 5–6/group. Scale bar: 5 mm ***p < 0.001 by one-way ANOVA (F = 96.39, p < 0.001); (F) Expressions of ZO-1, occludin and claudin-5 in the ipsilateral hemisphere of rats 24 h after thrombolysis. n = 6/group. *p < 0.05, **p < 0.01, ***p < 0.001 by one-way ANOVA (F = 24.37, p < 0.001 for WB analysis of ZO-1; F = 25.49, p < 0.001 for WB analysis of occludin and F = 45.16, p < 0.001 for WB analysis of claudin-5 respectively).
Fig. 5
Fig. 5
LCN2 promoted endothelial cell ferroptosis to aggravate BBB disruption in the thromboembolic stroke rats after thrombolysis. (A) Representative images of NeuN, IBAl, GFAP or CD31 (green), and LCN2 (red) immunofluorescence staining in the ischemic cortex of rats 24 h after thrombolysis, with enlarged and merged image showed for co-localization. n = 3/group. Scale bar: 40 μm (merged pictures) and 20 μm (magnified pictures); (B) Representative images of NeuN, IBAl, GFAP, or CD31 (green) and 24p3r (red) immunofluorescence staining in the ischemic cortex of rats 24 h after thrombolysis, with enlarged and merged image showed for co-localization. n = 3/group. Scale bar: 40 μm (merged pictures) and 20 μm (magnified pictures); (C) Expressions of FTH1, GPX4, and PTGS2 in the ipsilateral hemisphere of rats 24 h after thrombolysis. n = 6/group. *p < 0.05, **p < 0.01, ***p < 0.001 by one-way ANOVA (F = 40.02, p < 0.001 for WB analysis of FTH1; F = 38.39, p < 0.001 for WB analysis of GPX4 and F = 146.51, p < 0.001 for WB analysis of PTGS2 respectively); (D) The content of MDA (μmol/g tissue) and GSH (μg/g tissue) in the ipsilateral hemisphere of rats 24 h after thrombolysis. n = 6/group. *p < 0.05, **p < 0.01, ***p < 0.001 by one-way ANOVA (F = 57.79, p < 0.001 for analysis of MDA content and F = 40.5, p < 0.001 for analysis of GSH content); (E) Representative immunofluorescence images of CD31 (red) and PTGS2 (green) signals and their enlarged and merged images in the ischemic cortex of rats 24 h after thrombolysis. The percentages of PTGS2+ CD31+ cells in the total number of CD31+ cells were also showed. n = 3/group. Scale bar: 40 μm (merged pictures) and 20 μm (magnified pictures). *p < 0.05, **p < 0.01, ***p < 0.001 by one-way ANOVA (F = 204.54, p < 0.001); (F) Expressions of ZO-1, occludin, and claudin-5 in the ipsilateral hemisphere of rats 24 h after thrombolysis. n = 5–6/group. *p < 0.05, **p < 0.01, ***p < 0.001 by one-way ANOVA (F = 26.68, p < 0.001 for WB analysis of ZO-1; F = 34.98, p < 0.001 for WB analysis of occludin; and F = 46.97, p < 0.001 for WB analysis of claudin-5 respectively). (For interpretation of the references to color in this figure legend, the reader is referred to the Web version of this article.)
Fig. 6
Fig. 6
LCN2 aggravated ferroptosis to promote TJPs loss in Bend.3 endothelial cells after OGD/R + rt-PA stimulus. (A) Bend.3 cell viability under different OGD/R conditions according to CCK8 assay. n = 6/group. **p < 0.01, ***p < 0.001 by one-way ANOVA (F = 55.77, p < 0.001); (B) Expressions of LCN2 in Bend.3 cells at different time points after re-oxygenation according to WB and ELISA analysis. n = 6/group. *p < 0.05, **p < 0.01, ***p < 0.001 by one-way ANOVA (F = 101.88, p < 0.001 for WB analysis of LCN2 and F = 85.64, p < 0.001 for ELISA analysis of LCN2); (C) Expressions of ZO-1, occludin, and claudin-5 in Bend.3 cells 12 h after re-oxygenation. n = 6/group. *p < 0.05, ***p < 0.001 by one-way ANOVA (F = 49.73, p < 0.001 for WB analysis of ZO-1; F = 30.73, p < 0.001 for WB analysis of occludin and F = 50.87, p < 0.001 for WB analysis of claudin-5 respectively); (D) Expressions of FTH1, GPX4 and PTGS2 in Bend.3 cells 12 h after re-oxygenation. n = 6/group. *p < 0.05, **p < 0.01, ***p < 0.001 by one-way ANOVA (F = 27.12, p < 0.001 for WB analysis of FTH1; F = 36.14, p < 0.001 for WB analysis of GPX4 and F = 52.22, p < 0.001 for WB analysis of PTGS2 respectively); (E) The contents of MDA, GSH, cell iron, and ROS in Bend.3 cells 12 h after re-oxygenation. n = 6/group. *p < 0.05, **p < 0.01, ***p < 0.001 by one-way ANOVA (F = 82.09, p < 0.001 for analysis of MDA content; F = 34.59, p < 0.001 for analysis of GSH content; F = 71.33, p < 0.001 for analysis of cell iron content and F = 115.55, p < 0.001 for analysis of ROS content respectively); (F) Expressions of ZO-1, occludin, and claudin-5 in Bend.3 cells 12 h after re-oxygenation. n = 6/group. *p < 0.05, **p < 0.01, ***p < 0.001 by one-way ANOVA (F = 42.71, p < 0.001 for WB analysis of ZO-1; F = 29.45, p < 0.001 for WB analysis of occludin and F = 49.39, p < 0.001 for WB analysis of claudin-5 respectively).
Fig. 7
Fig. 7
HMGB1 is involved in LCN2-mediated endothelial cell ferroptosis. (A) Expression of HMGB1 in the ipsilateral hemisphere of rats 24 h after thrombolysis according to WB and ELISA analysis. n = 6/group. *p < 0.05, **p < 0.01, ***p < 0.001 by one-way ANOVA (F = 151.88, p < 0.001 for WB analysis of HMGB1 and F = 103.77, p < 0.001 for ELISA analysis of HMGB1); (B) Representative images of HMGB1 (green) and CD31 (red) immunofluorescence staining and their enlarged and merged images in the ischemic cortex of rats 24 h after thrombolysis. The percentages of HMGB1+ CD31+ cells in the total number of CD31+ cells were showed. n = 3/group. Scale bar: 40 μm (merged pictures) and 20 μm (magnified pictures). **p < 0.01, ***p < 0.001 by one-way ANOVA (F = 120.65, p < 0.001); (C) Expression of HMGB1 in Bend.3 cells 12 h after re-oxygenation according to WB and ELISA analysis. n = 6/group. ***p < 0.001 by one-way ANOVA (F = 133.82, p < 0.001 for WB analysis of HMGB1 and F = 182.56, p < 0.001 for ELISA analysis of HMGB1); (D) Expression of HMGB1 in Bend.3 cells 12 h after re-oxygenation according to WB and ELISA analysis. n = 6/group. ***p < 0.001 by one-way ANOVA (F = 62.69, p < 0.001 for WB analysis of HMGB1 and F = 96.11, p < 0.001 for ELISA analysis of HMGB1); (E). Expressions of FTH1, GPX4 and PTGS2 in Bend.3 cells 12 h after re-oxygenation. n = 6/group. *p < 0.05, **p < 0.01, ***p < 0.001 by one-way ANOVA (F = 27.74, p < 0.001 for WB analysis of FTH1; F = 28.78, p < 0.001 for WB analysis of GPX4 and F = 41.96, p < 0.001 for WB analysis of PTGS2 respectively); (F) The contents of MDA, GSH, cell iron and ROS in Bend.3 cells 12 h after re-oxygenation. n = 6/group. *p < 0.05, **p < 0.01, ***p < 0.001 by one-way ANOVA (F = 15.04, p < 0.001 for analysis of MDA content; F = 16.33, p < 0.001 for analysis of GSH content; F = 18.63, p < 0.001 for analysis of cell iron and F = 45.49, p < 0.001 for analysis of ROS content respectively). (For interpretation of the references to color in this figure legend, the reader is referred to the Web version of this article.)
Fig. 8
Fig. 8
Nrf2/HO-1 signaling is involved in LCN2/HMGB1-mediated endothelial cell ferroptosis. (A) Nuclear- and cytoplasmic-Nrf2 and HO-1 protein levels in the ipsilateral hemisphere of rats 24 h after thrombolysis. n = 6/group. *p < 0.05, **p < 0.01, ***p < 0.001 by one-way ANOVA (F = 85.2, p < 0.001 for WB analysis of nuclear-Nrf2; F = 29.44, p < 0.001 for WB analysis of cytoplasmic-Nrf2 and F = 46.9, p < 0.001 for WB analysis of HO-1 respectively); (B) Nuclear- and cytoplasmic-Nrf2 and HO-1 protein levels in Bend.3 cells 12 h after re-oxygenation. n = 6/group. *p < 0.05, **p < 0.01, ***p < 0.001 by one-way ANOVA (F = 79.98, p < 0.001 for WB analysis of nuclear-Nrf2; F = 40.11, p < 0.001 for WB analysis of cytoplasmic-Nrf2 and F = 65.06, p < 0.001 for WB analysis of HO-1 respectively); (C) Expressions of FTH1, GPX4, PTGS2 and HO-1 in Bend.3 cells 12 h after re-oxygenation. n = 6/group. *p < 0.05, **p < 0.01, ***p < 0.001 by one-way ANOVA (F = 29.82, p < 0.001 for WB analysis of FTH1; F = 37.2, p < 0.001 for WB analysis of GPX4; F = 55.98, p < 0.001 for WB analysis of PTGS2 and F = 85.62, p < 0.001 for WB analysis of HO-1 respectively); (D) The contents of MDA, GSH, cell iron and ROS in Bend.3 cells 12 h after re-oxygenation. n = 6/group. *p < 0.05, **p < 0.01, ***p < 0.001 by one-way ANOVA (F = 31.02, p < 0.001 for analysis of MDA content; F = 28.32, p < 0.001 for analysis of GSH content; F = 47.46, p < 0.001 for analysis of cell iron and F = 89.53, p < 0.001 for analysis of ROS content respectively).

References

    1. Powers W.J., Rabinstein A.A., Ackerson T., Adeoye O.M., Bambakidis N.C., Becker K., Biller J., Brown M., Demaerschalk B.M., Hoh B., Jauch E.C., Kidwell C.S., Leslie-Mazwi T.M., Ovbiagele B., Scott P.A., Sheth K.N., Southerland A.M., Summers D.V., Tirschwell D.L. Guidelines for the early management of patients with acute ischemic stroke: 2019 update to the 2018 guidelines for the early management of acute ischemic stroke: a guideline for healthcare professionals from the American heart association/American stroke association. Stroke. 2019;50:e344–e418. - PubMed
    1. Kunte H., Busch M.A., Trostdorf K., Vollnberg B., Harms L., Mehta R.I., Castellani R.J., Mandava P., Kent T.A., Simard J.M. Hemorrhagic transformation of ischemic stroke in diabetics on sulfonylureas. Ann. Neurol. 2012;72:799–806. - PMC - PubMed
    1. Shi K., Zou M., Jia D.M., Shi S., Yang X., Liu Q., Dong J.F., Sheth K.N., Wang X., Shi F.D. tPA mobilizes immune cells that exacerbate hemorrhagic transformation in stroke. Circ. Res. 2021;128:62–75. - PubMed
    1. Chen H., Guan B., Chen X., Chen X., Li C., Qiu J., Yang D., Liu K.J., Qi S., Shen J. Baicalin attenuates blood-brain barrier disruption and hemorrhagic transformation and improves neurological outcome in ischemic stroke rats with delayed t-PA treatment: involvement of ONOO(-)-MMP-9 pathway. Transl Stroke Res. 2018;9:515–529. - PubMed
    1. Ozkul-Wermester O., Guegan-Massardier E., Triquenot A., Borden A., Perot G., Gérardin E. Increased blood-brain barrier permeability on perfusion computed tomography predicts hemorrhagic transformation in acute ischemic stroke. Eur. Neurol. 2014;72:45–53. - PubMed

Publication types

MeSH terms

LinkOut - more resources