. 2024 Oct:76:103344.
doi: 10.1016/j.redox.2024.103344. Epub 2024 Sep 6.

CARM1 phosphorylation at S595 by p38γ MAPK drives ROS-mediated cellular senescence

Affiliations

CARM1 phosphorylation at S595 by p38γ MAPK drives ROS-mediated cellular senescence

Yena Cho et al. Redox Biol. 2024 Oct.

Abstract

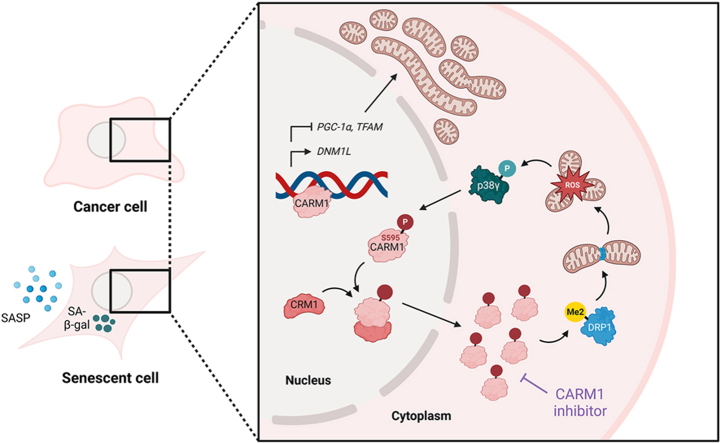
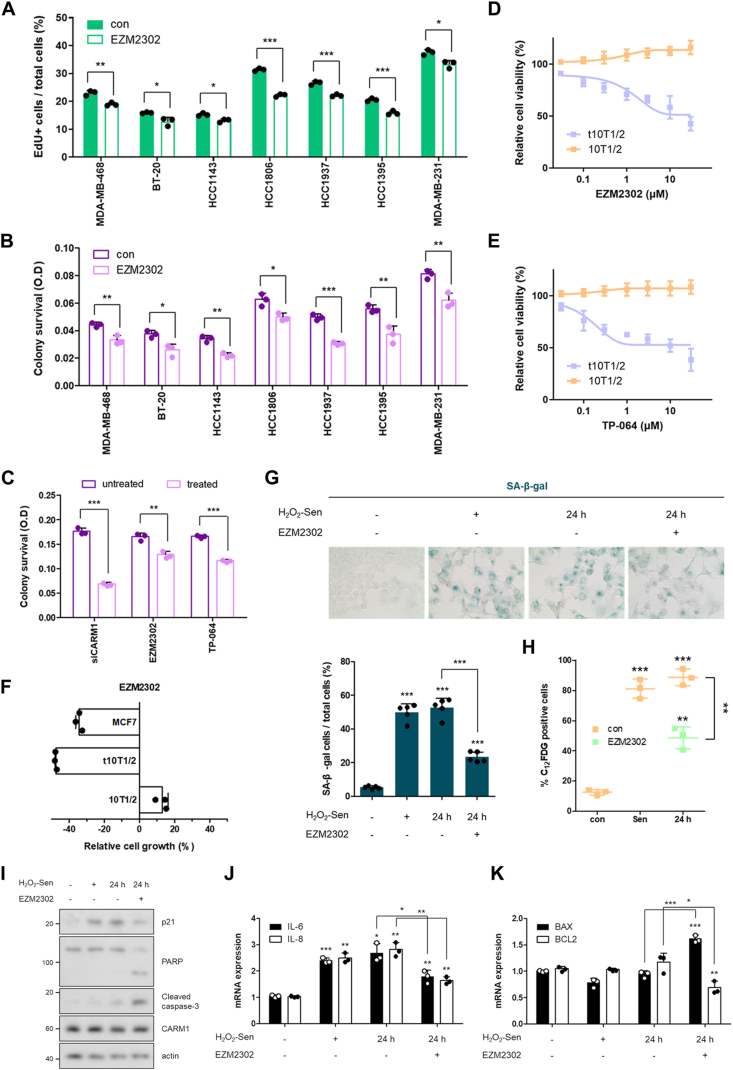
CARM1 is predominantly localized in the nucleus and plays a pivotal role in maintaining mitochondrial homeostasis by regulating gene expression. It suppresses mitochondrial biogenesis by downregulating PGC-1α and TFAM expression, while promoting mitochondrial fission through increased DNM1L expression. Under oxidative stress, CARM1 translocates to the cytoplasm, where it directly methylates DRP1 and accelerates mitochondrial fission, enhancing reactive oxygen species (ROS) production. Cytoplasmic localization of CARM1 is facilitated by its phosphorylation at S595 by ROS-activated p38γ MAPK, creating a positive feedback loop. Consequently, cytoplasmic CARM1 contributes to cellular senescence by altering mitochondrial dynamics and increasing ROS levels. This observation was supported by the increased cytoplasmic CARM1 levels and disrupted mitochondrial dynamics in the transformed 10T1/2 cells. Moreover, CARM1 inhibitors not only inhibit the proliferation of cancer cells but also induce apoptotic death in senescent cells. These findings highlight the potential of CARM1 inhibitors, particularly those targeting cytoplasmic functions, as novel strategies for eliminating cancer and senescent cells.

Keywords: CARM1; Mitochondrial homeostasis; ROS; Senescence; p38γ MAPK.


Conflict of interest statement

Declaration of competing interest The authors declare that they have no known competing financial interests or personal relationships that could have appeared to influence the work reported in this paper.

Figures

Image 1
Graphical abstract
Fig. 1
Fig. 1
Cytoplasmic CARM1 determines the morphology and quantity of mitochondria. (A-C) Double immunostaining for CARM1 (red) and TOM20 (green), scale bars, 10 μm (A), western blots of the nuclear and cytoplasmic fractions (B), and relative cytoplasmic CARM1 levels (C) in triple-negative breast cancer cell lines (MDA-MB-468, BT-20, HCC1143, HCC1806, HCC1937, HCC1395, and MDA-MB-231). (D) Double immunostaining for TOM20 (green) and CARM1 (red) in transformed 10T1/2 cells. Scale bars, 10 μm. (E) Western blots of the nuclear, mitochondrial, and cytoplasmic fractions from transformed or parental 10T1/2 cells. (F) Confocal images of MitoTracker™ CM-H2XROS (red) and DRP1 (green) in transformed or parental 10T1/2 cells. Scale bars, 10 μm. (G-I) mtDNA/ncDNA, measured using quantitative real-time PCR (G), western blots of cell lysates (H), and mRNA expression levels (I) from transformed or parental 10T1/2 cells. Error bars represent mean ± SD (n = 3). (For interpretation of the references to color in this figure legend, the reader is referred to the Web version of this article.)
Fig. 2
Fig. 2
Nuclear CARM1 limits mitochondrial biogenesis by suppressing PGC-1α and TFAM. (A) mtDNA/ncDNA, measured through quantitative real-time PCR in CARM1-WT or -KO MEF cells. Error bars represent mean ± SD (n = 3). (B) Confocal images of TOM20 (green), CARM1 (red), and DAPI (blue) in CARM1-WT or -KO MEF cells. Scale bars, 10 μm. (C) Western blots of cell lysates from CARM1-WT or -KO MEF cells. The protein levels of TOM20 and OXPHOS are reliable markers of mitochondrial mass. (D) mRNA expression levels of Pgc-1α and Carm1 in CARM1-WT or -KO MEF cells. Error bars represent mean ± SD (n = 3). (E) Western blots of cell lysates from CARM1-WT or -KO MEF cells transfected with GFP-CARM1 (WT or E266Q) for 48 h. (F) Western blots of the nuclear and cytoplasmic fractions from MEF, 10T1/2, or MCF7 cells. (G) Confocal images of TOM20 (green), CARM1 (red), and DAPI (blue) in 10T1/2 or MCF7 cells. Scale bars, 10 μm. (H) Western blots of cell lysates from MEF, 10T1/2, or MCF7 cells. (For interpretation of the references to color in this figure legend, the reader is referred to the Web version of this article.)
Fig. 3
Fig. 3
Cytoplasmic translocation of CARM1 requires p38γ MAPK activation by ROS. (A,B) Western blots of total lysates (A) and nuclear/cytoplasmic fractions (B) from 10T1/2 cells treated with 100 ng/mL LPS or/and 10 mM NAC for 3 h. (C,D) Western blots of total lysates (C) and nuclear/cytoplasmic fractions (D) from 10T1/2 cells treated with 0.5 mM H2O2 or/and 10 nM LMB for 3 h. (E,F) Western blots of cell lysates from 10T1/2 cells pre-treated with p38 MAPK inhibitor (SB203580, SB239063, or BIRB 796) at 10 μM for 1 h prior to LPS stimulation. (G-I) Western blots of the nuclear and cytoplasmic fractions (G), double immunostaining for CARM1 (red) and TOM20 (H), and for DRP1 (red), Mff (green) (I) from 10T1/2 cells pre-treated with BIRB 796 prior to LPS stimulation. Digitonin (20 μg/mL, 2 min) was used for treatment before fixation to remove the cytoplasmic DRP1. Scale bars, 10 μm. (For interpretation of the references to color in this figure legend, the reader is referred to the Web version of this article.)
Fig. 4
Fig. 4
p38γ MAPK phosphorylates CARM1 at S595, triggering cellular senescence. (A) Western blots of cell lysates from 10T1/2 cells transfected with HA-CARM1 (WT or S595A) for 48 h and then treated with LPS (100 ng/mL, 3 h). (B) Western blots of the nuclear and cytoplasmic fractions from 10T1/2 cells transfected with HA-CARM1 (WT, S595E, or S595A) for 48 h. (C,D) Confocal images of TOM20 (green) and HA (red) from 10T1/2 cells overexpressing HA-CARM1 (WT, S595E, or S595A). Scale bars, 10 μm. Mitochondrial morphology was analyzed using ImageJ/FiJi software. The more fragmented the mitochondria, the lower the mitochondrial interconnectivity. Data are presented as mean ± SD (n = 5). (E) Confocal images of MitoTracker™ CM-H2XROS (red) and HA (green) from 10T1/2 cells overexpressing HA-CARM1 (WT, S595E, or S595A). Scale bars, 10 μm. (F,G) mRNA expression levels of SASP factors (F) and β-galactosidase activity assessed using its fluorescent substrate C12FDG (G) from the cells transfected with HA-CARM1 (WT, S595E, or S595A) for 48 h. Error bars indicate mean ± SD (n = 3). (H-J) p21 protein levels (H), mRNA expression levels of SASP factors (I), and β-galactosidase activity (J) upon senescence induction (0.5 mM H2O2 for 3 h and then fresh media for 24 h) in cells overexpressing HA-CARM1 WT or mutant. Error bars represent mean ± SD (n = 3). (For interpretation of the references to color in this figure legend, the reader is referred to the Web version of this article.)
Fig. 5
Fig. 5
Inhibition of CARM1 promotes the apoptotic death of senescent cells. (A,B) EdU incorporation assay (A) and colony forming assay (B) in triple-negative breast cancer cell lines treated with EZM2302 (1 μM, 72 h). EdU was incubated at 20 μM for 3 h and EdU positive cells were counted using flow cytometry. Colonies were stained with crystal violet and absorbance was measured at 540 nm. Error bars represent mean ± SD (n = 3). (C) Colony forming assay in transformed 10T1/2 cells treated with CARM1 siRNA, EZM2302 (1 μM), or TP-064 (1 μM) for 72 h. Error bars indicate mean ± SD (n = 3). (D,E) The effects of EZM2302 (D) or TP-064 (E) on cell growth in transformed or parental 10T1/2 cells. (F) Relative cell growth percentage upon EZM2302 treatment in MCF7, transformed, or parental 10T1/2 cells. (G) Representative images of SA-β-gal assay. After induction of senescence, EZM2302 was treated at 1 μM for 24 h. Data are presented as mean ± SD (n = 5). (H–K) β-galactosidase activity (H), western blots of cell lysates (l), and mRNA expression levels (J,K) from MCF7 cells treated with 1 μM EZM2302 for 24 h, after senescence induction. Error bars indicate mean ± SD (n = 3). (For interpretation of the references to color in this figure legend, the reader is referred to the Web version of this article.)

References

    1. Vakifahmetoglu-Norberg H., Ouchida A.T., Norberg E. The role of mitochondria in metabolism and cell death. Biochem. Biophys. Res. Commun. 2017;482:426–431. doi: 10.1016/j.bbrc.2016.11.088. - DOI - PubMed
    1. Wang C., Youle R.J. The role of mitochondria in apoptosis. Annu. Rev. Genet. 2009;43:95–118. doi: 10.1146/annurev-genet-102108-134850. - DOI - PMC - PubMed
    1. Matilainen O., Quiros P.M., Auwerx J. Mitochondria and epigenetics - crosstalk in homeostasis and stress. Trends Cell Biol. 2017;27:453–463. doi: 10.1016/j.tcb.2017.02.004. - DOI - PubMed
    1. van der Bliek A.M., Sedensky M.M., Morgan P.G. Cell biology of the mitochondrion. Genetics. 2017;207:843–871. doi: 10.1534/genetics.117.300262. - DOI - PMC - PubMed
    1. Jornayvaz F.R., Shulman G.I. Regulation of mitochondrial biogenesis. Essays Biochem. 2010;47:69–84. doi: 10.1042/bse0470069. - DOI - PMC - PubMed

Publication types

Substances

LinkOut - more resources