

Impact of in ovo administration of xylo- and mannooligosaccharides on broiler chicken gut health
- PMID: 39265513
- PMCID: PMC11416585
- DOI: 10.1016/j.psj.2024.104261
Impact of in ovo administration of xylo- and mannooligosaccharides on broiler chicken gut health
Abstract
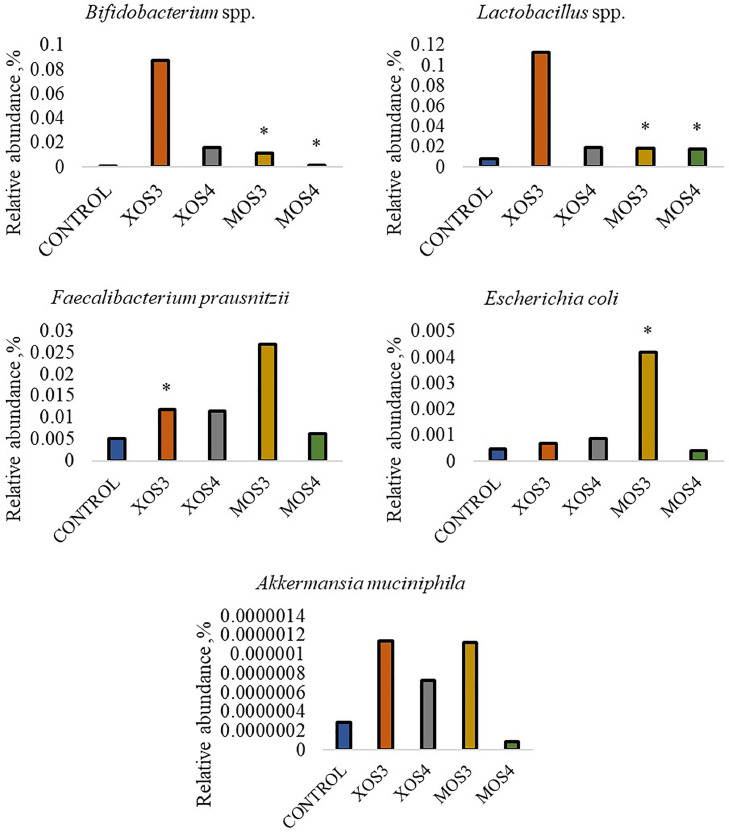
The intestinal mucosa creates a connection between the gut microbiota and the host. This study aimed to modify the gut microbiota of broiler chickens by in ovo stimulation with xylo-oligosaccharide (XOS) and manno-oligosaccharide (MOS) prebiotics and to determine the changes occurring in specific gut segments. Three hundred incubated eggs of Ross 308 broiler chickens on the 12th d of incubation were injected with: saline (control), xylotriose (XOS3), xylotetrose (XOS4), mannotriose (MOS3) or mannotetrose (MOS4). Tissue and digesta samples were collected post-mortem from 8 randomly selected individuals from each group, on d 42 after hatching. Gene expression analysis in the cecum and ileum was performed by RT-qPCR for a panel of genes: innate immune response genes (IL-2, IL-4, IL-6, IL-8, IL-10, IL-12, IL-17, IL-1β, IFNγ, IFNβ), nutrient sensing and nutrient transport genes (FFAR2, FFAR4, GLUT1, GLUT2, GLUT5), host defence peptides (AvBD1, CATHL2), and barrier function genes (MUC6, CLDN1, TJAP). The relative abundance of bacteria was determined by qPCR for individual bacteria (Akkermansia muciniphilla, Bifidobacterium spp., Clostridium difficile, Escherichia coli, Faecalibacterium prausnitzii, and Lactobacillus spp.). Stimulation with prebiotics caused changes in the abundance of bacteria especially Lactobacillus spp. and Bifidobacterium spp. in the cecum. The abundance of both genera increased in each study group compared to the control group. The highest abundance of Bifidobacterium spp. in the ileum was found in the MOS3 group compared to the control group. There were changes in the XOS4 and MOS3 groups in the expression of: FFAR4, GLUT1, AvBD1, CATHL2, IL-2, IL-12, and IL-17 in the caecum. In conclusion, in ovo administration of prebiotics increased intestinal colonization by bacteria. The prebiotics influenced gene expression levels via changes in the gut microbiota.
Keywords: microbiota; prebiotic.
Copyright © 2024 The Authors. Published by Elsevier Inc. All rights reserved.
Conflict of interest statement
DISCLOSURES The authors declare no conflicts of interest.
Figures


References
-
- Akao T. Purification and characterization of glycyrrhetic acid mono-glucuronide. BETA.-D-Glucuronidase in Eubacterium sp. GLH. Biol Pharm Bull. 1999;22:80–82. - PubMed
-
- Akao T. Competition in the metabolism of glycyrrhizin with glycyrrhetic acid mono-glucuronide by mixed Eubacterium sp. GLH and Ruminococcus sp. PO1-3. Biol. Pharm. Bull. 2000;23:149–154. - PubMed
-
- Ayimbila F., Keawsompong S. Characteristics and bioactive properties of agro-waste and yeast derived manno-oligosaccharides. Biocatalysis Agric. Biotechnol. 2022;45:1878–8181.
-
- Barszcz M., Taciak M., Skomiał J. A dose-response effects of tannic acid and protein on growth performance, caecal fermentation, colon morphology, and β-glucuronidase activity of rats. J. Anim. Feed Sci. 2011;20:613–625.
MeSH terms
Substances
LinkOut - more resources
Full Text Sources
Miscellaneous
