. 2024 Oct 9;4(10):100638.
doi: 10.1016/j.xgen.2024.100638. Epub 2024 Sep 11.

Human milk variation is shaped by maternal genetics and impacts the infant gut microbiome

Affiliations

Human milk variation is shaped by maternal genetics and impacts the infant gut microbiome

Kelsey E Johnson et al. Cell Genom. .

Abstract

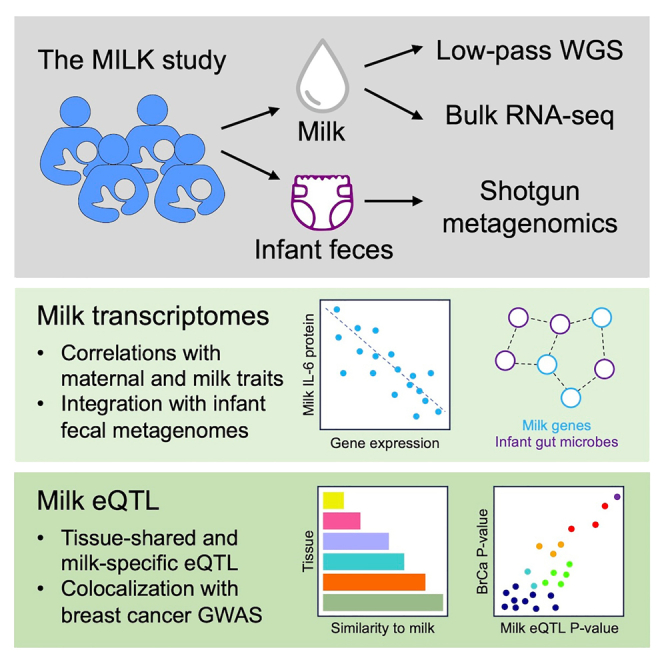
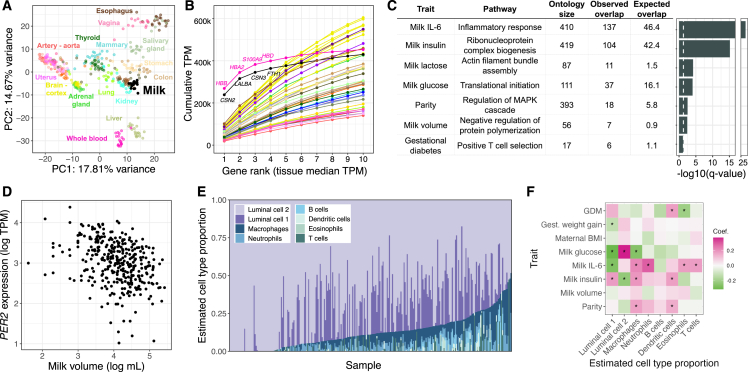
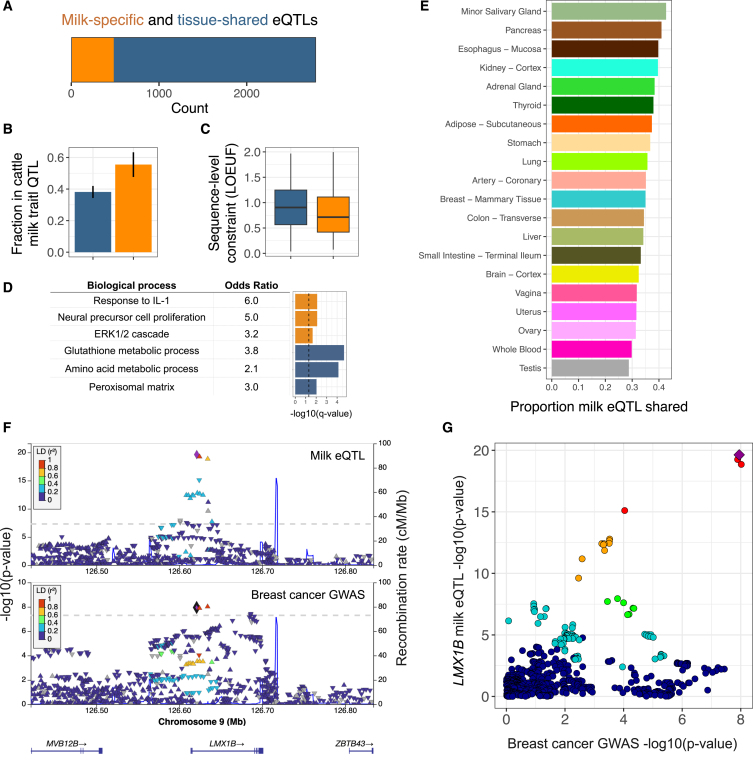
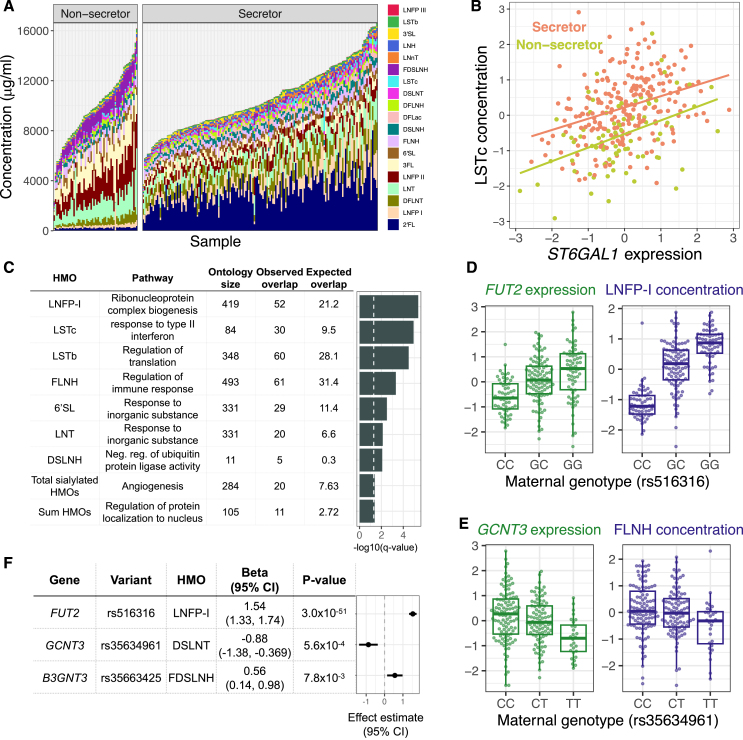
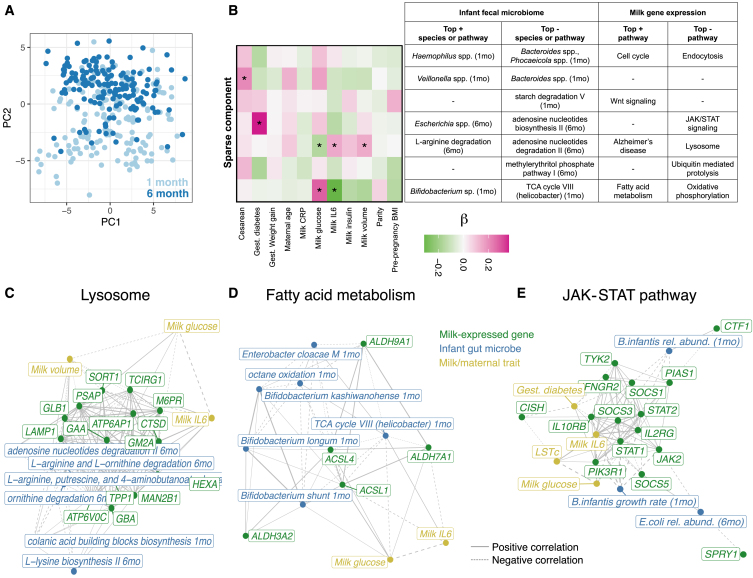
Human milk is a complex mix of nutritional and bioactive components that provide complete nourishment for the infant. However, we lack a systematic knowledge of the factors shaping milk composition and how milk variation influences infant health. Here, we characterize relationships between maternal genetics, milk gene expression, milk composition, and the infant fecal microbiome in up to 310 exclusively breastfeeding mother-infant pairs. We identified 482 genetic loci associated with milk gene expression unique to the lactating mammary gland and link these loci to breast cancer risk and human milk oligosaccharide concentration. Integrative analyses uncovered connections between milk gene expression and infant gut microbiome, including an association between the expression of inflammation-related genes with milk interleukin-6 (IL-6) concentration and the abundance of Bifidobacterium and Escherichia in the infant gut. Our results show how an improved understanding of the genetics and genomics of human milk connects lactation biology with maternal and infant health.

Keywords: breastfeeding; eQTL; human milk; lactation; microbiome; nutrition.


Conflict of interest statement

Declaration of interests The authors declare no competing interests.

Figures

None
Graphical abstract
Figure 1
Figure 1
Overview of gene expression in human milk (A) Principal-component analysis of transcriptomes from a subset of GTEx tissues and milk. 19 random samples were chosen from each tissue. PCs were calculated using the 1,000 most variable genes within GTEx, and then milk samples were projected onto the GTEx samples. An equivalent plot including all GTEx tissues is shown in Figure S5. (B) Cumulative TPM (transcripts per million) of the top 10 genes by median TPM for milk and GTEx tissues. The color scheme is the same as in (A). (C) Gene Ontology enrichment of genes with expression correlated to maternal and milk traits. The most significant term for each trait is shown (STAR Methods). The dashed white vertical line denotes a q value of 0.05. (D) Correlation between milk volume (from standardized electric breast pump expression during a study visit; STAR Methods) and PER2 gene expression in milk. (E) Cell type proportion estimates generated using Bisque for transcriptomes from this study with reference milk single-cell RNA-seq from Nyquist et al. (F) Heatmap of regression coefficients between estimated cell type proportions (x axis) and maternal or milk traits (y axis) from a linear model including technical covariates (STAR Methods). ∗q < 10%. See also Figure S1 and Tables S2, S3, S5, and S7.
Figure 2
Figure 2
Genetic influences on gene expression in human milk (A) Counts of genes with milk-specific eQTLs (orange, genes with an eQTL signal that did not colocalize with any GTEx tissue; STAR Methods) vs. tissue-shared eQTLs (blue, genes with all milk eQTL signals colocalized with at least one GTEx tissue). (B) Fraction of genes in each category that overlapped with a milk trait QTL in the dairy cattle genome. Error bars represent a 95% confidence interval. (C) Distributions of sequence-level constraint, measured by the loss-of-function observed/expected upper bound fraction statistic. (D) Enriched Gene Ontologies for genes with milk-specific (orange) or tissue-shared (blue) eQTLs. The dashed vertical line denotes a q value of 5%. (E) Fraction of shared milk eQTLs with a subset of GTEx tissues, estimated with mash. (F) LocusZoom genetic associations in the LMX1B region with milk gene expression (top) and breast cancer risk (bottom). Each data point represents a SNP, plotted by its chromosomal location (x axis) and significance of association (y axis), with colors corresponding to linkage disequilibrium (r2) to the lead SNP for the milk eQTL, shown as a purple diamond. (G) Each point is a variant, plotted by the strength of association with milk gene expression (y axis) and breast cancer risk (x axis). Colors are the same as in (F), top, with a purple diamond representing the lead milk eQTL SNP. The pattern of variants in the top right suggests a shared underlying causal variant. See also Figures S13, S14, S15, S16, S17, S18, S19, and S20 and Tables S8, S9, S10, S11, S12, and S13.
Figure 3
Figure 3
Effects of milk gene expression on HMO composition (A) HMO concentration (y axis) profiles for milk samples in our study (x axis), grouped by secretor status. (B) Correlation between ST6GAL1 gene expression in milk and normalized LSTc concentration, colored by secretor status (log2 fold change = 0.32, p = 6.6 × 10−8, q = 1.5 × 10−4). (C) Gene Ontology enrichment of genes with expression correlated to a single HMO or HMO category. The most significant term for each HMO is plotted. The dashed vertical line denotes a q value of 5%. (D) Relationships between genotype at the lead SNP at the FUT2 eQTL and FUT2 expression in milk (green) or LNFP-I concentration (purple). LNFP-I concentrations are residuals after correcting for genetic PCs (STAR Methods). (E) Relationships between genotype at the lead SNP at the GCNT3 eQTL and GCNT3 expression in milk (green) or FLNH concentration (purple). FLNH concentrations are residuals after correcting for secretor status and genetic PCs (STAR Methods). (F) Estimates of the effect of milk gene expression of candidate HMO biosynthesis pathway genes on the abundance of HMOs from a Wald ratio test. Some genes had significant effects on more than one HMO (Table S18). The most significant HMO for each gene is plotted here. See also Figures S21, S22, and S23 and Tables S14, S15, S16, S17, and S18.
Figure 4
Figure 4
Interactions between milk gene expression and the infant fecal microbiome (A) Principal-component analysis of infant fecal microbiome metagenomic data, summarized at the taxonomic level, with each point representing a fecal sample and colors representing infant age (light blue, 1 month; dark blue, 6 months). (B) Sparse CCA integrating milk host gene expression and infant fecal microbial species or microbial genetic pathway relative abundance (at 1 or 6 months of age) identified seven significant sparse components (in rows). The heatmap on the left shows Spearman correlation coefficients between each mother/infant pair score for a given sparse component (rows) and maternal or milk traits (columns). The table lists the most highly weighted microbial taxon or genetic pathway and the most significantly enriched host gene set in milk gene expression. (+) or (−) indicates whether these features were positively or negatively weighted in the sparse component. (C and D) Network diagrams generated using the correlation matrix of infant fecal microbial species/pathways and milk-expressed host genes within an enriched pathway for two of the sparse components in (B). Line size corresponds to the absolute value of the correlation coefficient, and line type corresponds to negative (dashed) or positive (solid) correlations. Node color signifies milk-expressed host genes (green), infant fecal microbial pathways/taxa (green), or maternal/milk traits (yellow). Plotted edges had correlation p < 0.05. (E) Network diagram displaying correlations between milk IL-6 concentration, LSTc (HMO) concentration, JAK-STAT pathway genes expressed in milk, and B. infantis relative abundance and estimated growth rate in the infant gut at 1 month and Escherichia coli relative abundance at 6 months. JAK-STAT pathway genes were selected that had a significant correlation with B. infantis or E. coli abundance after multiple test correction (q < 10%). See also Figure S24 and Tables S19, S20, and S21.

Update of

References

    1. Lefèvre C.M., Sharp J.A., Nicholas K.R. Evolution of lactation: ancient origin and extreme adaptations of the lactation system. Annu. Rev. Genomics Hum. Genet. 2010;11:219–238. doi: 10.1146/annurev-genom-082509-141806. - DOI - PubMed
    1. Victora C.G., Bahl R., Barros A.J.D., França G.V.A., Horton S., Krasevec J., Murch S., Sankar M.J., Walker N., Rollins N.C., Lancet Breastfeeding Series Group Breastfeeding in the 21st century: epidemiology, mechanisms, and lifelong effect. Lancet. 2016;387:475–490. doi: 10.1016/S0140-6736(15)01024-7. - DOI - PubMed
    1. Ballard O., Morrow A.L. Human milk composition: nutrients and bioactive factors. Pediatr. Clin. North Am. 2013;60:49–74. doi: 10.1016/j.pcl.2012.10.002. - DOI - PMC - PubMed
    1. Andreas N.J., Kampmann B., Mehring Le-Doare K. Human breast milk: A review on its composition and bioactivity. Early Hum. Dev. 2015;91:629–635. doi: 10.1016/j.earlhumdev.2015.08.013. - DOI - PubMed
    1. Christian P., Smith E.R., Lee S.E., Vargas A.J., Bremer A.A., Raiten D.J. The need to study human milk as a biological system. Am. J. Clin. Nutr. 2021;113:1063–1072. doi: 10.1093/ajcn/nqab075. - DOI - PMC - PubMed

LinkOut - more resources