. 2024 Oct 3;187(20):5753-5774.e28.
doi: 10.1016/j.cell.2024.08.019. Epub 2024 Sep 11.

Cross-disorder and disease-specific pathways in dementia revealed by single-cell genomics

Affiliations

Cross-disorder and disease-specific pathways in dementia revealed by single-cell genomics

Jessica E Rexach et al. Cell. .

Abstract

The development of successful therapeutics for dementias requires an understanding of their shared and distinct molecular features in the human brain. We performed single-nuclear RNA-seq and ATAC-seq in Alzheimer's disease (AD), frontotemporal dementia (FTD), and progressive supranuclear palsy (PSP), analyzing 41 participants and ∼1 million cells (RNA + ATAC) from three brain regions varying in vulnerability and pathological burden. We identify 32 shared, disease-associated cell types and 14 that are disease specific. Disease-specific cell states represent glial-immune mechanisms and selective neuronal vulnerability impacting layer 5 intratelencephalic neurons in AD, layer 2/3 intratelencephalic neurons in FTD, and layer 5/6 near-projection neurons in PSP. We identify disease-associated gene regulatory networks and cells impacted by causal genetic risk, which differ by disorder. These data illustrate the heterogeneous spectrum of glial and neuronal compositional and gene expression alterations in different dementias and identify therapeutic targets by revealing shared and disease-specific cell states.

Keywords: KCNH7; MAFG; NFE2L1; NLGN1; OPCML; PDE1C; drug discovery; functional genomics; multi-omics; tauopathy.


Conflict of interest statement

Declaration of interests D.H.G. has received research funding from Hoffman-LaRoche for this project. D.C. is a full-time employee of F. Hoffmann-La Roche, Basel, Switzerland. During the study period, D.M. was a full-time employee of F. Hoffmann-La Roche, Basel, Switzerland, and is currently a full-time employee of Biogen, Cambridge, MA, USA.

Figures

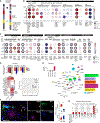
Figure 1.
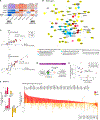
Figure 1.. Comparison of cell types, subclasses, and disease states across brain regions with variable disease vulnerability across neurodegenerative tauopathies
(A) Schema depicting cross-disorder analysis of brain tissue from AD, bvFTD, PSP, and controls in INS, BA4, and V1 (1.4 M cells pre-QC; RNA + ATAC) to define changes in cellular and molecular composition and gene regulatory networks (GRNs), including (left) cartoon with heatmaps showing, by region and disorder, neuropathology scores averaged across subjects for neurodegeneration (blue, below) and tau (red above) (Table S1). FTD: abbreviation for bvFTD used interchangeably throughout. (B) snRNA-seq clusters separating into 9 canonical cell types by condition (AD, bvFTD, PSP, and control; left top) and brain region (V1, INS, and BA4; left lower) (≈590,000 cells, 101 samples post-quality control [QC] snRNA-seq; Table S1). (C) Unsupervised re-clustering of excitatory neurons from one brain region (BA4) across all disease conditions to identify disease-associated subclasses and states. (D) Pie charts showing cell-type distribution of clusters with differential composition in multiple diagnosis groups (upper), or one diagnosis group (lower), and table (right) listing clusters with distinct compositional changes (STAR Methods; Table S4; EX, excitatory neuron; IN, inhibitory neuron; OL, oligodendrocyte; AST, astrocyte; OPCs, oligoprogenitor cells; MICs, microglia; ENDs, endothelial cells). See also Figures S1, S2, and S3.
Figure 2.
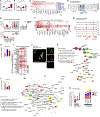
Figure 2.. Shared and distinct neuronal and glial disease states in disorders vs. controls
(A) Stacked barplot distribution of disease-associated clusters by cell type. (B and C) Heatmap showing compositional changes in each diagnosis group vs. controls of selected (B) neuronal and (C) glial subclusters (red, enriched in disease; blue, depleted in disease; log10(FDR) × sign(log2 fold change [FC]) of differential composition. Significance thresholds indicated by boundary thickness corresponding to FDR< 0.05 = thick border, and <0.1 = thin border (see STAR Methods and Table S4). Listed above are marker genes with putative functions shared by closely related clusters based on hierarchical clustering (Figures S2 and S3; Table S2) and below are cluster-enriched genes (Table S2). FDR corresponds to FDR-corrected p value unless otherwise indicated (STAR Methods). (D) Characterization of shared depleted (AST-1) and enriched (AST-0) astrocyte clusters (top: barplot of differential composition by diagnosis group vs. controls in each brain region (*FDR < 0.1 [limma; all disease vs. control]; Table S4); below left: marker genes differentially expressed (DE) in INS_AST-1 or INS_AST-0 compared with other INS-AST (Table S2); below right: scatterplot of INS_AST-0 cell proportion vs. tau pathology score per sample, colored by disorder (Spearman’s correlation for PSP) (gold, n = 11; Table S4). (E) AD-specific microglia state from motor cortex showing differential composition in AD vs. other samples (log2FC, **FDR < 0.01 [limma], corrected over 4 BA4-MIC clusters), and (below) protein-protein interaction (PPI) network with direct PPI enrichment p value among genes upregulated in BA4_MIC-7 in AD vs. all other conditions (Table S5) highlighting AD disease genes (large circles) and functional categories (colored circles). (F) ITMB immunostaining in microglia in AD brains compared with bvFTD brains (left, frontal cortex; right panel boxplot, unpaired Student’s t test, ***p = 0.0009, n = 4; see Figure S5D for ITM2B+ neuron image). (G) Enrichment of AD GWAS variants among genes upregulated (up) in BA4_MIC-7 microglia (AD case vs. control), but not in genes downregulated (down), or in other BA4 microglia clusters (MAGMA software, —log10(FDR) corrected over 8 comparisons shown). See also Figures S2, S3, S4, S5, and S7.
Figure 3.
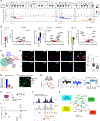
Figure 3.. Disease-specific neuronal and glial states
(A) Decreased astrocyte cell count proportions by subject in PSP for V1 astrocytes (controls n = 7, PSP n = 6, AD n = 7, FTD n = 6; FDR [limma] over 72 comparisons of 3 diagnosis groups, 3 brain regions, and 9 cell classes; Table S4). (B) Deconvoluted cell proportions based on bulk RNA-seq (Bisque, Wilcoxon p value; controls n = 7, PSP n = 8; FDR corrected over 21 conditions). (C) Heatmap showing DE genes in PSP V1-AST (log2FC, linear mixed effects model [LME], Table S5). (D) Chromatin accessibility peaks at the GFAP promoter of different AST subclusters based on snATAC-seq (C18–C25; see Figures S6A and S6B; coverage, ATAC signal range normalized by ReadsInTSS). (E) Barplot showing differential chromatin accessibility in PSP vs. controls, but not other disorders, at astrocyte-specific hypermethylated regions (%mC peaks) in astrocyte cluster C22 and (below) at regions differentially methylated by cell type as indicated by the x axis (BA4 and INS, n = 8–11 per diagnosis group and brain region; loss of heterochromatin (red) and gain of heterochromatin (blue) interpreted as loss or gain of chromatin silencing at cell-type-specific hypermethylated sites. (F) Heatmap of differential gene activity of REST and additional C22 marker genes compared with other AST snATAC-seq clusters across all samples (log2FC of gene activity score, disease vs. controls, ArchR; Table S7). (G) Chromatin accessibility peaks showing higher activity at the REST but not adjacent POL2RB promoter in C22 (coverage, ATAC signal range normalized by ReadsInTSS, across all samples). (H) Differential composition of nuclei in INS_EX-5 from bvFTD vs. control, compared with PSP and AD (Table S4, *FDR = 0.06 adjusted [limma] for 3 disorders and 11 INS-EX clusters). (I) DE of bvFTD/ALS or PSP risk genes in INS_EX-5 in bvFTD AD or PSP vs. controls (*Z score > 3, LME). (J) OPTN protein staining of layer 2 excitatory neurons (TUJ1+) in the bvFTD insular cortex. (K and L) (K) PPI network among genes upregulated in INS_EX-5 in bvFTD vs. all other conditions (Table S5) highlighting ALS/bvFTD risk genes (large circles) or enriched Gene Ontology (GO) (key). PSP-enriched neuronal state in visual cortex (V1_EX-2), showing (L) differential composition compared with control of V1_EX-2 in bvFTD, PSP, or AD (*PSP vs. all other samples, FDR < 0.05; Table S4). (M) PPI involving genes enriched in layer 2/3/4 vs. 5/6 neurons (WNT3) and genes upregulated in V1_EX-2 neurons in PSP vs. controls (Table S5) showing PSP risk genes (large circles) and enriched GO (key). (N) PSP risk gene expression in layer 5/6 EX compared with layer 2/3/4 EX from V1, shown as stacked barplot combining changes observed in each diagnosis (***FDR < 0.001, **FDR < 0.01, *FDR < 0.05, t-statistic, Table S5). See also Figures S5, S6, and S7.
Figure 4.
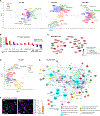
Figure 4.. Cross-disorder comparisons of selectively depleted neuronal clusters identify RORB as shared repressor of disease-associated genes
(A) Differential cluster composition by diagnosis group across all excitatory neuronal clusters (black, insula; gray, BA4; and white, V1). Clusters grouped hierarchically based on overlapping marker genes (Figure S2). Below each cluster, colored by disorder (AD in red, bvFTD in blue, PSP in yellow), is the differential composition score (STAR Methods; −log10(p value) × sign (log2FC) of each disease vs. all other samples [limma];Table S4). (B) Left panel bar graphs: differential composition per disease (*FDR < 0.1, **FDR < 0.01, ***FDR < 0.001; corrected for two comparisons shown); right panel: volcano plots showing DE genes, comparing each disorder-specific depleted cluster with the non-depleted “matched” cluster sharing the most similar marker genes (see Figure S4C and Table S5). (C) Overlap of DE genes in selectively depleted vs. matched clusters for each disease (log2FC > 0.20, FDR < 0.05). (D) IHC (left) and quantification (right) showing the depletion of KCNH7+ neurons in layer 5 (RORB high) neurons in motor cortex used for snRNA-seq (n = 7 per diagnosis) and in independent frontal cortex (n = 3 per condition) (p = 0.043 AD vs. control, p = 0.22 motor vs. frontal cortex, two-way ANOVA). (E) Differential expression of RORB in INS_EX-2 (layer 2/3 IT neurons; *p adjusted < 0.05, FDR corrected over 3 disorders). (F) High RORB immunostaining in layer 2/3 cortical neurons in INS in bvFTD. (G) Differential RORB binding in layer 2/3 EX (ATAC INS_EX C2 subcluster C8) based on footprinting. (H) Model of RORB repressing gene expression of NPTX2 in selectively depleted neurons. (I) DGE of RORB relative to NPTX2 in INS_EX-2 neurons in disease vs. control (t-statistic, LME; Table S5). (J) Chromatin accessibility peaks (Peaks) at the RORB binding site proximal to the NPTX2 promoter in INS_EX (ATAC cluster C2; coverage, ATAC signal range normalized by ReadsInTSS; Chr7: 98611427–98621427). (K) PPI plots and p value (STRING) of bvFTD-specific RORB target genes, based on footprinting, also downregulated in bvFTD in INS_EX-2 compared with INS_EX-5 neurons (t < −2, LME, Table S5), highlighting enriched GO terms (key). See also Figures S8 and S9.
Figure 5.
Figure 5.. Transcription factor network inference identifies regulons active across cell types, disorders, and brain regions
(A) Schema of strategy for cross-disorder comparison of TF activity within cell type and brain region and workflow for validation of SCENIC predictions using snATAC-seq and footprinting. (B) Heatmap of relative regulon specificity score (RSS) ranks among top 25 TF regulons ranked for each disorder, cell type and brain region, highlighting distinct and shared GRNs. (C and D) PPI and associated pathways enriched among GRN with disorder-specific differences in activity in INS-EX, including (C) YY1 and (D) DBP (p values from STRING; see Figure S9K and Table S6). (E) Scatterplot of correlation between relative RSS determined from SCENIC (gain in rank vs. control) and differential accessibility of 11 TFs with greater activity in disease than control (Pearson’s correlation = 0.60, p = 0.00025; Table S6). See also Figures S9 and S10.
Figure 6.
Figure 6.. Distinct GRNs drive disorder-specific microglial states in AD and PSP
(A) Multidimensional scaling (MDS) plots showing distinct and shared microglial GRNs by brain region (STAR Methods). (B) Diffferential gene expression (DGE) (disease vs. controls) of select SPI1 network genes in BA4 MIC (Table S5). Black boxes below indicate genes indicated to be bound by SPI1 in AD MIC based on footprinting (BA4 C7; Table S7). (C) Combined GRN of TFs with increased activity in AD BA4_MIC-7 (USF2, NR3C1, MX11, and SPI1) based on gene overlap (Figures S10A, S10B, and S10D) with edge length proportion to (1-GRN) score, node color proportion to DGE in BA4_MIC-7 from AD vs. non-AD, and node border color indicating GO (key). (D) MDS plots of AST GRNs in V1 (STAR Methods). (E) Combined PPI (gray edges) and GRN (blue edges) plot of TFs with increased activity in PSP V1-AST (turquoise; Figures S10A and S10B; Table S6) with enriched GO terms. Enrichment p value from STRING. (F) Immunohistochemistry and quantification of CUX1 staining in V1 AST of PSP vs. control (unpaired t test, *p = 0.023, n = 5). Arrows indicate astrocyte staining for CUX1. Barplot showing mean ± SEM. See Figures S11A–S11C. See also Figures S10 and S11.
Figure 7.
Figure 7.. MAFG/NFE2L1 drives a resilience program
(A) Cross-cluster comparison between INS-EX of MAFG GRN scaled activity score (SCENIC, Table S6), and expression of MAFG and NFE2L1 and their target gene, VCP, in all samples (*t-statistic > 2, LME; Table S2). (B) PPI plot of the MAFG GRN from INS-EX (top 250 genes) including MAFG targets validated by TF footprinting (large circles) (Table S7) and enriched GO. (C) Scatterplot showing differences across clusters in the relative expression of MAFG (top) and NFE2L1 (bottom) compared with VCP (% of cells where gene is detected; each dot represents one INS_EX cluster per disease group; Pearson’s correlation, p = 2.9e–13, n = 42). (D) Model showing that MAFG/NFE2L1 drives a neuroprotective program in cells otherwise highly vulnerable to neurodegeneration, including VCP and PSP risk genes. Large circle = target validated by footprinting. (E) Scatterplot showing inverse correlations between tau pathology score and proportion of MAFG/NFE2L1-high neurons (INS_EX-4; Pearson’s correlation and p value across all disorders shown at trendline, and within each disorder shown at key). (F) Barplots comparing layer 5/6 NP neurons (INS_EX-13) in AD (spared) vs. PSP (depleted), showing the percent of cells expressing MAFG/NFE2L1, NFE2L2, VCP, or PSAP (left) and MAFG/NFE2L1 target genes (right), and also showing their widespread reduced expression in PSP. See Figures S11D and S11E and Tables S6 and S7.

Update of

References

    1. Bahia VS, Takada LT, and Deramecourt V. (2013). Neuropathology of frontotemporal lobar degeneration: a review. Dement. Neuropsychol 7, 19–26. 10.1590/S1980-57642013DN70100004. - DOI - PMC - PubMed
    1. Chung DC, Roemer S, Petrucelli L, and Dickson DW (2021). Cellular and pathological heterogeneity of primary tauopathies. Mol. Neurodegener 16, 57. 10.1186/s13024-021-00476-x. - DOI - PMC - PubMed
    1. Young JJ, Lavakumar M, Tampi D, Balachandran S, and Tampi RR (2018). Frontotemporal dementia: latest evidence and clinical implications. Ther. Adv. Psychopharmacol 8, 33–48. 10.1177/2045125317739818. - DOI - PMC - PubMed
    1. Boeve BF, Boxer AL, Kumfor F, Pijnenburg Y, and Rohrer JD (2022). Advances and controversies in frontotemporal dementia: diagnosis, biomarkers, and therapeutic considerations. Lancet Neurol. 21, 258–272. 10.1016/S1474-4422(21)00341-0. - DOI - PubMed
    1. Fu H, Hardy J, and Duff KE (2018). Selective vulnerability in neurodegenerative diseases. Nat. Neurosci 21, 1350–1358. 10.1038/s41593-018-0221-2. - DOI - PMC - PubMed

MeSH terms

LinkOut - more resources